Gilberto Oliveira Neto, Ana Caroline França, Anderson Oliveira (2025). Analyzing Resource Performance in a 3D Virtual Immersive Environment. In: Human Factors in Design, Engineering, and Computing. AHFE Open Access, vol. 199, pp. 987–995. https://doi.org/10.54941/ahfe1006911
This paper presents a comprehensive approach to performance testing in 3D virtual reality applications developed using Unity, with a focus on continuous evaluation and optimization throughout the development process. The methodology started with an immersive 3D application over four versions and used native tools from the Unity engine (Profiler) to measure specific performance metrics, such as CPU, GPU, memory, audio, video, physics and UI usage. This approach allowed for early identification of problems (bottlenecks) and continuous optimization of the application at each stage of development. The main results include significant improvements in memory usage, reduction in the number of batches and triangles rendered, and adjustments to the physics that resulted in improvements in the frame rate. The study also highlights the importance of balancing visual fidelity with performance optimizations, and that continuous performance testing is essential to create optimized immersive applications, emphasizing the importance of initial profiling and iterative improvements.
Extended Reality (XR) technology has presented visible potential in several fields, with a wide scope of action: gaming and entertainment, business and tourism, medical, educational, retail, among many others (Kumar et al., 2025). In 2024, the XR technology market reached a value of $56.54 billion by 2024 according to the “Extended Reality Global Report” (The Business RC 2025), and the expectation is to reach a compound annual growth rate of 28,1% in the following years.
As an umbrella term, XR contemplates the different types of immersive technologies: augmented reality (AR), virtual reality (VR), and mixed reality (MR). AR consists of a technique where the user can view virtual elements superimposed on real-life scenarios and interact with them in real-time (Kumar et al., 2025). VR, on the other hand, completely replaces the real world for a complete virtual scenario with virtual elements (Vohra, 2025), while MR is a hybrid experience containing elements of both (Speicher et al., 2019).
VR systems can be immersive - where a completely simulated experience is provided by immersive systems, non-immersive - which happens via a screen, or a desktop, such as video games, or semi-immersive - where the user connects with the virtual world but still aware of his real-life surroundings (Kumar et al., 2025), (Vohra, 2025).
Regardless of the context in which an immersive scenario is used, there are some issues needed to be considered for providing a positive experience for the users, such as sensorial feedback, spatial audio, face tracking, etc. Moreover, it is equally important to avoid negative emotions, as frustration, confusion and cognitive overload (Gorantla et al., 2023). Providing this experience has a huge toll in how the overall idea and user experience is designed, but it is equally important to evaluate technical elements to ensure how well this space will perform. This means that even when an experience is well designed, if it is lagging, the connection is breaking, the user interface (UI) and 3D elements are jittering and/ or the device is overheating, the application is certainly delivering a negative experience to the final user.
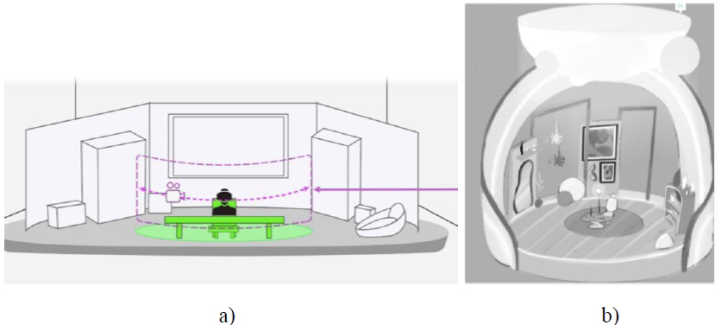
In this work, the environment used was an immersive VR space as part of an application for VR head-mounted devices. The concept of the immersive scene is shown in Fig. 1 a) and it consists of a scenario composed of about 30 objects in FBX format (Jeong et al., 2018), such as a skybox, scene elements, props, illumination assets, which were built with over 1,000 texture images, and a GLTF format avatar (Lee et al., 2019) can interact within it. A simplified sketch is shown in Fig. 1 b).
Figure 1: a) Concept of the immersive scene; b) Studio simplified sketch.
Since immersive applications need more computer power than the non- immersive ones (Checa et al., 2023), our study discloses a set of strategies used to diagnose and then optimize the application. The analyses involved identifying bottlenecks by profiling the application to determine the impact of individual assets on memory, CPU, and GPU usage. With this, identifying assets and other elements in the scene that could contribute to potential resource overhead. This performance test strategy was created with the intention to provide timely technical insights so that the development
Analyzing Resource Performance in a 3D Virtual Immersive Environment 989
team could make informed choices for the application or service’s overall performance and, therefore, provide more stable user experience overall.
In next section, we describe the optimization approaches. Some analyses and results are shown on section of results, then we finished the analysis on the section of conclusions.
INVESTIGATING BOTTLENECKS IN THE SCENE Next, we will describe in more detail how we carried out the application performance tests on devices directly from the development engine for diagnostic purposes and evaluation of performance behavior for user satisfaction.
All this analysis is to determine the behavior of the application during its development, allowing you to monitor during the process the real impact caused by each feature or new assets that are added, making it easier to locate bugs and diagnose them, leading to a faster and more accurate solution.
Regarding the effect on the project carried out, it was possible to identify 3D assets that had a weight disproportionate to their importance as features, scripts with more recursions than adequate for the performance of a given method, behaviors of some methods occurring for longer than necessary, causing overloading of the application, use of UI and canvas in different modes, etc.
Creating video games can be a very complex process, requiring consideration of various hardware and software constraints (Koulaxidis et al., 2022). This constraint makes performance one of the most critical requirements, meaning that a game must be designed and developed with great care. To reduce the resources a game uses, optimization techniques can be applied at different stages of development, especially at key moments in the user flow, as shown in Fig. 2: entering the application, interacting with the UI, utilizing the main features (recording video, extracting video, changing scenarios, e.g.).
Figure 2: Test workflow example.
Figure available in the original PDF paper.
Tools The analysis is performed in the digital game development engine Unity (Unity Technologies, 2023), which has an analysis feature called “Profile”.
This tool allows you analyze and compare multiple frame information on the device while the application is in use.
This includes information about the behavior of the CPU, rendering, memory, audio, video, physics, physics 2D, user interface (UI), real-time global illumination (GI), and virtual texturing.
This tool is used together with other modes in the analysis category, such as “Profile Analyzer”, “Frame Debugger”, and “Memory Profiler”.
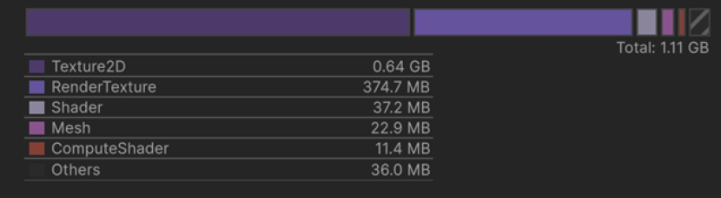
Together, these tools provide increasingly more information about the behavior of the application in a given frame. Fig. 3 shows the top objects cathegory consuming RAM in a scene via “Memory Profiler”.
Figure 3: Top objects category consuming RAM.
Data The information that can be obtained from the tools mentioned above refers to: rendering order of the user’s screen, CPU processing time (in seconds and milliseconds), files viewed per frame, size in megabyte (MB) of each asset in the project, and its dependents, scripts, and even some recursive methods running in that frame. It is possible to immediately identify and locate all types of assets that make up the application simultaneously in frame.
Application Evaluation Process and How to Collect Data Since this process is an in-depth investigation to evaluate the application’s behaviour, all possible steps that the application offers the user must be taken, and the analysis data provided by the tools mentioned above must be recorded. The recording must be done by action or by event, in all environments, from the initial menu to the completion of the application’s objective.
It is important to visit all developed methods, including application pause times. A good practice is to record all states that the tool demonstrates so as not to lose any data, as a method may not be being used but still being called.
Device This analysis must be performed on the device on which the application will be used, i.e., the XR glasses, so that the hardware being evaluated is the one on which the application will run. However, the analysis takes place within the Unity engine, which is running on a computer. In this case, the Unity analysis tool allows you to connect the XR glasses to the computer and select it so that the tool uses the device’s processor instead of the processor of the computer on which the test is being performed. Thus, these analyses will definitively contain the state of the application on the device on which it will be presented to the user. Note that this tool is for evaluating and diagnosing the behaviour of the application, and not the functions and analysis of the device itself.
Analyzing Resource Performance in a 3D Virtual Immersive Environment 991
ANALYSIS AND RESULTS The experiment began as an ongoing task that aimed at measuring the application’s health in terms of performance and memory usage during software development process. By doing that, the diagnoses would bring bottlenecks and potential issues early in the process, serving as guide for important technical decisions and ensuring standard performance for good user experience.
Each performance test took place after the release of a new software version. Each version was released on an average of 3 months, and each milestone the application had a set of new features added in relation to the previous one. The analysis below provides a framework for optimizing resource-heavy applications, ensuring smoother performance in 3D virtual environments.
The Performance analysis frames each moment in the user flow: entering the application, interacting with the UI, utilizing the main features (recording video, extracting video, changing scenarios, e.g.).
For each frame, an overall profiling of the application is made, contemplating the seven following categories: 1) CPU Usage 2) Rendering 3) Memory 4) Audio 5) Video 6) Physics and 7) UI, where “physics” refers to the simulation of physical interactions within the game, such as collisions, movement, and gravity (Dickinson 2015). Each category would then present a set of metrics, making it possible to gather relevant data for insights about the application’s health. To present the optimization results in this section, we used 4 versions of the application, named as versions: 0.1, 0.2, 0.3 and 0.4.
Based on the data made available from the profiling of one of the frames in the user flow of the application in the example above, the opening scene of version 0.4, the main issues found were:
Increase of GPU memory usage due to XR Interaction plug-in update.
Animations inserted in the UI interactions may cause instability on device.
Before the next version is released, the impact in memory and the overall application’s stability ought to be considered, and the improvements would be added to the cycle’s backlog and implemented accordingly.
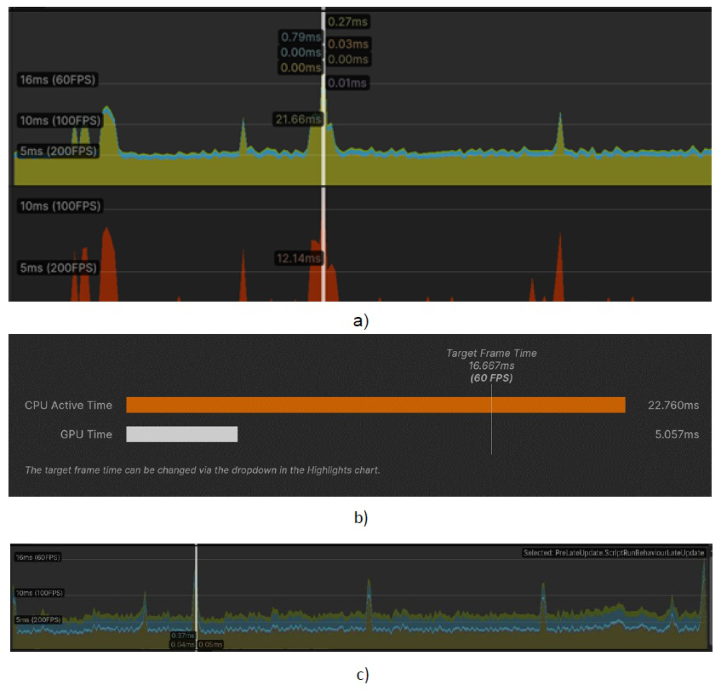
As can be seen in the example above, taken from the initial scene profiled from version 0.1, it was revealed that there are two 3D objects using render texture at the same time by the CPU, causing frame drops. As the objects were in two separate spaces and the user could occupy only one at a time, there was unnecessary processing happening. With this insight, the team could rethink the feature and make sure each object would only use render texture once the user entered a space, while the 3D object in the other space would be deactivated. The optimization proved to have worked already on version 0.2, where the frame drops halted.
Other issues found on version 0.1:
A 3D asset prop was in the top heaviest meshes, along with the avatar’s head and body.
Multiple audio recording features were active at the same time. The report indicated that this happened even when the user was not using any recording feature.
Around 3 months later, in addition to new features and architecture improvement, other issues were solved on version 0.2:
Lighter mesh for 3D assets.
The extra audio recorder was removed.
Figure 4: CPU usage in both versions, v0.1 (a and b) and v0.2 (c), where v0.1. presents instability and consistent frame drops (a), while 0.2 presents stability and no drops of frames (c).
Besides the fixes and adjustments addressed based on the previous performance test report, each version of the software contained a bigger number of features than the previous one. Therefore, each performance test contained a larger number of user scenarios to test, assets in the scene and combinations of actions. Here’s some data gathered from the two following performance test reports:
Analyzing Resource Performance in a 3D Virtual Immersive Environment 993
New issues found on version 0.2:
Avatar updated physics caused frame drops (new feature).
Large invisible object, with high memory consumption and large dimension was spotted, but not visibly found.
UI transitions heavier than the UI element itself.
Figure 4 a) shows a CPU error, taking a long time to load frames, and Fig. 4 b) shows that in v0.2, Fig. 4 c), this problem was fixed.
Issues fixed on version 0.3:
Avatar physics tested with different plugin versions for movement and presented improvement of 15fps in memory usage and improved visuals.
Large object found and deactivated when it was not in use.
General improvement for 3D assets: scenario areas were segmented into asset clusters. Version 0.3 was using 35% less memory than v0.2.
Audio system issue presented on 0.1 was updated to an optimized version, with better syncing in the videos and a lighter and faster exporting process.
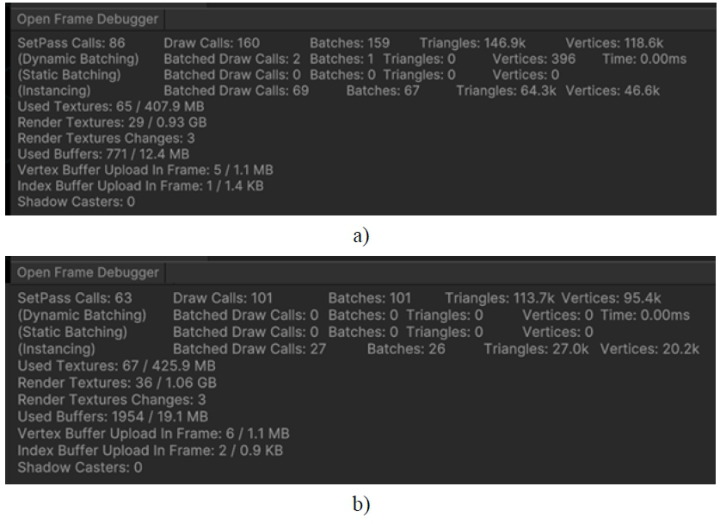
Figure 5: Rendering analysis of a frame where a user is inside an immersive scenario interacting with a 2D menu interface. In the scene there is a menu, an avatar, and a 3D scenario. a) v0.3, b) v0.4.
Both versions were tested in terms of memory usage and an improvement of 58 batches could be observed from v0.3 to v0.4 (falling from 159 to 101 batches) and in the number of triangles (146.9k to 113.7k). As a result, the
application would perform considerably lighter and be less likely to get stuck while using it. This could be achieved due to measures taken towards the 3D elements segmentation into asset clusters and use of lighter meshes. The early performance diagnosis was essential in guiding the development process and the assets’ making towards a more optimized immersive application. Fig. 4 shows a rendering optimization from version v0.3 to v0.4.
CONCLUSION
In the scope of software performance testing, the appropriate tool will depend on the kind of software and the environment where it is created. As the disclosed experiment was conducted in a 3D virtual reality Unity software, Unity Profile was the adequate tool to be used. The first lesson learned was that by diagnosing the performance of each software milestone, it was possible to identify bottlenecks and potential resource overhead.
The experiment framed each step of the ideal user flow of the application and profiled each in terms of CPU Usage, Rendering, Memory, Audio, Video, Physics and UI. With this, metrics and data could be analysed for specific scenarios and use cases, generating insights and opportunities for improvement.
It is possible to conclude that the use of ongoing performance testing in the context of immersive software development made an impactful improvement in terms of CPU usage, rendering (GPU) and memory usage, proving the proposed experiment to be useful and a complement to the quality assurer’s test, making sure the user receives software that is not only functional, but optimized and performative. Aspects such as subtleties perceived by the user, such as frame smoothness and input latency, remain as points for future improvements.
ACKNOWLEDGMENT
This work was presented as part of the results from project “Sidia-M VST Platform and Applications”, carried out by Sidia Instituto de Ciência e Tecnologia in partnership with Samsung Eletrônica da Amazônia LTDA, according to IT Law n.8387/91 and article 39 from Decree 10.521/2020.
REFERENCES
Checa, D., Miguel-Alonso, I., Bustillo, A. (2023). "Immersive virtual-reality computer assembly serious game to enhance autonomous learning", in: Virtual Reality Vol. 27 pp. 3301–3318. https://doi.org/10.1007/s10055–021-00607–1. Dickinson, C, ed. (2015). Unity 5 Game Optimization. Packt Publishing Ltd. https://
books.google.com.br/books?id=fvmoCwAAQBAJ. Gorantla, B., Devineni, S. (2023). Evaluation of User Experience (UX) Design for Emerging Technologies. Computer Science, Engineering and Technology. Vol. 1, pp. 39–47. https://doi.org/10.46632/cset/1/3/6. Jeong, T., Kim, Y. (2018). A new lightweight file format based on FBX for efficient
3D graphics resource processing. Journal of Theoretical and Applied Information Technology. Vol. 97, pp. 2393–2403.
Analyzing Resource Performance in a 3D Virtual Immersive Environment 995
Koulaxidis, G., Xinogalos, S. (2022). Improving Mobile Game Performance with Basic Optimization Techniques in Unity. Modelling. Vol. 3, Number 2, pp. 201–223. Kumar, S., Suresh, S. (2025). Introduction to Augmented Reality and Virtual
Reality. Introduction to Extended Reality (XR) Technologies. Chapter 4. Scrivener Publishing LLC. https://doi.org/10.1002/9781119857716.ch4. Lee, G., Choi, P., Nam, J., Han, H., Lee, S., Kwon, S. (2019). A Study on the Performance Comparison of 3D File Formats on the Web. The International Journal of Advanced Smart Convergence. Vol. 8, Number 1, pp. 65–74. Speicher, M., Hall, B. D., Nebeling, M. (2019). What is Mixed Reality. Proceedings
of the 2019 CHI Conference on Human Factors in Computing Systems, pp. 1–15. https://dl.acm.org/doi/10.1145/3290605.3300767. The Business Research Company Homepage (2025). What Is Covered Under Extended Reality Market?, https://www.thebusinessresearchcompany.com/report/ extended-reality-global-market-report, Accessed on March 25, 2025. Unity Technologies (2023), https://unity.com/, Game Development Platform v.
2023.2.3. Vohra, M. (2025). Different Uses of Extended Reality. Introduction to Extended Reality (XR) Technologies, pp. 37–59. Scrivener Publishing LLC. https://doi.org/ 10.1002/9781119857716.ch3.
LISTED IN THE AHFE DIGITAL BOOKSTORE CATALOGUE
Explore the complete digital volume
Human Factors in Design, Engineering, and Computing
Read this individual research paper free through the original publisher, or explore the full digital proceedings book.
ISBN 978-1-964867-75-5
Explore this ISBN in the AHFE Bookstore ↗Listed in the July 2026 bookstore catalogue; search by ISBN to confirm current availability · Digital book purchase optional