Josef Pavlicek, Martin Molhanec, Petra Pavlíčková, Matěj Brnka (2025). Usability Issues in BPMN Models Analyzed Using Eye-Tracking Technology. In: Human Systems Engineering and Design (IHSED2025): Future Trends and Applications. AHFE Open Access, vol. 198, pp. 53–62. https://doi.org/10.54941/ahfe1006761
EEye-tracking technology is a powerful tool in human-computer interaction (HCI), capturing users’ visual attention and tracking their eye movements. This technique helps determine where a person is looking at any given moment and the sequence of their gaze. It, therefore, provides information about their visual and cognitive functions. Data collected in this way can be objectively processed, leading to the design of more efficient and user-friendly interfaces. Business Process Model and Notation (BPMN) is widely recognized for its clear and understandable representation of business processes. It is generally used to manage organizations. This study aims to describe eye-tracking technology in the context of BPMN. In this study, we worked with BPMN and used an eye tracker to generate visual heatmaps to represent the focus areas of the participants under study. The experiments were conducted using the web-based tool GazeRecorder, which is free and available online. Participants walked through business process models demonstrating actions, choices, and potential interactions within systems such as booking a flight, ordering food online, or purchasing electronic devices (e.g., TV, PC, smartphone). The study determined which BPMN symbols are challenging to interpret and how the overall quality of the BPMN can be improved.
Business Process Model and Notation (BPMN) is a standard tool for visualizing business processes that has become a key element in process management. BPMN models enable companies to document, analyze, and optimize workflows effectively. Although BPMN offers a rich visual representation of processes, its increasing complexity often hampers interpretation and comprehension. This paper focuses on using eye-tracking technology to analyze the user experience when working with BPMN models. The aim was to determine which model elements are intuitive for the user and which cause confusion. This could lead to potential errors in their implementation and use.
The article “Conducting eye-tracking studies on large and interactive process models using EyeMind” (Abbad-Andaloussi et al., 2023) deals with similar work to our team. The authors created EyeMind software to evaluate EYE- TRACKING. They aim to assess the tracking of diagrams in the notation of BPMN 2.0. In their future work, they want to expand tracking to other types of diagrams. An important and extensive work is (Lübke et al., 2021). The authors emphasize that the clarity of BPMN diagrams is essential for their understanding. This directly impacts their perceived quality and correctness. Another work (Maslov and Poelmans, 2024) also examines a similar topic. This work also contains a statistical evaluation of the observations. The authors also suggest advice on how to create a better BPMN model. A comprehensive study by (Duarte et al., 2020) includes a systematic literature review of eye-tracking usage to understand process models. This study states that the eye-tracking method is not sufficiently used in the business process community. This study also proposes recommendations for improving BPMN. In their work (Zimoch et al., 2018), the authors state that comprehending ordinary models leads to a high cognitive load, especially for novices. The authors state that the results of their work can lead to an increase in the understandability of BPMN models.
It is worth mentioning that our team has been working on this topic for a long time. The beginning of our research was marked by the article “The Business Process Model Quality Metrics” (Pavlíˇcek et al., 2016), where we focused on the general design of BPMN model quality metrics. Measuring the efficiency of BPMN is a multidimensional task. One aspect involves mathematical frameworks, which allow for the construction of quality measures, for example, based on the number of decision blocks in the model. Another critical discussion is whether the Parallel Gateway is more complex to use (which is likely) than a simple XOR Gateway.
Another dimension is how accurately the model represents an existing business process. This issue has been widely discussed in the literature, and we can refer, for instance, to (Leemans et al., 2013). Our team is also familiar with eye-tracking technology to analyze the complexity of specific nodes in process diagrams. In recent years, we have published several articles dealing with the application of eye tracking in measuring the complexity of process models (Pavlíˇcek et al., 2023). Our research team has shifted focus to general models describing everyday activities, measuring their complexity using heatmaps generated from eye-tracking data.
MATERIAL AND METHODS The study employed an experimental method based on eye-tracking using the GazeRecorder tool. This software allows for analyzing a user’s visual trajectory when interacting with BPMN diagrams.
Usability Issues in BPMN Models Analyzed Using Eye-Tracking Technology 55
The study methodology included the following key steps:
Selection of BPMN Models: Several models representing different business processes were chosen, such as flight booking, online food ordering, and electronics purchasing. These models varied in complexity and the extent of BPMN element usage.
Participant Recruitment: Respondents with various experiences with BPMN were recruited, enabling a comparison of their perceptions of the diagrams. The process models were gradually presented to groups of five participants at a time. These participants were selected based on their willingness and interest in eye-tracking research. Demographically, they ranged in age from 22 to 39 years old, thus providing a representative sample of this age group. The research was conducted as a qualitative usability study, following the Usability Testing principles defined by Jakob Nielsen (Nielsen, 1993).
Eye Movement Analysis: Participants were shown BPMN models while the software tracked fixations, gaze trajectory, and the duration of visual processing of different model parts. The outputs were analyzed using heatmaps, highlighting areas with the highest visual attention.
Test Design and Setup Usability testing with eye-tracking technology follows a structured approach that includes the following key steps:
Task Definition: Participants are assigned specific tasks, such as navigating a BPMN diagram or identifying key steps in a process model. These tasks simulate real-world scenarios, ensuring the test reflects authentic user interactions with BPMN diagrams.
Eye-Tracking Calibration: Before the test begins, the eye-tracking device is calibrated to ensure precise tracking of each participant’s gaze. Calibration requires participants to focus on specific points on the screen, allowing the system to map their eye movements accurately.
Data Collection and Analysis: During the test, the eye-tracking system records where users look, how long they focus on each element, and the sequence of their gaze movements. This data is then analyzed to identify user attention and comprehension patterns, helping designers improve BPMN diagrams based on real user behavior.
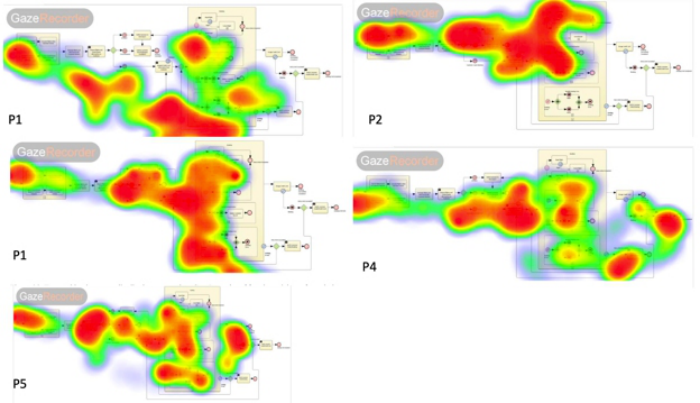
Modelling Real-World Scenarios Experiment 1 The BPMN Process Model for Ordering Flight Tickets in Fig. 1 includes several key components that represent the different stages of booking a flight. Based on the diagram structure, the process appears to follow these steps:
Customer Request: The process starts with a customer requesting a flight ticket.
Flight Search and Selection: A system or agent searches available flights, filters the options, and presents them to the customer.
Customer Decision: The customer selects a preferred flight based on price, time, and airline options.
Passenger Information Input: The customer provides necessary personal details such as name, ID/passport number, and contact details.
Payment Processing: The system processes the payment through a selected payment gateway.
Booking Confirmation: The system generates a booking confirmation, sends it to the customer, and reserves the ticket.
Ticket Issuance: The final stage is when the flight ticket is issued and delivered via email or a travel account.
The diagram also includes:
Gateways (Decision Points): Indicating conditions such as successful payment validation or alternative steps if the flight is unavailable.
Sub-processes: Representing more detailed workflows like payment verification or customer authentication.
End Events: Marking successful ticket issuance or failure due to payment issues or unavailable flights.
Figure 1: BPMN model for ordering flight tickets and eye-tracking heatmaps of BPMN model interpretation across participants.
Figure 1 presents the five individual heatmaps (P1–P5) generated through eye-tracking experiments, capturing how different participants visually processed a BPMN process model for ordering flight tickets. The heatmaps illustrate areas of high visual focus (red), moderate focus (yellow), and low attention (green to blue).
Participant observations:
Decision Gateways (Diamond-Shaped Elements): All five participants exhibit strong fixation points on decision gateways, particularly where the process flow splits into multiple paths. This suggests that users found
Usability Issues in BPMN Models Analyzed Using Eye-Tracking Technology 57
these areas crucial for understanding the model but potentially more complex to interpret.
Key Process Steps (Task Rectangles): The heatmaps focus on primary activities, such as flight selection, payment processing, and booking confirmation. These elements appear to require users to read and verify them carefully.
Sub-Process Sections: Participants focused intensely on sub-processes within large boxed areas, possibly due to their intricate nature and multiple nested elements.
Start and End Events: While receiving less attention than gateways or tasks, the start and end points of the model still show noticeable engagement, indicating users trying to grasp the workflow structure.
Experiment 1 conclusion: Across all five participants, a clear pattern emerges - decision points and key process steps consistently draw the most attention, implying that these are the most cognitively demanding parts of the BPMN model. This suggests that simplifying decision logic, reducing unnecessary text, and improving diagram clarity could enhance user comprehension and efficiency.
Experiment 2 The BPMN Process Model for the online pizza ordering process. The process follows these steps:
The process begins with the customer entering the pizza ordering system and starting the order.
The customer selects a pizza from the menu and places an order.
The order is confirmed and payment is made by the customer.
The pizza store receives the order, bakes the pizza, and prepares it for delivery.
The pizza is delivered to the customer.
The process ends when the customer receives and consumes the pizza.
Participant observations:
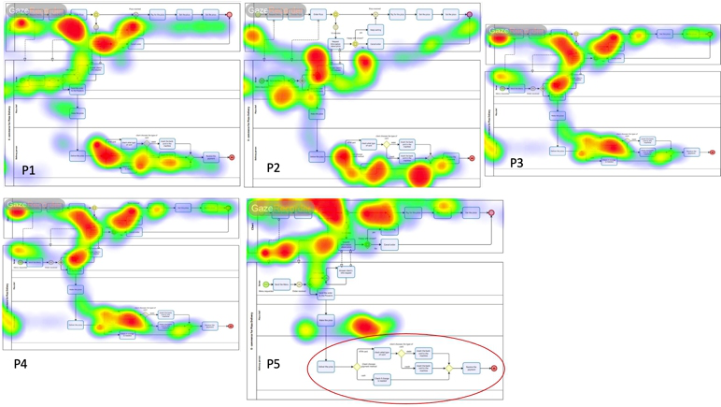
Decision Nodes (Gateways): Across all five participants, the highest attention was directed towards decision nodes, particularly at the beginning of the process, where the ordering and selection occur.
Order Processing & Payment Steps: A significant concentration of visual attention is observed in the sections dealing with order confirmation, payment processing, and interactions between the customer and the pizza store.
Process Transitions & Flow: Participants frequently revisited areas where process transitions occur, especially around the dashed message flows connecting different “swim lanes”, suggesting potential difficulty in tracking the sequence of steps.
End of the Process: For most participants, attention was also focused on the final steps of the process, particularly where the order is completed.
Figure 2: Eye-tracking heatmaps of BPMN model interpretation across participants and ordering pizza.
Anomaly in Participant P5’s Behavior: One notable deviation is seen in P5, where the participant did not fully engage with the final section of the model, marked by the red ellipse. This suggests that they already knew the correct process path from prior exposure to the study. This phenomenon, known as study bias or learning effect, introduces noise into the dataset. However, we are aware of this limitation, and it has been recorded accordingly to prevent it from affecting the study’s overall conclusions.
Experiment 2 conclusion: The model highlights decision points, such as whether the order is completed or if the user cancels at any stage. The diagram follows a structured workflow, showing interactions between the user and the system, including data access and order management processes.
Experiment 3 The BPMN Process Model for the electronic online purchasing and shopping process. The process follows these steps:
The process begins with the user entering the shopping portal and logging into their account.
The user then searches for and selects a product displayed using the product catalog.
After selecting items, the user adds them to the cart and manages their shopping cart.
The next step involves either checking out or abandoning the cart. If the user chooses to proceed, they pay, determining whether the order is successfully placed.
If the payment is completed, the system processes the order, handles shipment, and finally sends the customer a confirmation of order dispatch.
Usability Issues in BPMN Models Analyzed Using Eye-Tracking Technology 59
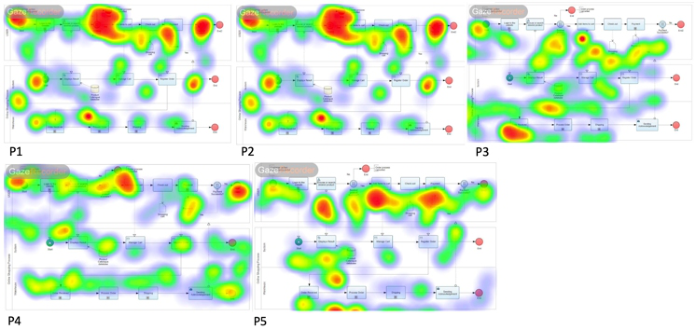
Figure 3: BPMN process model for the online electronic purchasing and “online electronics purchasing” eye-tracking heatmaps of BPMN model interpretation across participants.
Participant observations:
Initial Process Steps Attract the Most Attention: All participants firmly focused on the starting point of the process, particularly on the login and product selection steps. This suggests that users carefully examine the initial steps of the workflow before proceeding.
Decision Points Create Cognitive Load: The decision gateways, such as “Check-out or Abandon Cart?” and “Payment Verification,” received the highest concentration of visual fixations (red areas). This indicates that participants needed additional time to interpret and understand these elements, confirming that decision-making nodes in BPMN diagrams are cognitively demanding.
User-System Interaction Points Are Critical: Participants focused heavily on the “Manage Cart” and “Register Order” steps, likely because these actions involve interaction with the system and key transactional decisions. The fixation density in these areas suggests that users verify and double-check critical points before proceeding.
Less Attention on Backend Processes: The order processing and shipment steps in the lower “swim lane” attracted minimal attention. This aligns with expectations since these elements represent automated system actions, which users do not need to interact with or manually analyze in depth.
Variability Between Participants: While the general pattern is consistent, some participants focused more on specific elements, such as different stages of the checkout process. This could indicate that individual familiarity with online shopping processes influences how users navigate BPMN models.
Experiment 3 conclusion: The findings confirm that decision nodes and user-interaction points require careful design to ensure clarity. Notably, the checkout process, payment verification, and cart management stages
received the highest attention, highlighting areas that may benefit from design improvements. Meanwhile, automated system operations were largely ignored, suggesting that users primarily focus on elements they directly interact with.
RESULTS AND DISCUSSION
Results Conclusion The eye-tracking experiment revealed several key insights about user experience with BPMN models:
Decision nodes (gateways) caused the most difficulty: Participants frequently returned their gaze to earlier parts of the model, indicating uncertainty in interpreting decision conditions.
Complex sequential flows increased processing time: Users required more time to understand intricate connections between different steps in the model.
Excessive text labels were distracting: Lengthy descriptions in BPMN models diverted attention from the primary visual flow of the process.
The hierarchical structure of BPMN models played a crucial role: Diagrams with clearly separated sections were processed faster and with fewer errors.
Experienced users navigated more efficiently: Advanced users showed shorter gaze fixations and fewer regressions than beginners.
The results demonstrate that model complexity significantly influences users’ cognitive load, potentially leading to misinterpretation of business processes.
Recommendations for Improving BPMN Models Based on the eye-tracking analysis, several measures were proposed to enhance the readability and intuitiveness of BPMN diagrams:
Minimize the number of decision nodes (gateways): Complex decision- making should be broken down into separate model parts.
Limit textual content in diagrams: When longer descriptions are necessary, they should be accompanied by visual cues.
Use visual styling, such as color-coding, to emphasize key components of the model: Using different colors for various activity types can help users quickly identify critical elements.
Implement hierarchical structuring for complex models: More complex BPMN diagrams can be divided into multiple levels and displayed progressively.
Improve visual contrast between different model elements: More readable lines and increased node spacing can reduce visual confusion.
Design more intuitive symbols for less familiar BPMN elements: Users struggled to interpret lesser-known ones, suggesting a need for better standardization.
Usability Issues in BPMN Models Analyzed Using Eye-Tracking Technology 61
Discussion and Limitations of the Method Although the study provided valuable insights, some limitations should be noted:
Sample size: The study was conducted with limited participants. This limitation may reduce the generalizability of the findings.
Subjective perception: Different users may have varied approaches to interpreting BPMN models, making it challenging to quantify findings.
Technical constraints of the eye-tracking software: The accuracy of eye movement tracking may be influenced by device calibration and individual physiological differences among participants.
Lack of comparison with other methods: The study focused exclusively on eye-tracking and did not compare alternative methods for evaluating BPMN model usability.
Despite these limitations, the findings offer practical recommendations for improving BPMN model design and making its visualization more intuitive.
CONCLUSION
This study has shown that Eye-Tracking Analysis can play an essential role in evaluating the usability of BPMN models. The experiment results revealed key areas that cause users the most significant difficulties and provided recommendations for their optimization. A key finding is that complex BPMN models can be misinterpreted if not designed with user cognition in mind. Reducing the complexity of decision nodes, improving the visual structure, and using suitable visual guides can significantly increase the readability and usability of these diagrams.
In future research, it would be advisable to expand the sample of participants, include other evaluation methods of user experience, and compare BPMN with alternative notations of process models.
REFERENCES
Abbad-Andaloussi, A., Lübke, D. and Weber, B., 2023. Conducting eye-tracking studies on large and interactive process models using EyeMind. SoftwareX, 24, p. 101564. https://doi.org/10.1016/j.softx.2023.101564 Duarte, R. B., Silveira, D. S. da and Brito, V. de A., 2020. A systematic literature
review on the usage of eye-tracking in understanding process models. Business Process Management Journal, 27(2), pp. 346–367. https://doi.org/10.1108/BPMJ- 05-2020-0207 Jacob Nielsen (1993). Usability Engineering (Interactive Technologies), ISBN-10: 0125184069, Publisher: Morgan Kaufmann. Lübke, D., Ahrens, M. and Schneider, K., 2021. Influence of diagram layout
and scrolling on understandability of BPMN processes: An eye tracking experiment with BPMN diagrams. Information Technology and Management, 22, pp. 99–131. https://doi.org/10.1007/s10799-021-00327-7
Leemans, S. J. J., Fahland, D. and van der Aalst, W. M. P., 2013. Discovering blockstructured process models from event logs – a constructive approach. In: Colom, J.-M. and Desel, J. (eds.) Petri Nets 2013. Lecture Notes in Computer Science, vol. 7927. Springer, Heidelberg, pp. 311–329. https://doi.org/10.1007/978-3-642- 38697-8_17 Maslov, I. and Poelmans, S., 2024. Comprehension of (Business) Process Models via
Tokens: An Eye-Tracking Approach. In: Di Ciccio, C. et al. (eds.) Business Process Management: Blockchain, Robotic Process Automation, Central and Eastern European, Educators and Industry Forum. Springer Nature Switzerland, Cham, pp. 375–385. https://doi.org/10.1007/978-3-031-70445-1_26 Pavlíˇcek, J., Hronza, R., Pavlíˇcková, P. and Jelínková, K., 2016. The Business Process Model Quality Metrics. In: EOMAS 2016. Springer International Publishing. ISBN: 978-3-319-68184-9. Pavlíˇcek, J., Pavlíˇcková, P., Pokorná, A., Brnka, M. (2023). Business Process
Models and Eye Tracking System for BPMN Evaluation-Usability Study. In: Model-Driven Organizational and Business Agility. MOBA 2023. Lecture Notes in Business Information Processing, vol. 488. Springer, Cham. https://doi.org/ 10.1007/978-3-031-45010-5_5. Zimoch, M. et al., 2018. Utilizing the Capabilities Offered by Eye-Tracking to Foster Novices’ Comprehension of Business Process Models. In: Xiao, J. et al. (eds.) Cognitive Computing – ICCC 2018. Springer International Publishing, Cham, pp. 155–163. https://doi.org/10.1007/978-3-319-94307-7_12
LISTED IN THE AHFE DIGITAL BOOKSTORE CATALOGUE
Explore the complete digital volume
Human Systems Engineering and Design (IHSED2025): Future Trends and Applications
Read this individual research paper free through the original publisher, or explore the full digital proceedings book.
ISBN 978-1-964867-74-8
Explore this ISBN in the AHFE Bookstore ↗Listed in the July 2026 bookstore catalogue; search by ISBN to confirm current availability · Digital book purchase optional