In recent years, with the advancement of train operation control technology and the rapid development of modern electronic technology, many electronic devices have been widely used in the cockpit, significantly enhancing the automation level and information processing capabilities of trains. However, this trend has also led to a surge in human-machine interaction information, resulting in a substantial increase in the number of displays and controllers in the cab. Excessive information and a complex driving interface not only increase the cognitive and operational burden on drivers but also seriously affect their work efficiency and decision-making quality, posing a major threat to the safety of train operations. Graphics in the driving interface are an important way for drivers to obtain various types of information during vehicle operation. Design issues such as their size, color, shape, and display mode often affect the efficiency of drivers' visual search. Highlighting is a visual strategy that marks a specific number of items through specific methods to improve the efficiency of visual search.This paper takes the train driving interface as the background and studies the visual search efficiency of the driver's graphical information under the influence of different color backgrounds, graphical color and flashing frequencies of the highlighting codes. Through the experiment, the reaction time and the correct response rate of the subjects are obtained, and the optimal combination of the three kinds of highlighting codes. When the black background and the flashing frequency of the red graphic is 27Hz, the search efficiency of the subjects is the highest, which can be used as the optimal solution for the graphic information highlighting in the design of the train driving interface.
With the rapid development of modern technology, digital interfaces are increasingly widely used in aircraft, trains, and other vehicles with complex control systems. Digital interfaces, because of their ability to efficiently convey complex information, perfectly fit the trend of the evolution of complex information systems and have become an indispensable core element of this process, supporting the modernization and development of complex information systems (Tao and Qi, 2017). The scientific rationality of the driving interface is directly related to whether the driver can perform the driving task in an all-round and accurate way, which is decisive for whether he can effectively fulfill his driving duties. Drivers receive information from
the driving interface mainly through the visual channel, and highlighting is a strategy or technique to optimize the efficiency of visual search by highlighting several targets among multiple objects through specific means (e.g., highlighting, etc.) in displays involving visual search tasks. The extent to which highlighting can improve visual search efficiency depends on the means of highlighting, and current research mainly involves the following: color, size, background, flashing, and box. Among them, color and size refer to changing the color or size of the target or other elements; background mostly refers to transforming the background color to observe the target’s prominence; and flashing refers to keeping the information in a state of alternating appearance and disappearance.
In 1985, the experiments used words as materials, and the efficiency of human visual search for textual materials could be improved by using color as a prominence condition (Fisher, Coury and Tengs, 1985). Michalski et al. found through a series of visual search experiments that the color combinations between a graphic and the background affect the time of visual search for the graphic (Michalski, Grobelny and Karwowski, 2006). Greco et al. found that in the case of dark backgrounds over light-colored font combinations, green, brown, black, and blue were the best backgrounds, while red was the worst (Greco et al., 2008). It has been demonstrated that text highlighted with a yellow background on a computer screen improves recognition efficiency and that a yellow background and black text are favorable pairings (Zhao et al., 2009). It has also been shown that graphic color and shape coding have different degrees of recognition when they are used in different recognition scenarios (Ding, 2011). At present, the primary colors of train driving interface graphics are red, yellow, and green, with common background colors being black, blue, and brown. However, the highlighting effects of these graphic colors under different backgrounds have not been sufficiently explored in existing studies, so further research is necessary; and in the study of flashing as a way of highlighting, the researches have shown that the use of luminance enhancement or flashing as a highlighting technique can effectively shorten the search time for a given symbol, while not extending the time needed to search for un- highlighted symbols, thus avoiding distraction of the subject’s attention (Van Orden, Divita, and Shim, 1993). Another study found that under specific transparency conditions, continuous flashing or word flashing significantly enhanced subjects’ attention to the target (Chen and Zhai, 2023).
In summary, in the current study of graphic color, background color, and flashing, the three modes of highlighting on the graphic can affect the visual search efficiency of the subjects, but any two of the three modes of highlighting on the participant’s response time effects whether there is an interaction effect is still worth exploring, in addition, because the train driving interface is different from the other commonly used driving interfaces, the graphic color and the background of the mostly used regulations on the colors. Therefore, the color choice of the experiments can be narrowed down for the study.
Graphical Highlighting Study in Train Driving Interface 347
METHODS
Experimental Subjects The participants included 20 graduate students, including 10 boys and 10 girls, who were between the ages of 24 and 30. They have good eyesight and are free of color blindness, and are required to be well-rested before participating in the experiment.
Experimental Setup The experiment was conducted indoors in a quiet environment; the experiment was conducted through a laptop with a display screen resolution of 1920×1080. The experimental program was written by E-Prime, and the subjects could respond to a computer keyboard.
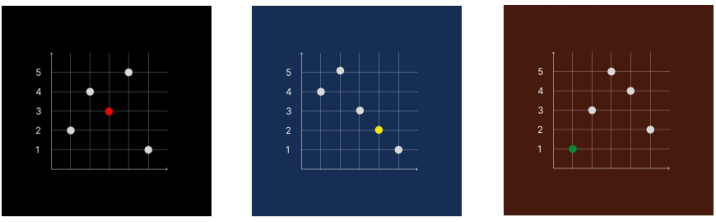
Experimental Materials E-prime 3.0 was used to build the experimental interface. As shown in the figure, the experimental interface based on the plane rectangular coordinate system. The horizontal axis is not labeled with values, and the five vertical axis values were 1, 2, 3, 4, 5. The horizontal axis of the distance between the adjacent coordinates of the 12mm, five white circles with a radius of 4mm appeared in the coordinate system (position random), which appeared in a graphical occurrence of flashing highlighting or color highlighting. Each group of experiments with the same target graphics can not appear twice in a row, and the total number of times the target graph appears in the same location should be the same. The experimental materials are shown in Figure 1.
Figure 1: Experiment materials.
Experimental Design The experiment was set with three independent variables: graphic color (red, yellow, green), graphic flashing frequency (1Hz, 9Hz, 27Hz), and interface background (black, blue, brown); 2 dependent variables were set: reaction time and correct rate. The number of experiments was 27 (3×3×3), and three sets of experiments were repeated, i.e., a total of 81 times.
348 Zhu and Zhang
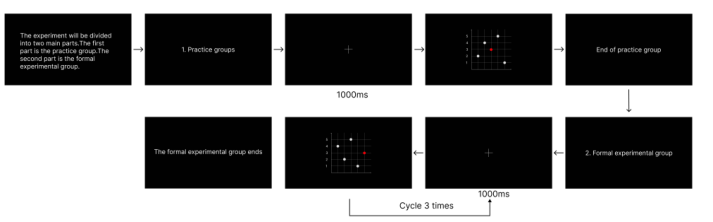
The experiment has two phases, including a practice phase and a formal experiment phase. In the practice phase, subjects were informed of the experimental procedure and practiced the experimental procedure for three cycles. This process can help subjects familiarize themselves with the experiment and eliminate experimental errors caused by the experimental sequence, and after the subjects became proficient, they entered the formal experimental procedure.
After entering the formal experimental stage, the subjects need to press the space to start the experiment before the start of the experiment, at this time, a cross appears in the middle of the screen for 1000ms to guide the subject’s vision. After 1000ms, the experimental interface appears, and the subjects find out the corresponding vertical coordinate value of the highlighted target graph in the five graphs, then press the corresponding number on the keyboard. The experimental program automatically recorded the subject’s reaction time and whether the reaction result was correct or wrong (where reaction time refers to the time from the presentation of the experimental interface to the subject’s response). The flow of all experiments is shown in Figure 2.
Figure 2: The flow of all experiments.
Data Results The following is the data collected from the experiment, including the average reaction time as well as the average correct response rate (see Table 1).
Table 1: Average response time and average correct response rate.
Table available in the original PDF paper.
Background
Graphic Color Flashing Frequency Color
Reaction Averages (ms)
Response Correctness
(Hz)
Red 1 Black 1273.54 0.950 Blue 1285.19 0.983 Brown 1292.39 0.967 9 Black 1247.23 0.967 Blue 1249.06 0.967 Brown 1244.45 0.950 27 Black 1178.26 0.983 Continued
Graphical Highlighting Study in Train Driving Interface 349
Table 1: Continued
Table available in the original PDF paper.
Background
Graphic Color Flashing Frequency Color
Reaction Averages (ms)
Response Correctness
(Hz)
Blue 1193.71 0.95 Brown 1186.58 0.95 Yellow 1 Black 1283.86 0.933 Blue 1301.15 0.933 Brown 1310.42 0.950 9 Black 1261.90 0.933 Blue 1271.28 0.950 Brown 1272.09 0.917 27 Black 1204.89 0.967 Blue 1212.03 0.917 Brown 1206.60 0.933 Green 1 Black 1281.24 0.917 Blue 1307.66 0.933 Brown 1320.25 0.917 9 Black 1267.22 0.933 Blue 1276.09 0.950 Brown 1268.56 0.917 27 Black 1222.07 0.917 Blue 1227.31 0.900 Brown 1225.84 0.933
ANALYSIS AND DISCUSSION OF RESULTS Main Effects Analysis of Reaction Time
The results, as shown in Table 2, showed a significant change in reaction time when the color of the graph changed, F = 19.44, p<0.001, ηp2 = 0.153 indicating that color had a significant effect on reaction time and explained 15.3% of the variance. As can be seen in Table 2, the shortest reaction time was observed for red graphics (mean value ≈1238.93 ms), followed by yellow (mean value ≈1258.29 ms), and green yielded the slowest responses (mean value ≈1266.25 ms).
Meanwhile, when the flashing highlighting condition was changed, it gave a significant effect on the reaction time, F = 174.79, p<0.001, ηp2 = 0.618 indicating that the flashing frequency had a great influence on the reaction time and explained 61.8% of the variance. The response time was shortest at high frequency (27Hz) (mean value ≈1206.41ms), followed by mid- frequency (9Hz) (mean value ≈1261.99ms), and longest at low frequency (1Hz) (mean value ≈1295.08ms). From this, it can be concluded that when the flashing frequency is higher, the subjects’ reaction time is shorter.
Finally, the effect of background color on subjects’ reaction time was analyzed: F = 2.13, p = 0.121, ηp2 = 0.036 F = 4.05, p = 0.019, ηp2 = 0.036, which indicated that the background color did not have a significant effect on the reaction time, with the black background having the shortest reaction time (mean value ≈1249.90ms), followed by the blue
350 Zhu and Zhang
color (mean value ≈1258.26ms), the brown color was the longest (mean value ≈1258.62ms).
Interaction Effect Analysis of Reaction Time The results showed that there was no significant interaction between graphic color and blink frequency, graphic color and background color, and blink frequency and background color on subjects’ reaction time, with data of F = 0.778, p = 0.540; F = 1.298, p = 0.272; and F = 0.047, p = 0.996, respectively; which suggests that the two variables are independent of each other in terms of their effects on the reaction time of the two variables.
Third-Order Interaction of Reaction Time The data showed that F = 0.155 p = 0.996, which indicated that the joint effect of the three variables had no significant effect on reaction time.
Table 2: Results of between-subjects effects test analysis.
Table available in the original PDF paper.
df F P Partial η2 Flashing frequency 2 174.794 <0.01 0.618 Graphic color 2 19.438 <0.01 0.153 Background color 2 2.129 0.121 0.019 Flashing frequency
* Graphic color 4 0.778 0.540 0.014
4 1.298 0.272 0.023
Flashing frequency* Background color
4 0.047 0.996 0.001
Graphic color * Background color
8 0.155 0.996 0.006
Flashing frequency
* Graphic color * Background color
Binary Logistic Regression Analysis of Response Correctness Binary logistic regression analysis was used to analyze the effect of graphic color, flashing frequency, and background color on the correct response rate, as shown in Table 3.
Graphic color significance was green as the reference group, and its effect on the correct response rate was significant (P = 0.024). When the graph color was red in comparison to the reference group, the data was: B = 0.759, P = 0.007, Exp(B) = 2.137, which significantly increased the rate of correct responses. Whereas the yellow color had a non-significant effect on the correct response rate relative to the reference group with regression coefficient B = 0.201 significance P = 0.403, Exp(B) = 1.223.
When the flashing frequency was 1 Hz as the reference group, it had no significant effect on the correct response rate (P = 0.956). 27 Hz relative
Graphical Highlighting Study in Train Driving Interface 351
to the reference group was: B = 0.067, P = 0.796, Exp(B) = 1.069, which indicated that 27 Hz relative to the reference group had a non-significant effect on the correct response rate. The data at a flashing frequency of 9 Hz relative to the reference group was: B = 0.067, P = 0.796, Exp(B) = 1.069. This indicates that 9 Hz has a non-significant effect on the rate of correct responses relative to the reference level. In summary, flashing frequency as an influencing factor did not have a significant effect on subjects’ reaction times.
The P-value of 0.864 for the background color analysis with brown as the reference group indicates that there is no significant effect on response correctness when the background color is brown. Black color had a B value of 0.134, P = 0.606, Exp(B)=1.143, relative to brown color. This indicates that the black color has no significant effect on the correct response rate relative to the reference level. Blue color has a B = 0.099, P = 0.700, Exp(B)=1.104, relative to the reference group, which indicates that blue color also has a non-significant effect on the rate of correct responses relative to the reference level.
Table 3: Binary logistic regression analysis of response correctness.
Table available in the original PDF paper.
B sd Wald df P Exp(B) Graphic color 7.420 2 0.024 Graphic Color (1) 0.759 0.280 7.359 1 0.007 2.137 Graphic color (2) 0.201 0.240 0.700 1 0.403 1.223 Flashing frequency 0.090 2 0.956 Flashing frequency (1) 0.067 0.259 0.067 1 0.796 1.069 Flashing frequency (2) 0.067 0.259 0.067 1 0.796 1.069 Background color 0.292 2 0.864 Background color (1) 0.134 0.259 0.267 1 0.606 1.143 Background color (2) 0.099 0.257 0.148 1 0.700 1.104
CONCLUSION
This study experimentally investigated the effects of graphical information highlighting on drivers’ visual search efficiency in train driving interfaces, focusing on the effects of three highlighting coding methods, namely, graphical color, flashing frequency, and background color, on reaction time and correct response rate. The experimental results show that graphic color and flashing frequency have a significant effect on reaction time, while the effect of background color is not significant. Specifically, the red graphic with 27Hz flashing frequency and black background showed the shortest reaction time and the most efficient search for the subjects. This result is consistent with the study of Fisher, who found that color highlighting significantly improved visual search efficiency (Fisher, Coury and Tengs, 1985). The results of this experiment on flashing frequency as a method of highlighting are also consistent with Van Orden et al. in that a high flashing frequency is effective in shortening the lookup time for a given symbol (Van Orden, Divita, and Shim, 1993). However, the results of this experiment on background color as a highlighting condition are inconsistent with the research of Greco
352 Zhu and Zhang
et al., which may be due to the fact that the types of background colors involved in this experiment are based on the selection of common colors in the driving interface and do not use a large number of colors or the design of the experimental task is relatively simple (Greco, 2008).
In terms of the correct response rate, the accuracy of all subjects was above 90%, and only one variable and the color of the graphic had a significant effect on the response time, and the red graphic significantly improved the correct response rate compared to the green and yellow graphic, which may be due to the insufficient sample size or the experimental design was too simple, which was not a big challenge for the subjects, and these two parts can be optimized in the subsequent research. parts can be optimized.
In summary, this study provides an important theoretical basis and practical guidance for the design of train driving interface. By optimizing the combination of graphic color, flashing frequency and background color, the driver’s visual search efficiency of graphic information can be significantly improved, thus enhancing driving safety and operation efficiency. Future research can further explore other highlight coding methods, such as size and shape, and their application effects in different driving environments to provide a more comprehensive reference for the design of train driving interfaces.
ACKNOWLEDGMENT
I would like to thank my supervisor, Mr. Zhang Jianrun, for his support and teaching during my graduate studies, and my classmate Huang Xin for his care and support in my daily life and study.
REFERENCES
Chen, C.-H. and Zhai, W. (2023). The effects of dynamic prompt and background transparency of hover feedback design on the user interface of shopping websites. Asia Pacific Journal of Marketing and Logistics, 35(4), 809–827. Ding, M. (2011). Design and evaluation of target icons of the cockpit display
interface. Packaging Engineering. Fisher, D. L., Coury, B. G. and Tengs, T. O. (1985) “Optimizing the set of highlighted options on video display terminal menus”, in Proceedings of the Human Factors Society 29th Annual Meeting, pp. 650–651. Greco, M., Stucchi, N., Zavagno, D. and Marino, B. (2008) “On the portability
of computer-generated presentations: the effect of text-background color combinations on text legibility”, Human Factors, 50(5), pp. 821–833. Michalski, R., Grobelny, J. and Karwowski, W. (2006) “The effects of graphical interface design characteristics on human–computer interaction task efficiency”, International Journal of Industrial Ergonomics, 36(11), pp. 959–977. Tao, F. & Qi, Q. (2017). New IT driven service-oriented smart manufacturing:
framework and characteristics. IEEE Transactions on Systems, Man, and Cybernetics: Systems, 49(1), 81–91. Van Orden, K. F., Divita, J. and Shim, M. J. (1993). Redundant use of luminance and flashing with shape and color as highlighting codes in symbolic displays. Human Factors, 35(2), 195–204. Zhao, Z., Rau, P. L. P., Zhang, T. and Salvendy, G. (2009) “Visual search-based
design and evaluation of screen magnifiers for older and visually impaired users”, International Journal of Human-Computer Studies, 67(8), pp. 663–675.
Read this individual research paper free through the original publisher, or explore the full digital proceedings book.
ISBN 978-1-964867-71-7
Explore this ISBN in the AHFE Bookstore ↗Listed in the July 2026 bookstore catalogue; search by ISBN to confirm current availability · Digital book purchase optional