Shiyu Chen, Yixiang Huang, Hengsheng Huang (2025). User Preference in Chinese E-commerce Interface Design: A Semantic Differential Approach. In: Usability and User Experience. AHFE Open Access, vol. 194, pp. 254–263. https://doi.org/10.54941/ahfe1006688
As consumer demands for user experience in e-commerce platforms continue to rise, interface layout has emerged as a critical factor influencing purchase decisions. This study investigates design preferences across four major Chinese platforms—JD.com (utilitarian layout), Taobao (social-commerce integration), Douyin Mall (short-video-driven interface), and Pinduoduo (gamified presentation). Employing a mixed-methods approach, we conducted semi-structured interviews (n=32) and a semantic differential survey (n=227 valid responses) to establish a perceptual evaluation system. Six bipolar adjective pairs (e.g., "orderly vs. cluttered," "harmonious vs. conflicting") were used to construct perceptual-semantic spaces. Principal component analysis (PCA) via SPSS 26.0 identified three core dimensions: Interface Layout (α=.87), Information Presentation (α=.83), and User Preference (α=.79). Results demonstrated significant correlations between spatial zoning patterns and user satisfaction (r=.68, p<.01), with JD.com ranking highest due to its structured layout, while Douyin Mall scored lower owing to its video-centric immersion. These findings offer empirical guidelines for cross-cultural interface optimization and propose a triaxial design framework balancing layout, information, and emotional engagement.
In contemporary society, users increasingly demand higher-quality experiences on e-commerce platforms, where the visual appeal of the primary interface directly impacts user satisfaction and loyalty. According to the 54th Statistical Report on China’s Internet Development (2024), China’s internet user base reached nearly 1.1 billion (1.09967 billion) by June 2024. Within China’s new media landscape, short-video platforms such as Douyin, Kuaishou, and TikTok have driven the rapid integration of new media and e-commerce through fragmented information dissemination and high interactivity. These platforms are characterized by dynamic content delivery, intuitive interfaces, and rapid information propagation. As market demands and user preferences evolve (Jin et al., 2023), designing homepage layouts that align with new media communication paradigms has become critical. In the current digital era, e-commerce platforms have developed
User Preference in Chinese E-Commerce Interface Design: A Semantic Differential Approach255
stable multipolar structures over time, with homepage design emerging as a pivotal factor influencing user experience (Chen et al., 2022).
In China, research has focused on analyzing strategies and models of new media. On one hand, enterprises aim to attract consumers through creative content, brand image cultivation, and user interaction on short-video platforms. On the other hand, studies emphasize the impact of interface design on viewers. Research indicates that hierarchical interface design can enhance brand awareness and reputation, thereby improving consumer affinity. Additional studies have explored educational, communicative, and content-driven short videos as distinct categories.
Internationally, scholars have also achieved significant advancements in new media interface design. Foreign studies prioritize investigating user behavior and psychology on short-video platforms to better understand the role of interface design. Beyond traditional quantitative metrics, international research increasingly explores qualitative measurements, such as user emotions and engagement levels (Chen et al., 2022). Optimization strategies in video design emphasize innovative content creation, perspectives (first- and third-person narratives), and collaborations with social media ecosystems. Furthermore, some studies address legal and ethical challenges in short- video marketing to ensure corporate compliance and social responsibility in campaigns (Gan et al., 2023).
Through the aforementioned research, the retrieved literature was analyzed using CiteSpace software (Geng et al., 2024), with a focus on keywords including “e-commerce platforms,” “semantic differential method,” and “interface design.” Following systematic searches, 211 qualified papers were classified, synthesized, and summarized. The analytical results revealed that under the themes of “new media”and “interface design,” high-frequency concepts such as “media convergence,” “interaction design,” “user experience,” and “mobile applications” predominated. These studies predominantly adopted user-centered perspectives, thereby substantiating the critical need for research on new media marketing platforms (Zhang et al., 2024).
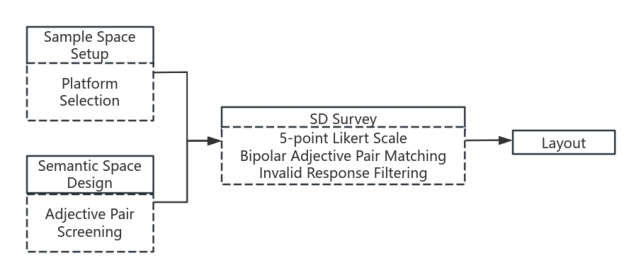
EXPERIMENTAL PROCESS FOR USER PREFERENCES IN CHINESE E-COMMERCE INTERFACE DESIGN The prerequisite for optimizing new media interface design lies in constructing a perceptual sample space. By establishing perceptual- semantic spaces for e-commerce platforms—comprising both sample spaces (platform selections) and semantic spaces (affective lexicons)—we conducted perceptual preference surveys through semantic mapping. The detailed experimental workflow is illustrated in Fig. 1.
New media interfaces play a pivotal role in user experience and commercial marketing. To systematically investigate the characteristics and effectiveness of new media interfaces, representative samples must be selected from the constructed sample space following the experimental workflow outlined earlier (Fu et al., 2023). Through literature review and consultations with 32 industry practitioners and experts, we identified the following categories of new media marketing platforms.
Figure 1: Experimental workflow diagram.Table 1: Categories of new media marketing platforms.
Table available in the original PDF paper.
Representative Cases Core Features Facilitate product marketing JD.com Suning.com
E-commerce
Vipshop Pinduoduo
Platforms (Product-Centric)
Enable merchants to attract
through promotional campaigns (e.g., flash sales, coupons) and strategic advertising placements (banners, search rankings). Life Service Platforms Meituan Dianping
Ele.me
Bilibili Toutiao Zhihu Support brand promotion through
consumers via service packages (e.g., discounted combos) and targeted ad delivery based on geolocation/user preferences. Content-Creation & Sharing Platforms
UGC/PGC content dissemination (videos, articles), Q&A engagement, and algorithm-driven ad exposure optimization. Travel Service Platforms tours) with dynamic pricing strategies and immersive multimedia showcases (360
views, VR experiences). Financial Service Platforms
Alibaba Cloud
Provide B2B solutions (cloud
insurance) with behavioral targeting, leveraging user transaction data for personalized recommendations. Enterprise Service
Tencent Cloud
Platforms
computing, big data analytics) coupled with case study showcases and webinar-based technical marketing.
Continued
User Preference in Chinese E-Commerce Interface Design: A Semantic Differential Approach257
Table 1: Continued
Table available in the original PDF paper.
Representative Cases Core Features NetEase Cloud Drive course enrollment through
Online Education Platforms
Classroom, Tencent Classroom TAL Education
free trial sessions, user review systems, and AI-powered learning path recommendations.
Through comparative analysis of the four selected platforms, the study revealed that all platforms prioritize and meticulously design their app homepage interfaces. The visual layout of the homepage directly shapes users’ initial impressions during the first interaction, where effective interface design guides attention, stimulates exploratory intent, and ultimately enhances purchasing impulses, thereby significantly improving marketing outcomes. Based on these findings, this research selected JD.com (utilitarian layout), Taobao (social-commerce integration), Douyin Mall (short-video-driven interface), and Pinduoduo (gamified presentation) as representative cases of new media marketing platforms.
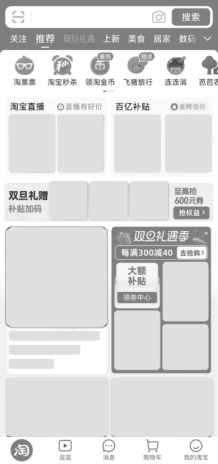
To eliminate confounding factors, this study adopted the design methodology of (Zou, 2023) by applying grayscale processing to all homepages and masking recommended products, retaining only original app icons and textual elements. Product images and prices were replaced with uniform color blocks. Additionally, screenshots were captured on new devices after logging out of user accounts to mitigate bias from personal preference (see Fig. 2).
Figure 2: Sample space processing.
Development of Perceptual-Semantic Space and Lexicon Refinement “Perceptual imagery” refers to human sensory responses to objects, and perceptual lexicon serves as linguistic representations of such responses (Hu et al., 2024). In new media marketing platforms, user perceptions of interface design are often implicit. To establish correlations between design elements and perceptual preferences, a curated set of affective adjective pairs must first be selected for semantic space construction. Through multi-source data collection—including interviews with marketers and users (n = 32), literature reviews, and online resources—120 affective terms were initially gathered and categorized into five domains: Visual Perception, Information Presentation, Interaction Experience, Emotional Atmosphere, and Brand Image (He et al., 2025).
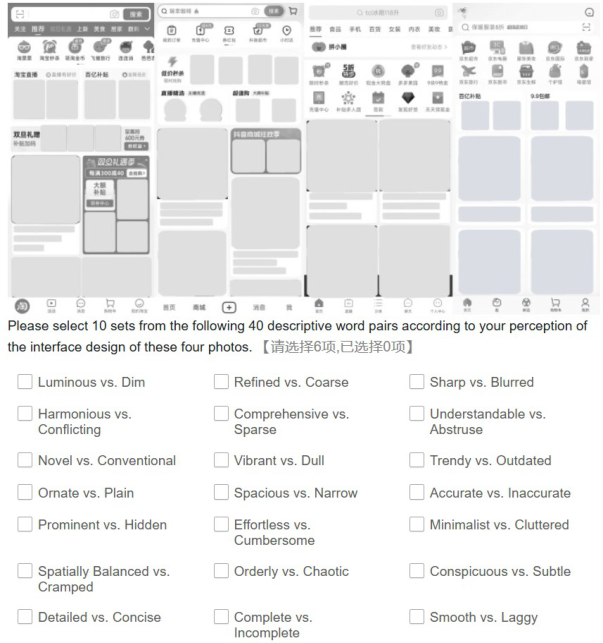
Given semantic redundancies (e.g., synonymous pairs) and irrelevance to interface design, direct use of all 120 terms would impose cognitive overload on participants. Therefore, iterative screening was conducted: (1) Primary Screening: Merging synonyms and eliminating ambiguous terms, reducing the lexicon to 40 validated pairs; (2) Secondary Screening: Matching the 40 pairs with interface samples via questionnaire surveys, where participants selected the most representative terms (see Fig. 3).
Figure 3: Questionnaire format for the secondary screening.
User Preference in Chinese E-Commerce Interface Design: A Semantic Differential Approach259
The questionnaire paired 40 affective adjective pairs with interface sample images. Participants were instructed to select 6 pairs that best matched each interface. Following preliminary screening and semantic merging of overlapping terms, Table 2 presents the final 6 validated bipolar adjective pairs, as follows:
Table 2: Perceptual semantic vocabulary pairs.
Table available in the original PDF paper.
Visual Perception Information Presentation Sensory Adjective Pairs Orderly vs. Cluttered Prominent vs. Hidden Harmonious vs.
Complete vs. Incomplete
Conflicting
- Novel vs. Conventional Affective Adjective Pairs Likable vs. Dislikable
The survey adopted a scale-based format, integrating the six validated affective adjective pairs with interface design samples. Participants evaluated four distinct platform interfaces using a 5-point Likert scale (−2 to +2). Demographic questions regarding age, education level, and monthly expenditure were included to contextualize subsequent analyses (Max Liang & Lian, 2021).
From the initial 231 responses, 4 were excluded due to incomplete or inconsistent answers, yielding 227 valid responses (valid rate: 98.27%). Demographic analysis revealed a balanced gender distribution (male: 41.85%, female: 58.15%), with the majority aged 18–25 years (87.2%), indicating familiarity with new media platforms. Participants were predominantly undergraduate and college students (91.6%), demonstrating adequate literacy for survey comprehension. Monthly expenditures averaged RMB 2,000–4,000 (≈USD 280–560), reflecting sufficient disposable income for online consumption.
FACTOR ANALYSIS OF PERCEPTUAL EVALUATIONS The reliability analysis via SPSS yielded a Cronbach’s α of 0.965, exceeding the threshold of 0.8, which indicates high internal consistency of the scale. For validity, the KMO value was 0.905 (>0.8), confirming suitability for factor analysis, and Bartlett’s test of sphericity showed statistical significance (p < 0.001). All common factor loadings surpassed 0.7, demonstrating strong explanatory power of the extracted factors.
In factor analysis, the total variance explained reached 81.6% through the first three factors. Although no single factor achieved 80% cumulative variance, the first factor had the highest eigenvalue (3.82), explaining 45.1% of the variance, followed by the second (23.3%) and third (13.2%) factors. Thus, the first three factors were selected as principal components, representing the core dimensions of the six original variables.
Factor loadings revealed the following patterns:
Factor 1 (Information Clarity): Dominated by Orderly vs. Cluttered (0.883) and Harmonious vs. Conflicting (0.638), emphasizing the importance of explicit information presentation.
Factor 2 (Innovation Preference): Driven by Prominent vs. Hidden (0.686) and Complete vs. Incomplete (0.873), reflecting users’ inclination toward innovative designs.
Factor 3 (Visual Harmony): Characterized by Novel vs. Conventional (0.727) and Harmonious vs. Conflicting (0.874), indicating users’ prioritization of visual coherence.
The findings categorize key factors influencing interface design of new media marketing platforms into three dimensions:
Interface Layout Factor (F1): Comprising Orderly vs. Cluttered and Harmonious vs. Conflicting, reflecting users’ perception of visual order and harmony.
Information Presentation Factor (F2): Encompassing Prominent vs. Hidden and Complete vs. Incomplete, emphasizing clarity and completeness of information.
User Preference Factor (F3): Defined by Novel vs. Conventional and Likable vs. Dislikable, capturing users’ inclination toward innovative designs and emotional preferences.
Based on the component score coefficient matrix, the factor score equations are: F1 = 0.765X1 + 0.566X2 −0.445X3 + 0.315X4 −0.323X5 −0.136X6 F2 = −0.361X1 + 0.200X2 + 0.621X3 −0.350X4 −0.233X5 + 0.830X6 F3 = −0.118X1 −0.496X2 + 0.222X3 + 0.408 X4 + 1.024X5 −0.375X6
where X1 to X6 represent the ratings of the six bipolar adjective pairs.
The composite score equation, weighted by total variance explained, is: Fz = 0.2802F1 + 0.55225F2 + 0.8151F3
This equation synthesizes the contributions of the three factors to quantify overall user preference for interface design.
Table 3: Component score coefficient matrix.
Table available in the original PDF paper.
1 2 3
Orderly vs. Cluttered .765 −.361 −.118 Harmonious vs. Conflicting .566 .200 −.496 Prominent vs. Hidden −.445 .621 .222 Complete vs. Incomplete .315 −.350 .408 Novel vs. Conventional −.323 −.233 1.024 Likable vs. Dislikable −.136 .830 −1.375 As shown in Table 3, higher composite scores (Fz) indicate stronger user preference for interfaces perceived as “complete,” “prominent,” “harmonious,” “orderly,” and “novel,” whereas lower scores correlate with negative perceptions of “incomplete,” “hidden,” “conflicting,” “cluttered,”
User Preference in Chinese E-Commerce Interface Design: A Semantic Differential Approach261
and “conventional”designs. Using the equations (F1, F2, F3, Fz) and interface samples from JD.com, Taobao, Douyin Mall, and Pinduoduo, the composite perceptual scores were calculated and ranked in descending order:
Table 4: Sample human systems integration test parameters (Folds et al., 2008).
From the perspective of factor scores, the composite score (Fz) represents users’ holistic perception of interface design. A higher absolute Fz value indicates stronger polarization in evaluations (extreme preference or aversion). The data show JD.com with the highest Fz (0.172), followed by Taobao (−0.3) and Pinduoduo (−0.46), while Douyin Mall ranked lowest (−0.838).
The high User Preference scores of JD.com and Taobao (F3>1.0) can be attributed to their balanced layout and information architecture, which reduce cognitive load and stimulate exploration and purchasing intent. In contrast, Douyin Mall’s homepage prioritizes livestream content, impairing product discoverability (F2↓) and causing visual fatigue (F1↓), thereby increasing user attrition risks.
JD.com & Pinduoduo: High Interface Layout scores (F1>0.4) reflect user preference for their modular designs (categorical navigation bars, grid-based product displays).
JD.com & Taobao: Strong Information Presentation scores (F2>−0.03) stem from intuitive product detail pages and efficient search filters.
Douyin Mall: As the only platform featuring a livestream-driven homepage, its immersive video feed led to disorganized spatial zoning (F1 = −0.19) and obscured key information (F2 = −0.377), resulting in the lowest User Preference score (Fz = −0.838).
CONCLUSION
Based on the three key factors (F1, F2, F3) extracted through the Semantic Differential Method, this study proposes the following design principles: Guided by Factor F1 (Interface Layout), designs should prioritize orderly and harmonious spatial arrangements while avoiding cluttered and conflicting elements to enhance visual comfort and operational efficiency.
Informed by Factor F2 (Information Presentation), interfaces must ensure prominent and complete information delivery, eliminating hidden or incomplete content to optimize communication efficiency and accuracy. Anchored in Factor F3 (User Preference), platforms should align with users’ pursuit of novelty and likable elements, while avoiding conventional or dislikable design strategies to maximize satisfaction and loyalty.
Factor analysis indicates that interface layouts require simplified structures and well-defined functional zoning to enhance logical coherence. Designers
should unify visual elements (e.g., color schemes, typography, icons) to avoid clutter. A minimalist style with rationally organized functional areas is recommended to improve readability and accessibility. For instance, optimize menu hierarchies with clear icons and labels.
Information presentation should prioritize rapid user access to critical content. Highlight essential information through high-contrast colors and dynamic visual cues while ensuring completeness and accuracy. Examples include using bold headings and strategic annotations, but designers must balance prominence with layout cleanliness to prevent visual chaos.
To align with user preferences, conduct regular user testing (e.g., A/B testing) to gather feedback and iterate designs. Implement personalized themes and customization options (e.g., dark mode, layout templates) to accommodate diverse aesthetic needs. For example, allow users to switch between “Minimalist Mode” and “Immersive Mode” based on usage contexts.
ACKNOWLEDGMENT
I am deeply grateful to the AHFE conference in the US for offering me this exceptional opportunity. It has been a remarkable platform for academic advancement and global interaction. Presenting my work here has not only elevated my academic profile but also broadened my intellectual horizons.
Heartfelt thanks go to my supervisor, YuLin Zhao. Your astute guidance and unwavering support have been pivotal in my research journey. Your expertise has been invaluable in helping me navigate through the complexities of my study. I am truly indebted to you for your contributions.
REFERENCES
Chen, H., Wang, M., & Zhang, Z. (2022). Research on Rural Landscape Preference Based on TikTok Short Video Content and User Comments. International Journal of Environmental Research and Public Health, 19(16), 10115. https://doi.org/ 10.3390/ijerph191610115 Chen, H., Wang, M., & Zhang, Z. (2022). Research on Rural Landscape Preference
Based onTikTok Short Video Content and User Comments. International Journal of Environmental Research and Public Health, 19(16), 10115. https://doi.org/ 10.3390/ijerph191610115 Fu, H., Wang, P., Zhou, J., Zhang, S., & Li, Y. (2023). Investigating Influence of Visual Elements of Arcade Buildings and Streetscapes on Place Identity Using Eye-Tracking and Semantic Differential Methods. Buildings, 13(7), 1580. https:// doi.org/10.3390/buildings13071580 Gan, J., Shi, S., Filieri, R., & Leung, W. K. S. (2023). Short video marketing and
travel intentions: The interplay between visual perspective, visual content, and narration appeal. Tourism Management, 99, 104795. https://doi.org/10.1016/ j.tourman.2023.104795 Geng, Y., Zhang, X., Gao, J., Yan, Y., & Chen, L. (2024). Bibliometric analysis of sustainable tourism using CiteSpace. Technological Forecasting and Social Change, 202, 123310. https://doi.org/10.1016/j.techfore.2024.123310
User Preference in Chinese E-Commerce Interface Design: A Semantic Differential Approach263
He, B., Wang, S., Xiong, Q., Zhao, Z., & Hou, Y. (2025). Urban Park Planning for Sustainability: Resident Insights from China’s Major Cities. Land, 14(1), 128. https://doi.org/10.3390/land14010128 Hu, T., Fu, Q., Chen, L., & Shi, M. (2024). Optimizing Building Information Modeling System Design Elements for Enhanced User Experience: A Multidimensional Approach. Traitement Du Signal, 41(2), 615–628. https:// doi.org/10.18280/ts.410206 Jin, M., Ning, Y., Liu, F., Zhao, F., Gao, Y., & Li, D. (2023). An Evaluation Model for
the Influence of KOLs in Short Video Advertising Based on Uncertainty Theory. Symmetry, 15(8), 1594. https://doi.org/10.3390/sym15081594 Max Liang, S.-F., & Lian, J.-H. (2021). Effects of Loading Lags and Displays on Television Viewing Experience. International Conference on Applied Human Factors and Ergonomics (AHFE). https://doi.org/10.54941/ahfe10058 Zhang, W., Yang, Y., & Liang, H. (2023). A Bibliometric Analysis of Enterprise Social
Media in Digital Economy: Research Hotspots and Trends. Sustainability, 15(16). https://doi.org/10.3390/su151612545 Zou, B. (2023). Research on the Reconstruction and Application of the Horseface Skirt Based on Kansei Engineering. Retrieved from https://kns.cnki.net/ KCMS/detail/detail.aspx?dbname=CMFD202401&filename=102362776.nh (In chinese).
LISTED IN THE AHFE DIGITAL BOOKSTORE CATALOGUE
Explore the complete digital volume
Usability and User Experience
Read this individual research paper free through the original publisher, or explore the full digital proceedings book.
ISBN 978-1-964867-70-0
Explore this ISBN in the AHFE Bookstore ↗Listed in the July 2026 bookstore catalogue; search by ISBN to confirm current availability · Digital book purchase optional