Jan-niclas Strüwer, Roman Trentinaglia, Benedict Wohlers, Eric Bodden, Roman Dumitrescu (2025). Assessing and Communicating Software Security: Enhancing Software Product Health with Architectural Threat Analysis. In: Human Factors in Cybersecurity. AHFE Open Access, vol. 168, pp. 82–92. https://doi.org/10.54941/ahfe1006145
Assessing and communicating software security has become a crucial concern in the era of digital transformation. As software systems grow more complex and interconnected, it becomes increasingly challenging to effectively evaluate and communicate a product's security status to both technical and non-technical stakeholders. The Software Product Health Assistant (SPHA) is designed to automatically collect and aggregate data from existing expert tools and derive, among other scores, a transparent Security Score. SPHA is designed to present and explain this Security Score to decision-makers to support their responsibilities. In this paper, we demonstrate how to integrate data from SMARAGD (System Modeler for Architectural Risk Assessment and Guidance on Defenses), a safety-informed threat modeling tool, into SPHA to enhance the existing definition of its Security Score. To achieve this, we combine information about known vulnerabilities with architectural and threat data to calculate a realistic risk score for the product in question.
Building secure, resilient, high-quality software is essential to staying competitive in today’s digital product landscape. However, due to software systems’ rising complexity and interconnectivity, it is becoming increasingly difficult to assess and communicate how well a given product fulfills these requirements (Pfleeger and Cunningham, 2010). This issue persists even in cases in which much analyzable data about the product and its development process is already available. For most companies, the central challenge is not the lack of information but extracting what is relevant and how to use it to secure and improve their products. To address this challenge, we developed the Software Product Health Assistant (SPHA), a fully automated approach to measuring a product’s software health score based on existing information from the product’s code and development process. SPHA’s
Assessing and Communicating Software Security: Enhancing Software Product Health 83
unique combination of diverse data sources provides a comprehensive view of a product’s current state that can easily be communicated to various stakeholders, including those who may not have a technical background. By aggregating data into clear and understandable scores, SPHA empowers decision-makers to make informed choices regarding product development and risk management. Additionally, we support product teams in implementing these decisions by allowing them to delve into SPHA’s metric calculations, understand the specifics behind each score, and connect them to the original tool results to address potential issues effectively. However, until now, SPHA does not consider any security metrics on an architectural level. As many security-critical issues arise from a product’s architecture (McGraw, 2004), this poses a large blind spot. The main challenge is to automatically extract and assess the information from architecture models produced during the requirements elicitation and design phases of the software development process. Currently, established tools do not provide an easily exportable assessment of a system’s security based on its architectural design. To overcome this challenge, we combine SPHA with the results of the System Modeler for Architectural Risk Assessment and Guidance on Defenses (SMARAGD) tool, a novel safety-informed threat modeling tool that analyses a given architecture to identify safety-critical threats, recommends suitable security controls, evaluates whether secure design principles like defense in depth are applied, and more.
In this paper, we show how to integrate the output of SMARAGD into SPHA’s metric hierarchy to evaluate a product’s cyber resilience, resulting in a more complete picture of a product’s overall security. In the following section, we give a detailed introduction to SPHA and explain how different information can be combined to derive a concise Security Score. Afterwards, we introduce SMARAGD and the architecture and threat related metrics that it generates. Lastly, we present our core contribution, the combination of vulnerability information and architectural information about security controls to derive a realistic Architecture Security Score.
SOFTWARE PRODUCT HEALTH ASSISTANT The Software Product Health Assistant (SPHA) (Strüwer et al., 2024) addresses the challenge of automatically quantifying and communicating a product’s software health score to stakeholders. This health score is based on six key aspects to assess a product: Security, Internal Quality, External Quality, Sustainability, Compliance, and Traceability. In this paper, we focus on security-related metrics.
Assessing and communicating a product’s current state regarding security, particularly its risk level, is crucial for making informed decisions about the product’s development and prioritizing tasks. These decisions are often made by non-technical stakeholders, such as Product Owners (POs) or Product Managers (PMs). Therefore, it is essential to present the necessary information in a way that is understandable for their roles (Pfleeger and Cunningham, 2010). However, most security tools are designed for use by security experts. For instance, Static Application Security Testing (SAST)
tools are commonly used to identify security issues in a product. The output and visualization from these tools typically target developers and are intended to guide them in fixing detected security vulnerabilities.
In contrast, SPHA aims to use these expert tools alongside other data sources to evaluate a product’s overall security state and communicate it to decision makers. Therefore, it uses a weighted hierarchy to aggregate information into a single score with an explanation attached to explain the semantics of its aggregation. The hierarchy is customizable for each organization or product by modifying the hierarchical structure or the weights assigned to the connections between edges (Wohlers et al., 2022). SPHA’s goal is to provide an easy-to-understand and communicate, high- level overview of the product’s state, not a complete or precise definition of security.
In the following, we introduce a simplified example of data sources and tools and provide an exemplary hierarchy of metrics to measure a product’s security, demonstrating how to combine information from different sources. Our example focuses on two key areas of software security: code integrity and vulnerability management. Code integrity refers to the assurance that the code has not been tampered with or altered by an unauthorized individual. Evaluating code integrity can be challenging, particularly for larger projects that receive hundreds of commits daily from numerous contributors. Vulnerability management is the process of continuously identifying, assessing, and fixing vulnerabilities. A vulnerability is a security-relevant defect in the software that an attacker can potentially exploit to compromise the system. A common method to rate their severity is the Common Vulnerability Scoring System (CVSS) (NIST, 2024), which assigns a score between 0.0 and 10.0 to each vulnerability. For developers, the main challenge in vulnerability management is determining how to prioritize findings and deciding which vulnerabilities to fix and which ones are false positives. On the other hand, decision-makers must understand the broader implications of these vulnerabilities for their product. They do not require the detailed information provided by vulnerability scanners that explain how to fix an issue; instead, they need a higher-level explanation of the severity and impact of the vulnerabilities in the context of their product.
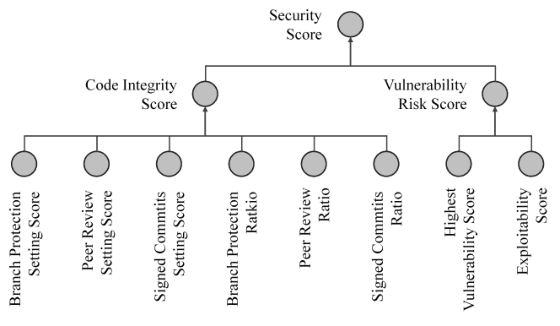
To calculate a Code Integrity Score and Vulnerability Risk Score, we rely on three data sources: version control systems (VCSs), vulnerability scanners, and exploit databases. VCSs are used to manage a product’s code and other artifacts. Vulnerability scanners provide data about known vulnerabilities in the product Vulnerability scanners can work on different artifacts, e.g., the code base, dependencies, or container images. Exploit databases contain data about known exploits for vulnerabilities. The hierarchy of metrics, depicted in Figure 1, allows the determination of product security by aggregating and combining information from the data sources mentioned above. The individual components of the hierarchy are explained in the following.
Assessing and Communicating Software Security: Enhancing Software Product Health 85
Figure 1: Exemplary Hierarchy of metrics to evaluate a product’s security.
Based on information from a version control system, we define a hierarchy of metrics to quantify code integrity as the Code Integrity Score. The underlying Integrity Setting Scores check for a fact and return 1 if the fact is true or else 0. The Integrity Ratios represent a percentage share of a specific variable in relation to the total number of variables. In the following, all metrics related to the Code Integrity Score are briefly introduced:
The Branch Protection Setting Score checks if the repository’s default branch is protected or if anybody can commit changes to it.
The Peer Review Setting Score checks if and how many peer reviews are required before integrating changes into the default branch.
The Signed Commits Setting Score checks if signed commits are enforced.
The Branch Protection Ratio determines the share of commits originating from pull requests of all commits on the default branch.
The Peer Review Ratio determines the share of pull requests that had the required number of reviews in all pull requests.
The Signed Commits Ratio determines the share of signed commits in all commits.
The Code Integrity Score is determined based on the Integrity Setting Scores and the Integrity Ratios according to the following formula: avg(0.3× avg
∀Integrity Setting Scores
, 0.7 × avg(∀Integrity Scores)). This Code Integrity Score definition is based on two key components: the product’s settings, which outline the planned process, and data from the development process that verify adherence to this defined process. Decision- makers need to understand whether an appropriate process is configured for their products and whether that process is being followed. However, we do not advocate for blind adherence to the process; it is crucial to understand the reasons behind any deviations from it. SPHA’s hierarchical approach allows for a detailed analysis of the underlying data, enabling developers to investigate instances where processes were not followed. This investigation can reveal potential issues in how the development process is defined. An implementation of the Code Integrity Score can be found in our open-source
repository on GitHub1. In real-world scenarios, this score can be further enhanced and integrated with other metrics, such as a Supply Chain Integrity Score, to provide insights into the integrity of the deployed product.
The information provided by vulnerability scanners and exploit databases are combined to the Vulnerability Risk Score. This score combines the Highest Vulnerability Score and the Exploitability Score and is meant to support vulnerability management and the related decision making.
The Highest Vulnerability Score determines the most severe vulnerability of the product among all its known vulnerabilities. It is determined by the vulnerability with the highest CVSS score, regardless of whether any exploits currently exist or not. This approach is taken because a high-severity vulnerability has the potential to cause significant damage if exploited, and therefore, it should be addressed promptly. The Highest Vulnerability Score is calculated according to this formula: max∀vulnerabilities (CVSS Score × 10).
The Exploitability Score analyzes information about vulnerabilities and known exploits for these vulnerabilities. It considers all known vulnerabilities that have corresponding exploits and aggregates their CVSS scores. This way, it acknowledges that through vulnerability chaining, multiple low-severity vulnerabilities can collectively impact the overall system significantly. The Exploitability Score is calculated, according to the following formula:
Equations and mathematical formulas are available in the original paper PDF.
, 100
∈[0, 100]
∀vulnerabilities ∩exploits CVSS Score × 10 The Vulnerability Risk Score indicates the risk level of a product based on known vulnerabilities and their associated exploits. To do so, it simply propagates the higher value of the two inputs Highest Vulnerability Score and Exploitability Score to prevent the maximum existing risk from being blurred. Decision-makers can use the Vulnerability Risk Score as well as the underlying scores to prioritize product development. In our example, we have chosen two easy to grasp approaches to CVSS aggregation and scoring. Those can be improved or replaced by choosing more complex alternatives from literature (Cheng et al., 2012) (Tripathi and Singh, 2011).
Finally, the hierarchy of metrics culminates in the Security Score, which aggregates the Code Integrity Score and Vulnerability Risk Score. This score can easily communicate the product’s current security state. It is determined as the average of the two inputs but could be adjusted using weights.
The hierarchical structure of the information provided by the metrics allows users to explore the Security Score and its underlying metrics in detail, helping them understand the reasons behind the score up to initial data sources. Users can utilize these results as a guide to address the reported issues. However, the current definitions do not account for the system architecture of the analyzed product. This architectural information can be incorporated by integrating SMARAGD, as explained in the following sections.
Assessing and Communicating Software Security: Enhancing Software Product Health 87
SYSTEM MODELER FOR ARCHITECTURAL RISK ASSESSMENT AND GUIDANCE ON DEFENSES S-CUBE is a publicly funded research project that was conducted at Fraunhofer IEM. Its goal is to develop software tooling that supports the creation of safety and security documentation for safety-critical systems (SCS), e.g., automotive systems or industrial control systems, by automatically deriving assurance cases from the results of a safety-informed threat modeling process.
The result of the project is the System Modeler for Architectural Risk Assessment and Guidance on Defenses (SMARAGD), a model-based data flow diagram (DFD) editor for threat modeling (Shostack, 2014) of SCS, following the STRIDE methodology (Kohnfelder and Garg, 1999). SMARAGD provides suggestions for suitable security controls and their possible deployment locations in the modeled architecture. Security controls (e.g., Message Signature Checks, Input Validation, Firewalls, …) are measures implemented to protect information systems from threats and vulnerabilities. They are derived from calculated attack and failure propagation information. Security controls help to ensure the confidentiality, integrity, and availability of information.
In addition, SMARAGD can assess the modeled system design using an extensible catalog of architectural security metrics. A particular concern of these metrics is to determine whether the Defense in Depth secure design principle is considered in the system design. Defense in Depth aims to employ multiple layers of security controls and measures to protect the system, ensuring that if one layer fails, others remain in place to mitigate risks.
After evaluating all metrics, SMARAGD generates model-based assurance cases in the Goal Structuring Notation (GSN) (Kelly and Weaver, 2004), by combining each metric that fulfills the corresponding requirements with a corresponding GSN assurance case fragment.
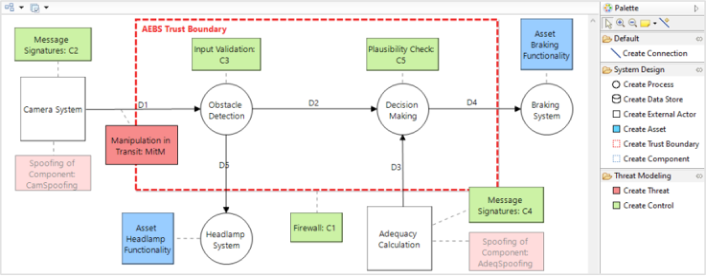
Figure 2 depicts the diagram view of SMARAGD showing a threat model for an exemplary system from the automotive domain in the DFD notation. DFD elements, e.g., Processes and External Actors of the system, are represented by white circles and rectangles. SMARAGD further allows to annotate Assets (depicted in blue), Threats (red), and existing Security Controls (green) from a predefined, extensible control catalog to the DFD nodes. The DFD nodes are connected via corresponding data flows, showing how these elements exchange messages. Not visible in the figure but included in the underlying model are the messages associated with these data flows including their dependencies, as well as corresponding Failure Modes (e.g., value failures or the omission of a message) for those messages, and Hazards (which are automatically derived from the annotated assets). As a background task during design, SMARAGD automatically handles the generation and linking of failure modes based on modeled message dependencies. Additionally, depending on their STRIDE category, annotated threats are automatically matched to corresponding failure modes they may cause (Fockel et al., 2022). Finally, the calculated attack and failure propagation paths end when they reach a hazard.
Figure 2: SMARAGD’s data flow diagram editor.
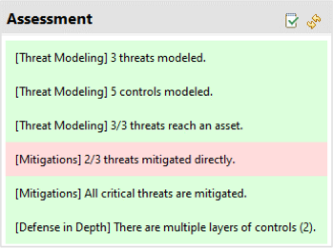
Based on the modeled system and the calculated attack and failure propagation paths, SMARAGD can calculate different security metrics. For this, SMARAGD provides an extensible rule-based assessment mechanism. Figure 3 shows the corresponding (live updating) assessment view with six exemplary rules for the modeled system. Entries shown in red represent unsatisfied rules, green entries represent rules, which were evaluated positively on the modeled architecture. The exemplary rule catalog is divided into three categories. The Threat Modeling category (cf. first three list items in the assessment view) contains base-line rules that rate the progress of the threat modeling process. These rules, for example, evaluate if threats have been identified at all, or if any controls have already been applied.
Figure 3: Assessment view.
The second category is Mitigations. It contains rules that evaluate in how far threats have or have not been mitigated by appropriate security controls. For this, SMARAGD uses its calculated attack and failure propagation paths which indicate if an annotated threat can cause failures that lead to a hazard. To mitigate these safety-critical threats, suitable security controls must be implemented. SMARAGD differentiates between controls that mitigate a threat directly, i.e., prevent the threat from occurring in the first place, and controls that mitigate the effects of threats by preventing the propagation
Assessing and Communicating Software Security: Enhancing Software Product Health 89
of failures. For example, in our sample system shown in Figure 2, there is no control in place that prevents the annotated Man-in-the-Middle (MitM) threat directly (e.g., an integrity-protecting message channel). Therefore, the associated rule is unsatisfied, and the corresponding list item is shown in red. The information about which controls can prevent a threat directly or, instead, influence the failure propagation, and where these controls need to be placed, is stored in the security control catalog.
The third category is Defense in Depth, which concerns security at the overall system level. The corresponding rule measures whether multiple layers of defense (i.e., independent controls) are present in the system architecture by determining for each threat how many controls an attacker must overcome to achieve their attack goal (e.g., to cause a hazard). Consequently, the rule assesses the extent to which the system implements the defense in depth secure design principle. The attack path with the fewest controls determines the number of defensive layers for the entire system. A control mitigates the threat if it either prevents the threat directly or is located along the attack and failure propagation path and prevents the failures caused by the threat from propagating and reaching the hazard.
In conclusion, SMARAGD enables system architects to assess security at the architectural level during the design phase, so that appropriate measures can be taken at an early stage. Despite its primary focus on security for safety-critical systems, SMARAGD can also be used for threat modeling of generic software systems. Since message failures caused by attacks also occur in non-safety-critical systems, the failure propagation paths calculated by SMARAGD can likewise be used to calculate the effects of threats on assets instead of hazards without the need for major adjustments to the concept. However, until now, the assessment view is only present in SMARAGD itself. For a holistic security assessment that also considers code-centric metrics, etc., a connection to integration systems like SPHA is needed.
INTEGRATING ARCHITECTURAL RISK ANALYSIS OF SMARAGD INTO SPHA Until now, none of SPHA’s metrics have taken information about a product’s architecture, data flow, or possible threats into account. This means that the product’s security is assessed without considering the context of its architecture, leading to an imprecise security assessment.
In this chapter, we explore the combination of SPHA’s existing security metrics with architectural and threat information to improve the risk assessment of products. Therefore, we first integrate the information directly calculated by SMARAGD. Those describe the product’s threat resilience from an architectural perspective while considering threats and planned security controls. Secondly, we combine SMARAGD’s information with information about known vulnerabilities to calculate a risk factor for security controls to fail due to vulnerabilities. This combination addresses the requirement formulated by Bodden et al. that “Any sensible threat modeling must ≫assume breach≪[…]” (Bodden et al., 2024, p. 70) while also
adding context to the known vulnerabilities to improve their prioritization (Frühwirth and Männistö, 2009).
First, we use SMARAGD’s information about mitigated threats and defense in depth layers to assess the product’s planned threat resilience. Therefore, we define three metrics: the Directly Mitigated Threats Ratio (DMTR), the Indirectly Mitigated Threats Ratio (IMTR), and the Defense in Depth Fulfillment Score (DDFS).
DMTR and IMTR determine the share of threats directly or indirectly mitigated by security controls in all modeled threats. Both mitigation metrics indicate the threat model’s current state and completeness by verifying if a mitigation is planned for all identified threats. The goal is to mitigate all threats directly or indirectly.
DDFS measures how well the threat model meets the specified defense in depth target (d). It defines the required number of security controls along a critical path that must be present to fulfill the defense in depth requirement. In a general threat model, a critical path is a connection from a threat to an asset. DDFS combines information about direct and indirect threat mitigations through security controls for each critical path within the threat model. The defense in depth target defines how many defensive layers are required for the system to be considered secure. DDFS can be calculated according to the following formula:
P
∀Security Control 1
min ∀Critical Paths d , d ∈N1
DMTR, IMTR, and DDFS are combined to the Architectural Threat Resilience Score that summarizes the overall resilience of the system, if implemented according to the model. It is computed according to the following formula: avg(0.4 × DMTR, 0.3 × IMTR, 0.3 × DDFS) that evaluates to a score between 0 and 100. The metric weights the mitigation of threats (sum of DMTR and IMTR) higher than the fulfillment of the defense in depth design principle (DDFS), as it must first be ensured that each individual threat is mitigated.
Secondly, we use the information about known vulnerabilities to add additional context to the information provided by the threat model. As outlined in the description of SPHA’s Vulnerability Risk Score, it is important to judge the risk associated with each vulnerability correctly, or in the context of the threat model, to each threat and its related security controls, to make correct decisions about the product’s development. SMARAGD’s threat model and the modeled security controls represent an ideal solution in which a security control fully mitigates a threat. In other words, it introduces a binary value: if a security control is assigned to a threat, it is mitigated (1) or not (0).
Using SPHA,we refine this binary value by using information about known vulnerabilities to derive a continuous score. The resulting Security Control Risk Score communicates the risk that the security control fails due to a vulnerability detected in its implementation or one of its dependencies. It is based on the total number of known vulnerabilities in a security control
Assessing and Communicating Software Security: Enhancing Software Product Health 91
VSC and is calculated individually for each security control. Its calculation is based on the Vulnerability Risk Score introduced in the section Software Product Health Assistant according to the following formula: 1 - Vulnerability Risk Score (VSC) 100 ∈[0, 1]
The Security Control Risk Score can further be used to improve the Defense in Depth Fulfillment Score. Instead of using the number of planned security controls mitigating a threat (directly or indirectly), we can use the Security Control Risk Score to consider inherent vulnerabilities within the individual security controls. The resulting Defense in Depth Risk Score for a given defense in depth target (d) scan be calculated according to this formula: ∀Security Control Security Control Risk Score) min ∀Critical Paths (P
d , d ∈N1 Finally, the overarching Architecture Vulnerability Score combines the Architectural Threat Resilience Score (ATRS) with the Defense in Depth Risk Score (DDRS) to reflect the impact of vulnerabilities on the planned threat mitigation practices. Thus, it becomes apparent when existing vulnerabilities undermine the originally planned security controls, and there is a need for improvement, either by adding further security controls or by eliminating existing vulnerabilities. We suggest using a weighted average for the calculation of the Architecture Vulnerability Score with weights according to the following formula: avg(0.3×ATRS, 0.7×DDRS). The weights emphasize the immediate need to address known vulnerabilities within the system’s security controls, while still taking the target architecture into account. Lastly, we integrate the Architecture Vulnerability Score in SPHA’s Security Score.
The metrics and definitions presented in this chapter are representative examples that highlight the benefits of combining SMARAGD and SPHA. They are not meant to be an exhaustive list of all beneficial metrics.
CONCLUSION
In conclusion, integrating SPHA and SMARAGD provides an automated method for assessing and communicating software security to various stakeholders. By consolidating data into a clear Architecture Vulnerability Score, decision-makers are better positioned to make informed choices regarding product development and risk management. This combination of architectural threat analysis and code vulnerability information improves the evaluation of a product’s security and related risks, making the information from SMARAGD accessible to non-technical stakeholders. Nonetheless, further work is needed to refine the integration of SMARAGD with SPHA and to expand the list of metrics. Additionally, we plan to investigate the possibility of feeding information from SPHA back into SMARAGD to enhance the workflow for SMARAGD users.
ACKNOWLEDGMENT
This research has partly been funded by the Federal Ministry of Education and Research (BMBF) under grant 01IS17047 as part of the Software Campus program.
This research has partly been funded by the European Union and the county North Rhine-Westphalia in the context of the EFRE/JTF-Program NRW 2021–2027 under grant EFRE-20800510.
REFERENCES
Bodden, E., Pottebaum, J., Fockel, M., Gräßler, I., (2024). Evaluating Security Through Isolation and Defense in Depth. IEEE Secur. Privacy 22, 69–72. Cheng, P., Wang, L., Jajodia, S. and Singhal, A., (2012). Aggregating CVSS base
scores for semantics-rich network security metrics. IEEE 31st Symposium on Reliable Distributed Systems pp. 31–40. Fockel, M., Schubert, D., Trentinaglia, R., Schulz, H., & Kirmair, W. (2022). Semiautomatic Integrated Safety and Security Analysis for Automotive Systems. In Modelsward, 147–154. Frühwirth, C., & Männistö, T. (2009). Improving CVSS-based vulnerability
prioritization and response with context information.2009 3rd International Symposium on Empirical Software Engineering and Measurement, 535–544. Kelly, T. & Weaver, R. (2004). The goal structuring notation–a safety argument notation. Proc Dependable Syst Networks Workshop Assurance Cases. Kohnfelder, L., & Garg, P. (1999). The threats to our products. Microsoft Interface,
Microsoft Corporation, 33, 1–8. McGraw, G. (2004). Software security. IEEE Security & Privacy, 80–83. National Institute of Standards and Technology (NIST), (2024). CVSS Metrics.
[online] Available at: https://nvd.nist.gov/vuln-metrics/cvss (Accessed: 13 March 2025). Tripathi, A. and Singh, U. K. (2011). On prioritization of vulnerability categories based on CVSS scores.2011 6th International Conference on Computer Sciences and Convergence Information Technology (ICCIT), 692–697. Pfleeger, S. L., Cunningham, R. K., (2010). Why Measuring Security Is Hard. IEEE
Secur. Privacy Mag. 8, 46–54. Shostack, A. (2014). Threat modeling: Designing for security. John wiley & sons. Strüwer, J., Wohlers, B., Leuer, S., Becker, M., Saleh, H., Briese, L., & Fraunhofer IEM (2024). SPHA [Computer software]: https://github.com/fraunhofer-iem/spha Strüwer, J., Wohlers, B., Saleh, H., Becker, M., Bodden, E., (2024). Software Product
A Domain-independent Model for KPI-based Process Management. Presented at the 13th International Conference on Applied Human Factors and Ergonomics (AHFE 2022).
LISTED IN THE AHFE DIGITAL BOOKSTORE CATALOGUE
Explore the complete digital volume
Human Factors in Cybersecurity
Read this individual research paper free through the original publisher, or explore the full digital proceedings book.
ISBN 978-1-964867-44-1
Explore this ISBN in the AHFE Bookstore ↗Listed in the July 2026 bookstore catalogue; search by ISBN to confirm current availability · Digital book purchase optional