Dandan Kowarsch (2025). Elevating Student Success: Harnessing Machine Learning to Enhance University Completion Rates. In: Intelligent Human Systems Integration (IHSI 2025): Integrating People and Intelligent Systems. AHFE Open Access, vol. 160, pp. 163–172. https://doi.org/10.54941/ahfe1005822
This research paper presents a machine learning approach designed to aid universities in identifying students at risk of not completing their studies. Predicting student attrition and academic success is pivotal for universities to proactively intervene and enhance student retention rates. The proposed machine learning model harnesses historical student data, encompassing demographic information, academic performance, and financial status, to construct predictive models. These models employ a comprehensive array of algorithms, including Linear Discriminant Analysis (LDA), Quadratic Discriminant Analysis (QDA), Logistic Regression (LR), Decision Tree (DT), and Feedforward Neural Network (FNN), to categorize students into distinct retention-completion groups. By adopting this approach, universities can effectively allocate resources and implement targeted interventions, offering support to students likely to either transfer out or face academic challenges. In pursuit of these objectives, this paper highlights the specific methods employed to gather and preprocess historical student data. The rationale behind the selection of each algorithm is elaborated, showcasing their combined efficacy in providing a holistic analysis of student retention patterns. As an embodiment of data-driven education, this research holds the potential to reshape how universities approach student retention. Beyond the immediate insights derived, this work suggests a promising trajectory for further research and seeks to uplift academic outcomes and foster a more supportive learning environment.
The retention rate of universities stands as a critical metric, particularly bearing immense significance for institutions grappling with low enrollment. While top-ranked universities typically maintain manageable enrollment rates and boast retention and completion rates, this reality often eludes private universities lacking in prestige. Instances of consistently higher dropout and transfer out rates may hint at strategic planning lapses and systemic shortcomings within the educational framework. Moreover, a subpar retention rate signifies not only an institutional concern but also a signal that students encounter hurdles impeding their academic journey or motivating them to consider transferring elsewhere.
A substantial body of literature expounds on factors shaping student success, including domains such as student finances, grades, college readiness, and mental well-being (Bernardo et al., 2016; Johnson, 2013; Zepke and Leach, 2010; Tinto and Pusser, 2006; Chingos, 2017). Tinto (1975, 1989, 1993, and 2012) discerned pivotal indicators correlating with student attrition: “academic challenges, struggles in aligning educational and occupational aspirations, and a deficiency in establishing academic and social connections with the institution.” However, these insights, predominantly derived from qualitative research, often encounter challenges in replication when subjected to quantitative methods rooted in limited samples. The scarcity of replicable outcomes is compounded by the cost and effort of assembling comprehensive high-quality sample data enclosing requisite attributes with precisely calibrated metrics.
To surmount the impediments posed by data constraints, this study pivots toward a machine learning modeling approach. In contrast to traditional econometric models, which grapple with limitations in accommodating categorical data and capturing all-encompassing information, machine learning techniques prove adept at generating insightful analyses (Charpentier et al., 2018; Altman et al., 1994). This study not only underscores the potency of artificial intelligence and machine learning in bolstering university performance but also highlights their profound implications for the landscape of higher education.
By using the capabilities of machine learning, this research endeavors to shed light on the intricate web of factors influencing student retention, ultimately equipping universities with innovative tools to enhance their efficacy and fortify student success.
RESEARCH DESIGN This research paper is focused on identifying robust predictors associated with students in higher education who do not complete their programs in four years, often referred to as incomplete students. The study aims to establish a causal relationship between the featured variables and the outcome. To achieve these objectives, a research design blending quantitative research with qualitative insights is employed.
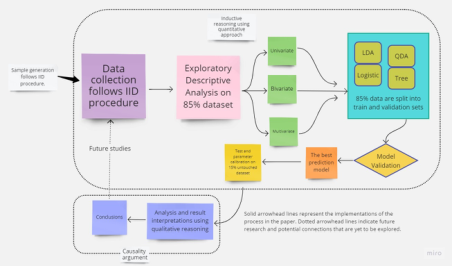
The quantitative research framework comprises a sequence of stages. It commences with meticulous data collection and proceeds through Exploratory Descriptive Analysis (EDA) and predictive modeling. EDA involves scrutinizing patterns in the sample data through univariate, bivariate, and multivariate analyses. This exploratory process is conducted on 85 percent of the dataset due to the concern of model overfitting. 15 percent of data points are untouched and used for model testing after model validation. EDA critically informs the judicious selection of appropriate machine learning models.
Subsequent to EDA, five machine learning models—Linear Discriminant Analysis (LDA),Quadratic Discriminant Analysis (QDA), Logistic Regression (LR), Decision Tree (DT), and Feedforward Neural Network (FNN)—are meticulously crafted. These models are then subjected to validation and
optimization processes tailored to their specific characteristics. The model selection hinges upon the nature of the sample data and the assumptions that emphasize the relationship between the focal features and the desired outcomes.
The validation procedure uses a cross-validation technique that randomly partitions the sample data into training and validation subsets. 70 percent of the 85 percent of data points are used for model training, and 30 percent of the 85 percent of the value points are used for validation. Given the primary emphasis on predicting high-risk students, the precision score is adopted as the key performance metric for evaluating the efficacy of the machine learning models on the testing dataset.
As illustrated in Figure 1, the research design employs a systematic process, encompassing the stages of data collection, EDA, model development, validation, and performance evaluation. This comprehensive approach combines quantitative rigor with qualitative insights, yielding a nuanced understanding of the dynamics underpinning student program completion within the higher education landscape.
Figure 1: Research design process flowchart.
DATA The dataset under examination comprises first-year college degree-seeking students who enrolled at La Sierra University during the fall terms of 2016, 2017, and 2018 and were expected to graduate in 2020, 2021, and 2022 accordingly. These years were chosen deliberately to include cohorts both before and after the pandemic’s emergence.
This sample dataset encompasses 1182 distinct freshman college students. The observations within the dataset are categorized into two groups: incomplete students, constituting 56 percent of the dataset, and completers, accounting for the remaining 44 percent. The time frame considered for this categorization is four years.
Given data availability constraints, the sample dataset incorporates a selection of feature variables consisting of total registered credits, overall GPA, student loans, variations in need-based and non-need-based financial aid, degree types, residence status (on-campus, off-campus, etc.), enrollment
166 Kowarsch
classification, and ethnicity. Note that certain variables, such as student engagement and sense of belonging, are not included due to data limitations.
At the core of this research, the unit of analysis is the individual student. Each observation corresponds to a distinct student within the university. By adopting this level of granularity, the research ensures that data independence is maintained and that all selected observations are drawn from the same distribution, thus laying the foundation for rigorous analysis.
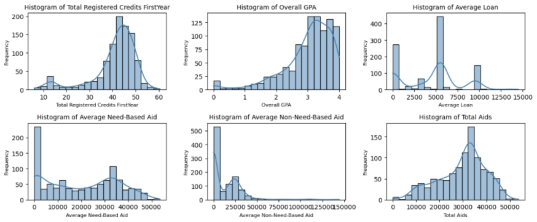
EXPLORATORY DESCRIPTIVE ANALYSIS The initial phase of analysis involves exploratory data investigation, aimed at identifying patterns between feature and outcome variables. To achieve this, a random sample selection procedure is applied, targeting 85 percent of the dataset. This curated dataset comprises 1005 observations of undergraduate students, forming the basis for subsequent analysis. To ensure data integrity, the analysis commences with a histogram-based assessment of numerical variables.
Figure 2: Histogram of numerical feature variables on exploring dataset.
Figure 2 presents a comprehensive panel of histograms, each shedding light on distinct aspects of student attributes. The left-to-right, top-to-bottom sequence includes histograms of registered credits, overall GPA, average awarded loans, average need-based aid, average non-need-based aid, and total awarded aids.
Notably, the histogram depicting registered credits reveals a left-skewed distribution. This suggests that a subset of students undertook a relatively lower credit load in their first year. A parallel observation is evident in the histogram for overall GPAs, exhibiting a left-tailed distribution that highlights students with comparatively lower GPAs. The intriguing interplay between registered credits and GPAs prompts a consideration of potential correlation, warranting further exploration through bivariate analysis.
Turning the focus to the financial perspective, the histogram illustrating student loans uncovers a tri-modal distribution. This distinct pattern indicates the presence of three dominant loan amount clusters. One cluster appears modest, concentrated around zero. Another substantial cluster is centered around $5000, representing a common loan amount for many students. Lastly, a smaller cluster emerges close to $10,000, indicating fewer
students with higher loan amounts. A more detailed information about student financial aid is shown in Table 1.
Table 1. Awarded student financial aid by completion status.
Table available in the original PDF paper.
GPA Avg. Loan Avg.
Completion Status
Registered Units in First Year
Need-Base Aid
Non-Need- Base Aid Complete 46 3.45 4217 19948 14755 Incomplete 38 2.69 4530 19369 11626
Table 1 suggests a magnifying effect: as the number of units registered increases, students receive more financial aid, which is also associated with higher GPAs. Furthermore, receiving more financial aid correlates with borrowing less in loans, thereby reducing the financial burden on students and their families.
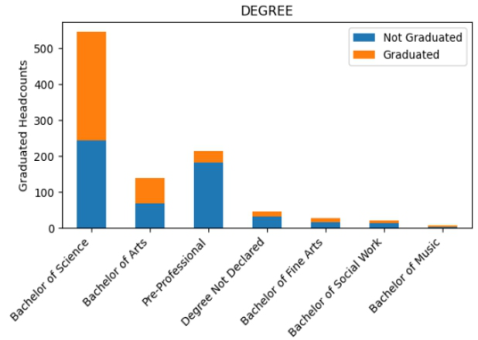
The bivariate analysis of program and completion using bar chart (see Figure 3) shows the pre-professional students are unlikely to be awarded a degree.
Figure 3: Bar chart of degree by completion status.
MODELING With a better understanding of the data, the next step is to design the modeling process, keeping in mind the observations from the exploratory data analysis (EDA). The modeling process first embarks with data scaling, an essential preparatory step. Building upon the exploratory data analysis conducted on the 85 percent dataset, this same subset serves as the foundation for our modeling endeavors. Importantly, the dataset’s feature variables manifest varying scales. This divergence in scales could potentially introduce biases by attributing undue prominence to features with higher magnitudes,
168 Kowarsch
overshadowing those with smaller but proportionally impactful changes. Such an imbalance could skew the machine learning algorithm’s performance.
To rectify this, feature scaling is implemented, striving to render each transformed variable on a comparable scale. Employing the standard scaler method—a variant of the Z-score transformation—this process entails the standardization of features. Achieved by subtracting the mean and subsequently scaling to attain unit variance, the standard score is computed as follows: . (1)
zj = xj −xj sj
Where zj is the standard value for feature j. xj is the original value of feature j. xj is the mean of feature j. sj is the standard deviation of feature j.
In pursuit of effective model training and validation, the dataset employed for EDA is partitioned into two subsets using a 7:3 ratio. Most 70 percent of the data points is reserved for training models, while the remaining 30 percent is allocated for model validation. This partitioning strategy ensures a robust evaluation of model performance while maintaining data integrity.
Within the modeling context, the assessment of predictive performance revolves around two types of errors. A Type I error occurs when the model predicts a student’s departure from the university (class 0) when they actually continue their studies (class 1 or graduated is true). A Type II error occurs when the model predicts a student’s graduation or continuation (class 1) when they actually drop out or transfer (class 0 or graduated is false). Since the university is focused on mitigating dropout or transfer, minimizing Type II errors is crucial.
Hence, the model evaluation criterion pivots on optimizing the precision score—a metric that encapsulates the sensitivity of the model in identifying true positive of class 0. The precision score’s formulation is captured by equation (2) Precision = True Positive True Positive + False Positive (2)
where true positives denote instances of students who do leave the university and are correctly predicted as such. Conversely, false positives denote cases where the model erroneously predicts departure.
RESULT AND ANALYSIS The performance of all models, including precision scores from both training and validation sets, is presented in Table 2. Among the five models evaluated for predicting incomplete students, the Feedforward Neural Network is identified as the best model based on the precision scores from the validation and the test sets.
Model performance in Table 2 suggests that all models exhibit some degree of overfitting, with the issue being especially prominent in the Decision Tree model. Among the five models, Quadratic Discriminant Analysis,
Logistic Regression, and Neural Network achieve better precision scores for predicting incomplete student outcomes on the validation set. Notably, the Feedforward Neural Network (FNN) achieves a precision score of 0.89 on the test set, outperforming Linear Discriminant Analysis (LDA) by 3 percentage points and Logistic Regression (LR) by 4 percentage points. This improvement can likely be attributed to the use of cross-validation during the parameter selection process—particularly for optimizing the number of neurons and dropout rates—which helped the model become more resilient to overfitting. In contrast, the Decision Tree model may have overfitted to noise, losing focus on key predictive features. The QDA performs poorly on the test set due to overfitting, as it is a high-variance model that can capture noise or specific patterns in the training data that are not representative of the broader test set. Additionally, QDA’s assumption of different covariance structures for each class may not generalize well if the test data distribution differs from the training data.
The top 10 important features and their associate signs retrieved from FNN model are listed in Table 3 below. It helps illustrate how the model is influenced by key features, aiding in the assessment of the rationale behind the findings.
Table 3. Key features in the feedforward neural network.
Table available in the original PDF paper.
Features Importance Direction Overall GPA 0.079 + Total units in the 1st term 0.055 + Pre-Professional student 0.025 − Christian student 0.018 − Bachelor of Science 0.016 + Live in dorm 0.016 −
Table 3 shows that the overall GPA is the most important positive factor for predicting student completion, followed by the number of units registered in the first term and whether the student is in a science major. On the other hand, the most significant negative factor is enrollment in a pre-professional program, along with the requirement to live in a dorm during the first year. Additionally, since the university is a Christian-based institution, students who do not complete their degree are more likely to identify as Christians.
170 Kowarsch
CONCLUSION
In the EDA procedure, histograms are employed to visualize the distribution and frequency of numerical features, while a bar chart (Figure 3) is used to describe the frequencies of categorical features. The EDA displays a strong association between pre-professional students and student incompletion. The findings also highlight that in the first year, most incomplete students are related to lower GPAs, fewer registered courses, and higher loans while those who are more likely to graduate have a better GPA and are awarded more non-need-based financial aids. These relations, encapsulated in Table 1, not only illuminated the current, but also set the stage for the predictive endeavors that followed.
With the findings from the EDA in hand, five prediction models are built and validated using data partition and cross validation process. After parameter optimization procedure, the Feedforward Neural Network is considered the best model in terms of a prediction power of 89 percent on successfully capturing potential at risk of leaving students. More specific, the FNN identified the strongest predictor for a higher completion rate is student cumulative GPA in the first year, followed by the total registered credits, the program of bachelor’s in science.
One reason pre-professional major students transfer out is that these programs often have demanding course loads and rigorous academic requirements. Students in these programs may experience high levels of stress and workload, which could impact their overall satisfaction and likelihood of continuing. If the pre-professional students have struggles to meet the program’s academic expectations, they might feel discouraged and less motivated to continue.
Overall, the outcomes support the positive impact of GPA on completion rate. Students who maintain higher GPAs tend to experience academic success, which can boost their confidence and motivation to continue their studies. La Sierra University has policies regarding satisfactory academic progress, which require students to maintain a minimum GPA to remain in good standing. Students who fall below this threshold need to either retake the courses or face academic probation or other consequences that could affect their retention. Some degree programs have specific GPA requirements for enrollment in upper-level courses or declaring a major. Students who do not meet those requirements might struggle to advance in their chosen field, impacting their engagement and retention. Students who have lower GPA may not be eligible for financial aid programs. Students who lose access to these forms of assistance due to low GPAs might struggle with increased financial burden, impacting their ability to continue their education.
REFLECTIONS The machine learning technique is an algorithm optimization-based tool. It helps uncover patterns between our predictors and outcomes. While this technique offers a powerful lens to discern hidden patterns between predictors and outcomes, it does so with a caveat – the need for a deep understanding of the domain to interpret its outcomes accurately. It requires
domain knowledge when interpreting machine learning outcomes. In this study, the lower completion rate in pre-professional major could be related to data collection issue since this group students receive a completion status rather than a degree. The sample may not mark all pre-professional completers as completers.
Second, the transfer out or dropout students were the freshman dormitory students, intertwined with the pre-professional program, reveal another layer of facts. The policy requiring first-year students to live on campus may inadvertently create a dynamic where financial struggles and work obligations hinder academic progress. The connection between long hours spent working to afford room and board and a subsequent dip in GPA shines a light on the challenges faced by students who are attempting to balance both academics and livelihood.
Lastly, the distinction between different types of student departures is not distinguished. While these two groups share common characteristics, they also harbor unique traits that shape their decisions. This insight serves as a reminder of the complexity inherent in student attrition dynamics.
As the field of artificial intelligence modeling advances, there is promise for exploring greater granularity. By refining the approach, developing separate models tailored to predict transfer and dropout students individually will be more impactful. This specialized method will help unravel the distinct drivers and factors underlying each type of departure.
ACKNOWLEDGMENT
The author would like to acknowledge the Office of Title V and the Provost of La Sierra University for their support and contributions to this research.
REFERENCES
Altman, E., Marco, G., Varetto, F. (1994). Corporate distress diagnosis: Comparisons using linear discriminant analysis and neural networks (the Italian experience). Journal of Banking & Finance, 18(3), 505–529. https://doi.org/10.1016/0378- 4266(94)90007-8 Bernardo, A., Esteban, M., Fernandez, E., Cervero, A., Tuero, E., & Solano, P. (2016). Comparison of Personal, Social and Academic Variables Related to University Drop-out and Persistence. Front. Psychol. 7:1610. doi: 10.3389/fpsyg.2016.01610. Breiman, L. Fiedman, J., Olshen, R. A., Stone, C. J. (1984). Classification and Regression Trees. Chapman & Hall/CRC Press Online. https://www.stat.wisc.edu/∼loh/treeprogs/guide/wires11.pdf Chingos, M., M. (2017). Don’t forget private, non-profit colleges. Economic
Studies. Brookings. Evidence Speaks Reports, Vol. 2, #9. Charpentier, A., Flachaire, E., Ly, A. (2018). Econometrics and Machine Learning. Economics and Statistics, 505–506, pp. 147–169. https://doi.org/10.24187/ecostat.2018.505d.1970 Landis, J. R. & Koch, G. G. (1977). The Measurement of Observer Agreement for Categorical Data. Biometrics, 33(1), 159–174. https://doi.org/10.2307/2529310 Lin, H. W., Tegmark, M., Rolnick, D. (2016). Why does deep and cheap learning
work so well? https://arxiv.org/abs/1608.08225
172 Kowarsch
Liz Thomas (2002) Student retention in higher education: the role of institutional habitus, Journal of Education Policy, 17:4, 423–442, doi: 10.1080/02680930210140257. Shalev-Shwartz, S., Ben-David, S. (2014). Understanding Machine Learning: From Theory to Algorithms. Cambridge, UK: Cambridge University Press. Pascarella, E., and Terenzini, P. Interaction effects in Spady’s and Tinto’s conceptual
models of college dropout. Sociology of Education 1979, 52 197–210. Tinto, V. (1993). Leaving college: Rethinking the causes and cures of student attrition (2nd ed.). Chicago: University of Chicago Press. Tinto, V., Pusser, B., (2006). Moving From Theory to Action: Building a Model of
Institutional Action for Student Success. NPEC. Tinto, V. (2012). Completing College. University of Chicago Press. Tinto, V. (2016), From Retention to Persistence, Inside Higher Ed. Tinto, V. (2017). Through the Eyes of Students. Journal of College Student Retention: Research, Theory & Practice, 19(3), 254–269. Zepke, N., Leanch, L., (2010). Improving student engagement: Ten proposals
for action. Active Learning in Higher Education 11:167. SAGE. doi: 10.1177/1469787410379680. Zheng, H., Webber, K., (2023). AI in Higher Education: Implications for Institutional Research. (AIR).
LISTED IN THE AHFE DIGITAL BOOKSTORE CATALOGUE
Explore the complete digital volume
Intelligent Human Systems Integration (IHSI 2025): Integrating People and Intelligent Systems
Read this individual research paper free through the original publisher, or explore the full digital proceedings book.
ISBN 978-1-964867-36-6
Explore this ISBN in the AHFE Bookstore ↗Listed in the July 2026 bookstore catalogue; search by ISBN to confirm current availability · Digital book purchase optional