Chao Zeng, Wang Haining (2024). Correlation Analysis of Mobile Vibration Parameters and Emotional Responses. In: Usability and User Experience. AHFE Open Access, vol. 156, pp. 58–64. https://doi.org/10.54941/ahfe1005415
Different combinations of vibration parameters often provide users with varied emotional experiences in the application scenarios of smartphones. This study examined the subjective preferences of users within specific vibration frequency ranges (50-500Hz) and vibration intensity ranges (0-100) for different vibration parameters. Data was collected from 59 participants on their subjective reactions to different vibration schemes across three emotional dimensions (preference, neutrality, and aversion). Correlation analysis was conducted using the parameters and subjective data. The results of this study will help guide the optimization of vibration parameter combination designs to enhance the vibration feedback experience on smartphones.
In recent years, the consumption of electronic consumer products globally has shifted from a frenzied state to a more stable level. Consumers’ increasing awareness has led them to move beyond the vicious cycle of chasing the ulti- mate performance in electronics, turning their attention instead to demands for wearability, portability, and comfort in electronic products. Tactile per- ception, as a major sensory channel in humans, relies on skin receptors to sense mechanical stimuli in the physical world such as vibrations, electrical stimulation, pressure, and temperature changes.
Taking smartphones, the most frequently used device, as an example, a survey conducted by Gallud and others showed that 69.3% of participants receive fewer than 50 notifications per day, with 9.7% receiving more than 100 notifications daily. The survey also indicated that 44.7% of participants immediately check their smartphones when they receive a new notification (Gallud and Tesoriero, 2015). Usually, visual or auditory notifications might distract users from more important tasks when using smartphones, and the currently used vibration notifications can only inform about the timing of an event, hardly conveying any detailed information about the event (Omata and Kuramoto, 2020). For users accustomed to silent mode, vibration becomes the primary means of receiving information. The design of smartphone vibra- tion schemes significantly affects user experience and can evoke specific emotions in particular scenarios.
Correlation Analysis of Mobile Vibration Parameters and Emotional Responses 59
To elucidate the characteristics of vibration patterns that evoke specific sensations, a study measured people’s responses to different vibration pat- terns. Participants were asked to use a Semantic Differential Method (SDM) rating scale with 15 pairs of adjectives to react to 85 different vibration patterns on a 5-point interval scale (Fukuda et al., 2024). The research on the characteristics of vibration patterns aims to evoke specific sensations in people and has practical applications in everyday life. The purpose of this study is to determine the correlation between three basic emotions elicited in smartphone vibration feedback scenarios and the vibration frequency and intensity. Evaluations and parameter differences under different emotional subcategories were derived through subjective user assessments and objective parameter analysis of fixed vibration combinations.
EXPERIMENTAL METHODS Participants
User recruitment was conducted through an online questionnaire, selecting 60 participants for the experiment, with one individual withdrawing mid- experiment due to personal reasons. The 59 participants who completed the experiment all had at least 2–3 years of smartphone usage experience and no history of musculoskeletal disorders in their hands. The group included 28 males and 31 females, with a near 1:1 male-to-female ratio ensured across different age layers and BMI index categories.
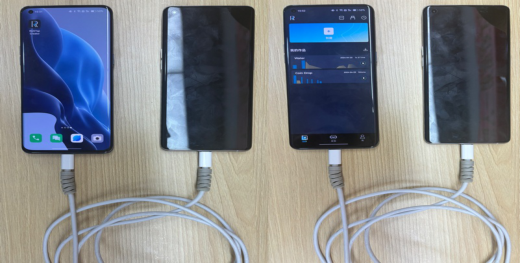
Apparatus and Experimental Applications This study utilized two smartphones with identical basic configurations and body dimensions of 160.3mm x 72.6mm x 8.70mm, named as Device A and Device B. Device A, with its screen always off, simulated the standby rest mode of a phone during vibration initiation. Device B was equipped with vibration-triggering software, controlled and activated by the experimenter’s settings. The two devices were connected via dual-head Type-C data cable, allowing vibration commands from Device A to trigger vibration feedback through Device B’s z-axis linear motor, producing vibrations as depicted in Figure 1.
Figure 1: Devices A and B that transmit vibrations through a data cable.
60 Zeng and Wang
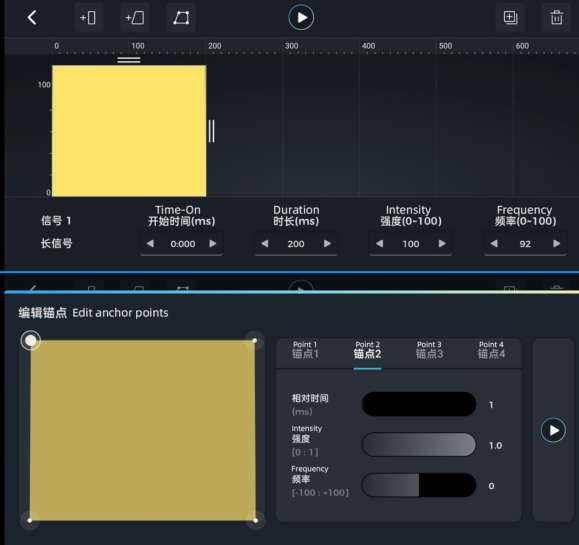
The vibration-triggering software used was RichTap Creator, whose main parameter adjustment screen includes initiation time, vibration duration, vibration intensity, and vibration frequency. The settings were: initiation time at 0ms and vibration duration uniformly at 200ms. Vibration intensity and frequency were variables combined freely. Due to software character- istics, vibration intensity (0–100) could be adjusted for average granularity on the main screen, while vibration frequency (0–100) required adjustment using secondary page parameters (−100 to 100) to reflect true frequency values, and it could not ensure uniform granularity in frequency changes. Thus, parameter averaging was necessary for value conversion. A conversion table was provided by the software manufacturer. For example, as shown in Figure 2, a secondary page frequency value of 0 with a main screen frequency value of 92 represents a true vibration frequency of 230–240Hz, which was treated as 235Hz in the experiments.
The experiments used calibration scoring and arousal scoring scales based on the SAM scale. The selection of emotion words was based on terms from the Circumplex Model.
Procedures Experimental Explanation Phase: Verify the participants’ personal informa- tion, introduce the complete experimental process and the meanings of the scales used, and obtain a signed informed consent form from the participants.
Correlation Analysis of Mobile Vibration Parameters and Emotional Responses 61
Experimental Experience Phase: With the assistance of the experimenter, participants familiarize themselves with the feel and weight of the experimen- tal prototype. They establish a basic impression of all vibration parameter combinations that will appear during the experiment. This step facilitates horizontal comparisons during scoring, allowing for more accurate results. After establishing impressions, guided by the experimenter, participants com- plete a full experience sequence for 10 groups of randomly parameterized vibration schemes, which includes: (1) Participants sitting still, naturally holding Device B in their right hand, and looking straight ahead. (2) The experimenter adjusts parameters on Device A and plays vibrations randomly five times. (3) Participants experience the vibrations and sequentially rate emotional preference (preference, neutrality, and aversion), describe emo- tions (using a basic word library or their own descriptions), calibrate scoring (1–9), and arousal scoring (1–9), with the experimenter recording the results.
Formal Experiment Phase: Due to the uneven granularity characteristics of the software-adjusted vibration frequencies, 10 fixed vibration frequen- cies are selected (50Hz, 70Hz, 120Hz, 140Hz, 200Hz, 240Hz, 280Hz, 340Hz, 400Hz, 500Hz). Participants then subjectively choose four intensity points for each frequency, dividing the intensity (0-100) into five distinctly different vibratory strength intervals. The 10 frequency values and four inten- sity values form the participants’ vibration parameter combination schemes. Participants sit and wait as the experimenter plays 40 groups of vibra- tion schemes in a random order. After each group, participants sequentially provide ratings for emotional preference, emotional description words, cal- ibration scoring, and arousal scoring, with the experimenter recording the results.
Interview Phase: Conduct structured interviews with participants to under- stand their judgment criteria for different vibration schemes during the experiment, clarify the semantic information of the emotional description words provided, and make supplementary corrections to any ambiguous descriptions.
Data Collation and Processing The 59 participants generated a total of 2360 data sets. During data verifi- cation, sets containing fundamental logical errors were removed, such as one where the emotional preference was “liking,” the descriptor was “comfort- able,” the calibration score was 5 (naturally calm), and the arousal score was 5 (barely arousing), which was considered logically flawed and thus invalid. Ultimately, 2201 valid data sets were retained, achieving an effec- tiveness rate of 89%, with the proportions of liking, neutrality, and dislike being approximately 31%, 33%, and 36%, respectively, nearly achieving a 1:1:1 ratio. Based on the results of structured interviews combined with emotional descriptors, the three basic emotions were semantically subdivided further. Liking was divided into emotions of happiness and comfort, neutrality into calm and relaxation, and dislike into unease and impatience.
62 Zeng and Wang
RESULTS
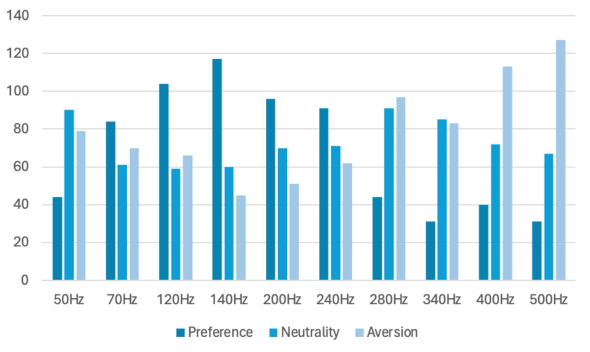
In 2201 valid data sets, the frequency distribution of the ten fixed frequen- cies for three emotional categories is shown in the graph below. Combining user interviews, it can be concluded that the perceived preference ranking for vibration feedback of the ten fixed frequencies is 140Hz > 120Hz > 200Hz > 240Hz > 70Hz > 50Hz ≈280Hz ≈340Hz ≈400Hz ≈500Hz, as shown in Figure 3.
Figure 3: The bar chart of emotional data distribution across different frequencies.
By conducting correlation analysis and statistical evaluations on the dis- tribution of emotional feedback data across three dimensions—frequency- arousal, frequency-calibration, intensity-arousal, and intensity-calibration— it can be observed that vibration intensity is correlated with both calibration and arousal in every emotional dimension(p<0.01). Taking disgust as an example, after statistical analysis, there is no correlation between vibration frequency and calibration or between vibration frequency and arousal. How- ever, there is a negative correlation between intensity and calibration(p<0.01), and a positive correlation between intensity and arousal(p<0.01), as shown in Table 1.
Table 1. Pearson correlation coefficient calculation data table.
Correlation Analysis of Mobile Vibration Parameters and Emotional Responses 63
As mentioned earlier, the three emotional judgment terms are subdivided into preference (joy, comfort), neutrality (calm, relaxed), and aversion (anx- ious, irritable). Differences in how participants perceive emotional word descriptions were calculated under each subdivided emotional perception. The comprehensive scores for subdivided emotions are presented in the table below. Since the frequency values are unevenly continuous in the device, the average vibration frequency values sought have no research significance, as shown in Table 2.
This study analyzed how users of different ages and BMI values emotionally judge vibration schemes with various parameter combinations when using smartphones. It involved correlational analyses between the frequency and intensity of the vibration schemes and the calibration and arousal dimensions of emotional evaluation. The emotions were further subdivided into three cat- egories to understand the average vibration intensity, average arousal score, and average calibration score under each subdivided emotion category. By understanding user feedback on the emotional descriptors given for different vibration parameter combinations, this can better guide vibration designers in making more rational parameter choices when defining the target vibration scheme.
In the analysis of user preferences for vibration frequency, it was clearly observed that users had a higher preference for vibration schemes within the 120Hz–240Hz range, with a liking emotion proportion of 45.7%. The overall preference was highest at 140Hz, reaching 52.7%. As the frequency increased or decreased, so did the users’ preference. Below 120Hz, the pref- erence for vibration frequency was 29.9%, and above 240Hz, it was 16.7%. Overall, users displayed a relatively even distribution of neutral emotions across different frequencies, with 35.2% in the below 120Hz range, 29.1% in the 120Hz–240Hz range, and 35.7% above 240Hz.
Correlation analyses revealed that apart from the intensity under neutral emotions showing no correlation with calibration, other emotional categories showed correlations between calibration and arousal scores with vibration intensity, and no correlation with vibration frequency.
In the subdivided emotional categories, the “happy” emotional state showed a higher overall intensity level of 66.8, with corresponding higher
64 Zeng and Wang
arousal and calibration scores of 7.09 and 7.05, respectively. The “comfort” emotion, categorized under liking, had vibration intensity levels similar to the “calm” and “relaxed” emotions under neutrality, with differences in arousal and calibration scores of only about +0.5 to +0.8. For the dislike emotion, overall vibration intensity was high, and a characteristic feature was higher arousal scores and lower calibration scores.
Research on emotional preferences for vibration parameters requires par- ticipants to have a certain discernment ability for different vibration schemes. Additionally, due to individual preferences for smartphone models, differ- ences in models used daily, and variations in personal usage experience, future experiments should include more prototype devices with different industrial designs. Other vibration parameters such as duration and amplitude should also be added to explore users’ vibration emotional preferences from multiple perspectives more thoroughly, establish parameter-related models, and assist vibration designers in scientifically crafting vibration schemes.
CONCLUSION
This study investigated users’ emotional judgments of vibration schemes with different frequency and intensity combinations. The results indicate that users have the highest preference for vibrations within the frequency range of 120Hz to 240Hz, with the optimal frequency value being 140Hz. Additionally, there is no significant correlation between vibration frequency parameters and users’ emotional judgments. Vibration intensity parameters consistently exhibit a positive correlation with awakening scores. They also show a positive correlation with valuation scores in positive emotional states and a negative correlation in negative emotional states, with no significant correlation in neutral emotional states. Scores for individual emotional words under subdivided emotions can guide the design and evaluation of vibration schemes for smartphones.
ACKNOWLEDGMENT
This study is supported by the Human Factors Research Project on Vibra- tion Comfort and Emotional Perception. Special thanks to the staff of the Laboratory of Human Measurement and Wearable Device Design at Hunan University, as well as all researchers and supervisors involved in this project.
REFERENCES
Fukuda, R., Miyake, S., & Kobayashi, D. (2024). Evaluating Smartphone Vibration Patterns and Evoked. Gallud, J. A., & Tesoriero, R. (2015, August). Smartphone notifications: A study
on the sound to soundless tendency. In Proceedings of the 17th International Conference on Human-Computer Interaction with Mobile Devices and Services Adjunct (pp. 819–824). Omata, M., & Kuramoto, M. (2020). Design of Syllabic Vibration Pattern for Incoming Notification on a Smartphone. In CHIRA (pp. 27–36). Saket, B., Prasojo, C., Huang, Y., & Zhao, S. (2013, February). Designing an effective
vibration-based notification interface for mobile phones. In Proceedings of the 2013 conference on Computer supported cooperative work (pp. 149–1504).
LISTED IN THE AHFE DIGITAL BOOKSTORE CATALOGUE
Explore the complete digital volume
Usability and User Experience
Read this individual research paper free through the original publisher, or explore the full digital proceedings book.
ISBN 978-1-964867-32-8
Explore this ISBN in the AHFE Bookstore ↗Listed in the July 2026 bookstore catalogue; search by ISBN to confirm current availability · Digital book purchase optional