Jiaci Xie, Menghan Li (2024). In-depth analysis based on the phenomenon of pedestrians entering the scene when tourists take photos: Designing interactive reminder devices. In: Usability and User Experience. AHFE Open Access, vol. 156, pp. 361–372. https://doi.org/10.54941/ahfe1005447
This study aims to observe and analyze the behaviour and motivation of pedestrians who accidentally enter the camera frame when tourists are taking photos in the scenic area. Meanwhile, to enhance the photographic experience of tourists, a friendly interactive device is designed to remind pedestrians to avoid the photo-taking area. User interviews and experimental designs are used to analyze the behavioural characteristics of tourists and pedestrians during photo-taking. It is found that both tourists who are interrupted from taking photos and choose to wait silently and pedestrians who interrupt tourists from taking photos exhibit relatively obvious characteristics. Also, the experiments measured that the easiest distance to be interrupted is 2.5-3m from the photographer to the photographed person, and the easiest form of interaction to attract pedestrians' attention is ground projection and sound interaction. To solve the problem of being interrupted while taking photos, this study utilizes machine learning technology to successfully identify tourists' photo-taking actions and combines it with Arduino, Processing, madmapper to initially implement the desired interactive device design to remind pedestrians to avoid the camera frame, thereby increasing tourists' photographic experience and overall scenic area visit comfort.
Photography plays a pivotal role in the travel experience, and for many, embarking on a journey without capturing moments through photos seems unimaginable (Nikjoo and Bakhshi, 2019). Tourists often seek to docu- ment various aspects of their travels, including historical landmarks, modern attractions, natural scenery, cultural encounters, and portraits (Stepchenkova and Zhan, 2019). While capturing a personalized snapshot with iconic landmarks is a significant goal for many tourists, the experience of being interrupted by pedestrians during photography sessions remains a common challenge in tourist destinations.
In light of this backdrop, ensuring tourists have a positive photography experience at tourist sites becomes increasingly crucial. Previous research suggests that photography has a dual impact on travel satisfaction and revis- itation intentions (Lee et al., 2020). However, the impact of interruptions
caused by pedestrians during tourists’ photography and effective strategies to mitigate such disruptions in tourist photography settings lack comprehensive analysis.
Despite the growing scholarly interest in the subject of photography, there is a dearth of systematic exploration into how tourists are affected when interrupted by pedestrians during photography in tourist areas. This study aims to investigate the behavioural characteristics of both tourists and pedes- trians throughout the entire photography process. The ultimate goal is to design an interactive device that alerts pedestrians to avoid designated pho- tography areas. This study employs a combination of observational and user interview methods, utilizing both qualitative and quantitative analyses to pro- cess and interpret the data. Machine learning techniques are incorporated in conjunction with hardware devices to accomplish the final interactive design.
Research Process Design This study conducted with four research, one model design and final field- testing experiment. Research One was a field observation experiment in which researchers randomly observed one hundred groups of tourists when they were taking photos, recording pedestrians’ and their behavioural char- acteristics. Research Two was a deep interview conducted by researchers on three tourists and three pedestrians. Research Three was to test the pho- tographing distance that is easily crossed by pedestrians. Research Four explored the interactive form that was easily attracted by pedestrians. According to the above research, this article initially completed the design of the interactive device by using machine learning (Edge Impulse) to iden- tify tourists’ photo actions, and combined with Arduino, Processing, and madmapper. In the final field-testing experiment, the above research results were re-examined.
Research One: On-Site Observational Experiment Observation, as a method to study tourist behaviours, is a well-established approach (Pearce and Wang, 2019). Behavioural observation involves researchers purposefully using their sensory organs or observation tools to systematically observe user activities in a natural setting according to the needs of the research topic, and collecting data (Fei and Junhua, 2009). In this study, the observational method was employed to explore the behavioural characteristics of both tourists and pedestrians. The observational results were subsequently analyzed. Traditionally, observational results are hand- written on recording sheets (Jeremy et al., 2013), and this experiment primarily utilized methods such as fixed-point observation and manual record-keeping for data collection.
Observation Preparation Three locations were selected for observation, Tianjin Eye, Wudadao (Five Avenues), and the Porcelain House scenic area, all known for their signifi- cant tourist footfall. The observation took place at 10:00 AM on the selected day. Throughout the observation process, the designated observation areas
In-Depth Analysis Based on the Phenomenon of Pedestrians Entering the Scene 363
remained fixed, and the observation ceased upon collecting data from 100 groups of tourists. Before starting the recording, the recording content has been designed in advance in Table 1.
Table 1. Design record content according to different groups of people.
Table available in the original PDF paper.
Groups of People Content of recording(a) Content of recording(b) Content of recording(c) Tourists who were not interrupted (Group A) Total duration for taking photos Tourists who were interrupted (Group B)
Responses after being interrupted
Total time spent on taking photos
Number of interruptions during the photography process Behaviours when crossing through the tourist photo area Pedestrians (Group C) Characteristics of individuals interrupting others during photography
Whether they were aware of interrupting tourists’ photos and the way they handled it.
Observation Data Among the 100 groups of observed tourists, only 26 groups managed to capture satisfactory photos without interruptions. In contrast, the remain- ing 74 groups experienced disruptions during their photography sessions. The characteristics of these two groups of tourists are summarized in Table 2.
Table 2. Analysis of tourist characteristics: Group A vs. Group B.
Table available in the original PDF paper.
Age Sex Camera equipment Travel characteristics Groups of People Group A 35–55 No obvious feature
Mobile phones account for 96%
The number of people traveling was 78% Group B 20–30 72% female Mobile phones account for 88%
Two or three trips accounted for 70%
Group A For Group A, the study recorded the total duration of photography for 26 groups of uninterrupted tourists. In comparison to interrupted tourists, the photography duration for this group was concentrated in the range of 20– 40 s, with 81% of tourists completing their photography within 60 seconds. Additionally, 7.6% of tourists took more than 80 seconds to capture their photos.
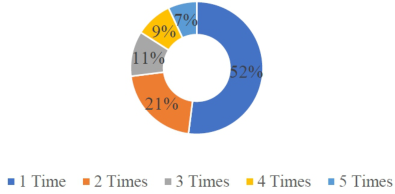
Group B Record a. In Group B, among the 74 groups of tourists who experienced interruptions, the frequency of interruptions is illustrated in Figure 1. This observational result confirms the prevalence of pedestrians interrupting tourists during photography, serving as one of the primary bases for this study.
364 Xie and Li
Figure 1: The percentage of times of tourists are interrupted.
Record b. The behavioural reactions of tourists after being interrupted constitute a crucial component of this study. Typically, tourists tend to hold their photography equipment or place it in a convenient location to quickly prepare for photography. In the observations, it was noted that out of the 74 groups of tourists who experienced interruptions, 40 groups chose to wait patiently, while only 6 groups opted to communicate with pedestrians to achieve their photography goals.
Record c. For the 74 groups of tourists who experienced interruptions, the time data revealed that 52% of the tourists spent between 60–80 seconds on photography, while only 14% completed the photography process in 40 seconds or less. Based on the time values from the 74 groups of tourists, the calculated average duration for completing photography after an interruption was 75 seconds.
Group C Record a. Researchers documented the characteristics of pedestrians crossing through the photography area, with adults accompanied by children (under 12 years old) being the highest proportion, accounting for 39% of the total. In many instances, individuals tend to gaze towards the centre of their field of vision, particularly when moving within an environment (Foulsham et al., 2010). The standard height for a 12-year-old child is around 1.5m, with their eye level generally below 1.5m. Considering that tourists typically capture photos at a height of 1.6–1.8m, the difference in the centre of vision height makes it challenging for a child to notice tourists engaged in photography. When a child crosses the photography area, the accompanying adult often follows directly, interrupting the tourists’ photography process.
Record b. Simultaneously, researchers documented the behavioural expres- sions of pedestrians when crossing through the photography area. Consistent with the observed characteristics of pedestrians in Record a, the highest pro- portion of behaviour was adults accompanying children, constituting 39%. Other observed behaviours included looking down at mobile phones (17%), admiring the scenery (16%), and conversing with friends (28%).
The definition of conscious behaviour typically involves our active aware- ness and self-perception, while unconscious behaviour is often imperceptible directly, representing automated processes and computations occurring in the background of our brain (Kouider and Faivre, 2007).
In-Depth Analysis Based on the Phenomenon of Pedestrians Entering the Scene 365
Record c. Researchers documented whether the 74 groups of pedestri- ans noticed tourists when interrupting photography. The results indicate that 94.5% of pedestrians neither perceived nor observed tourists engaged in photography, categorizing their behaviour as unconscious. Among the 4 individuals (5.5%) who did notice tourists taking photos, only one pro- ceeded consciously while the proportion of this subgroup was minimal. The researchers will disregard such cases in subsequent studies. for completing photography after an interruption was 75 seconds.
Conclusion
Behavioural observation is not inherently orderly; rather, it constitutes a rather noisy manifestation. Researchers need to utilize data recording to infer more stable states and processes based on the observed behaviours (Skinner, 1966). In order to enhance the accuracy of the obtained information, this study subsequently conducted in-depth interviews to gain further insights into the characteristics of pedestrians and tourists.
RESEARCH TWO: FACE-TO-FACE INTERVIEW Interview Process
Interviews serve as a research method for collecting psychological and behavioural data through oral communication with study subjects (Qi, 2004). Through interviews, researchers can grasp the subjective feelings and attitudes of respondents towards a particular event or object, thereby analyz- ing their psychological states and behavioural characteristics. In this study, on-site interviews were conducted with three pedestrians and three tourists.
The qualitative content analysis method was employed to analyze the interview data. Qualitative content analysis is a systematic and objective means of describing and quantifying phenomena (Elo and Kynga¨s, 2007). The responses of the interviewees were categorized and presented based on age characteristics.
Table 3. Background information of interview participants.
Table available in the original PDF paper.
Label Gender Occupation Age Tourist A Male Student 16 Tourist B Female Teacher 27 Tourist C Male Accountant 45 Pedestrian D Female Student 19 Pedestrian E Female Student 22 Pedestrian F Male Shopkeeper 51
Interview Results Through the analysis of interviews, it was observed that the issue of pedestri- ans entering the camera frame troubles many tourists. Frequently not noticing individuals taking photos is identified as the primary cause of pedestrians
366 Xie and Li
unintentionally entering the frame. These issues involve aspects such as indi- vidual experiences, social factors, order maintenance, and coping strategies. Understanding these differences can help researchers better comprehend the needs of tourists during travel, aiding in the design of subsequent interactive devices to enhance the overall tourist experience.
RESEARCH THREE: MEASURING PHOTOGRAPHY DISTANCE Experimental Method
Researcher A simulated the photographed person near the attraction, while Researcher B simulated the photographer at specified intervals. The location chosen was the crowded Tianjin Wudadao Minyuan Square, and the time was 3:00 PM. Observations were made for every 40 groups of pedestrians at inter- vals of 1 to 5 meters, with a 0.5-meter increment. The researchers recorded the number of individuals in each group who chose to directly pass through, wait, or detour, along with the percentage of those who passed through. Accu- rate distance measurement and marking were done using a tape measure. The entire experiment, conducted without hindering the normal passage of tourists, involved data recording by other researchers.
Experimental Results From Table 4, it can be observed that the number of individuals choosing to pass directly through increases significantly between 2.5m to 3m. Beyond three meters, although the number of individuals continues to grow, the rate of increase diminishes.
The experiment reveals that as the distance between the photographer and the subject exceeds 2.5 meters, the proportion of pedestrians passing through the middle increases. Therefore, when the distance between the photographer and the subject is greater than 2.5 meters, it is advisable to place and design alert devices to attract the attention of pedestrians and prevent them from passing through the photography area.
In-Depth Analysis Based on the Phenomenon of Pedestrians Entering the Scene 367
RESEARCH FOUR: INTERACTION EXPERIMENT DESIGN Interaction Experiment
Step One: Objective to Explore the Most Effective Interaction Method to Capture Pedestrian Attention In order to investigate the interaction method that best captures pedestrian attention, researchers A and B simulated the photographer and subject once again, maintaining a distance of 2.5–3 meters. Different interaction meth- ods were tested, including a prohibited passage image, scrolling text stating “Someone is taking photos, please go around,” flashing lights, and a treasure chest sound effect. To avoid significant disturbance during daylight hours, the sound pressure level of stable, continuous noise in balconies, terraces, and outdoor living areas should not exceed 55 decibels (Berglund and Lindvall, 1995). Therefore, a 55-decibel sound alert was chosen. To avoid interference with photography, a 12.9-inch electronic screen was used and placed on the ground to the right of the photographer, 50 cm in front. The experiment was divided into two groups: the first group conducted experiments from 10 am to 11 am at the Tianjin Eye scenic area, and the second group from 8 pm to 9 pm at the same location. Each method was tested on 20 pedestrians, observing whether they noticed the indication and chose to detour.
Researchers recorded and statistically analyzed the effectiveness of these four interaction methods. The findings revealed that sound interaction was most effective in capturing pedestrian attention between 10 am and 11 am, while light interaction was most effective between 8 pm and 9 pm, as shown in Tables 5 and 6.
Table 5. Experimental data statistics of interaction mode of Tianjin Eye Scenic spot from 10 am to 11 am.
Table available in the original PDF paper.
Proportion of valid reminders
Interactive mode Total number of experimental groups
Number of valid reminder groups Indicates the No-go image 20 11 55% Scroll text 20 8 40% Light flicker 20 13 65% Audible reminder (55 dB) 20 17 85%
Table 6. Experimental data statistics of Tianjin Eye Scenic spot and interactive mode from 8:00 p.m. to 9:00.
Table available in the original PDF paper.
Proportion of valid reminders
Interactive mode Total number of experimental groups
Number of valid reminder groups Indicates the No-go image 20 11 55% Scroll text 20 9 45% Light flicker 20 18 90% Audible reminder (55 dB) 20 13 65%
368 Xie and Li
Step Two: Objective to Explore Which Position of Light Interaction More Effectively Captures Pedestrian Attention Building upon the conclusions of the first step, further categorization of light interaction forms was conducted. It was divided into handheld lights flashing at the same height as a person and light projections on the ground. Both of these light interaction forms were subjected to additional testing, maintaining a sample size of 20 for each group. The relevant data is pre- sented in Table 7, revealing that ground light projections were more effective in alerting pedestrians.
Table 7. Statistics of experimental data of light interaction.
Table available in the original PDF paper.
Number of valid reminder groups
Effective reminder ratio
Light interaction type Total number of experimental groups Hand light flashing 20 12 60% Ground light projection 20 19 98%
Step Three: Objective to Explore the Effectiveness of Guiding and Blocking Light Interactions on Pedestrians Building on the conclusions from the first two steps of the experiment, the light projection category was further subdivided into guiding and blocking light projections. Subsequent testing and recording were conducted, main- taining a sample size of 20 for each group. The experimental data, as presented in Table 8, unmistakably indicates that guiding light projections are more effective in preventing pedestrians from entering the tourist’s frame.
Table 8. Statistics of experimental data of lighting types.
Table available in the original PDF paper.
Number of valid reminder groups
Effective reminder ratio
Lighting type Total number of experimental groups Guided light projection 20 17 85% Blocking light projection 20 9 45%
CONCLUSION
Based on the three-step experiment conducted, this study draws the follow- ing conclusions: the most effective interaction form to capture pedestrians’ attention to tourists taking photos involves a combination of ground projec- tion and sound prompts. Among these, ground projection, particularly in the form of guiding projections, stands out as the optimal choice.
Deployment of Machine Learning Model and Setup of the Device This study leverages achievements in machine learning technology to recog- nize tourists’ photo-taking actions. It is integrated with Arduino, Processing, and madmapper to construct a preliminary interactive device. Researchers
In-Depth Analysis Based on the Phenomenon of Pedestrians Entering the Scene 369
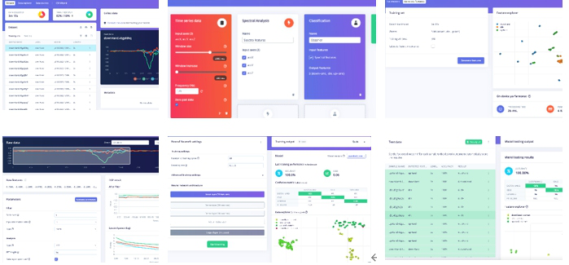
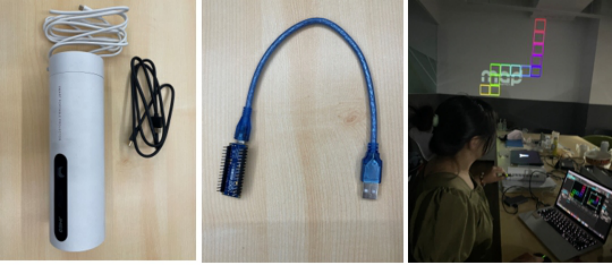
iteratively train the machine to identify photo-taking actions using the Edge Impulse platform. The process involves data collection, data preprocessing, feature extraction, model training, and model evaluation, resulting in the gen- eration of an “Arduino Library” file. This file is deployed onto the Arduino Nano 33 BLE Sense. The microcontroller receives action signals, relaying them to Processing. Processing reads key information and displays designed patterns, which are then projected onto the ground using the sython library and altered in size and perspective through madmapper. After projection completion, Arduino issues an audio prompt.
Figure 2: Parameters of the action recognition model trained by the edge pulse website.Figure 3: Equipment required for installation and completion of construction effect testing.
Feasibility Testing Experiment The completed interactive device is deployed in the field for a feasibility test. The aim is to assess the accuracy of research result data and the applicability of the interactive device.
Testing Process Location: Tianjin Eye Scenic Area| Time: 9:00 PM
370 Xie and Li
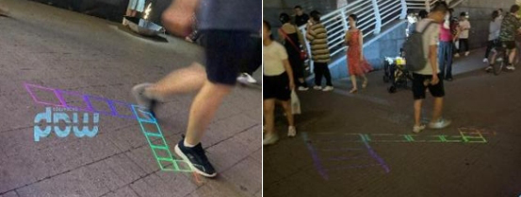
During the test, when researchers lift the photo-taking device to simu- late capturing a photo, the microcontroller receives the action signal and transmits it to Processing. Processing subsequently activates the projector for projection. The distance between the photographer and the subject ranges from 2.5m to 3m, and the projection position is 50cm-1m from the photog- rapher. This distance may vary slightly based on the photographer’s handheld phone angle. After projection completion, a 55-decibel prompt sound is emit- ted. Observers record the reactions of 50 pedestrians during the projection, specifically noting whether they became aware of someone taking a photo.
Figure 4: Experimental scenario and process of validation test.
Test Results The post-experiment data indicates that 82% of pedestrians noticed the pres- ence of the photographer. They chose to walk around the projected light effect, reducing both parties’ time and emotional expenditure. This outcome aligns with the anticipated effect predicted by the researchers.
CONCLUSION
This study aimed to explore the reasons behind pedestrians unintentionally entering the frame when tourists take photos in scenic areas. Using a com- bination of observational and interview methods, along with experimental design to analyze photo distances and interaction methods, the study suc- cessfully implemented an interactive device through machine learning and hardware integration. The feasibility test validated the research findings, contributing to an enhanced photography experience for tourists. Ethical considerations were prioritized during outdoor surveys, ensuring participant consent in interviews and adopting non-intrusive observation methods to avoid unnecessary disturbance.
LIMITATIONS AND FUTURE PERSPECTIVES Like any research, this study has its weaknesses and limitations, providing directions for future investigations. The reliance on scenario-based exper- iments, commonly used in travel literature, may introduce some method- ological constraints. Additionally, the study did not thoroughly consider the
In-Depth Analysis Based on the Phenomenon of Pedestrians Entering the Scene 371
impact of social influence on pedestrian behaviours, potentially introduc- ing errors in experimental data. The model-building technology employed by researchers is still evolving, with limited functionality and scope, prevent- ing a comprehensive validation of the efficacy of the interaction model. The feasibility test focused primarily on nighttime conditions, and future research should expand to explore the impact of sound cues during the day for further analysis and optimization. This would enable broader applications, such as in museums, providing more possibilities for both visitors and institutions (Hennes, 2002). Future studies could delve deeper into understanding the interplay between these factors and the occurrence of tourists taking pho- tos and pedestrians unintentionally entering the frame. Exploring a broader range of interactive methods could offer users a more novel and engaging experience.
ACKNOWLEDGMENT
Thanks all the team members who participated in the experimental data col- lection, as well as Yao Yuntao for his help and support in software technology and equipment for this project.
REFERENCES
Adel Nikjoo and Hamed Bakhshi, 2019. The presence of tourists and residents in shared travel photos. Tourism Management, 70, pp. 89–98. B. F. Skinner, 1966. What is the experimental analysis of behavior?. Journal of the
Experimental Analysis of Behavior, 5(9), pp. 213–218. Birgitta Berglund and Thomas Lindvall, 1995. Connunity Noise. Center for Sensory Research Stockholm. Fei D. and Junhua Z., 2009. The Survey Methods in Planning and Design 4—Action
Observation. Chinese Landscape Architecture, 2, pp. 55–57. Jacob C. Lee, Yuanyuan (Gina) Cui, Jungkeun Kim, Yuri Seo and Hyunji Chon„
2020. Photo Taking Paradox: Contrasting Effects of Photo Taking on Travel Satisfaction and Revisit Intention. Journal of Travel Research, 4, pp. 1–13. Jeremy S. Cohen, Julie M., Edmunds, Douglas M., Brodman, Courtney L., Benjamin and Philip C. Kendall, 2013. Using Self-Monitoring: Implementation of Collab- orative Empiricism in Cognitive-Behavioral Therapy. Cognitive and Behavioral Practice, 20, pp. 419–428. Jiahui Sun, Ge Liu, Jingyi Li and Tianli Zheng, 2020. Preliminary Study on Spatial and Temporal Distribution and Behavior of Tourists in Beihai Park in Winter. IOP Conference Series: Earth and Environmental Science, doi: 10.1088/1755-1315/621/1/012092. Philip L. Pearce and Zhe Wang, 2019. Human ethology and tourists’ photographic
poses. Annals of Tourism Research, 74, pp. 108–120. Qi D. 2004. Psychological and Educational Research Methods (Revised Edition).
Beijing Normal University Press, Beijing. Satu Elo and Helvi Kyngas, 2007. The qualitative content analysis process. Journal of Advanced Nursing, 62(1), pp. 107–115. Sid Kouider and Nathan Faivre, 2007. Conscious and Unconscious Perception.
pp. 551–561.
372 Xie and Li
Svetlana Stepchenkova and Fangzi Zhan, 2019. Visual destination images of Peru: Comparative content analysis of DMO and user-generated Photography. Tourism Management, 8, pp. 1–12. Tom Foulsham, Esther Walker and Alan Kingstone, 2010. The where, what and
when of gaze allocation in the lab and the natural environment. Vision Research, 12, pp. 1920–1931. Tom Hennes, 2002. Rethinking the Visitor Experience: Transforming Obstacle into Purpose. Curator, 4, pp. 105–117.
LISTED IN THE AHFE DIGITAL BOOKSTORE CATALOGUE
Explore the complete digital volume
Usability and User Experience
Read this individual research paper free through the original publisher, or explore the full digital proceedings book.
ISBN 978-1-964867-32-8
Explore this ISBN in the AHFE Bookstore ↗Listed in the July 2026 bookstore catalogue; search by ISBN to confirm current availability · Digital book purchase optional