Baris Cogan, Birgit Milius (2024). Train Driver Visual Performance: A Parametric Survival Model of Reaction Time. In: Advances in Human Factors of Transportation. AHFE Open Access, vol. 148, pp. 631–641. https://doi.org/10.54941/ahfe1005255
The implementation of Automatic Train Operation (ATO) systems is rapidly increasing in the railway industry, driven by the potential for improved efficiency, safety, and capacity. However, one of the key challenges in implementing ATO systems is defining the functional requirements of these automated systems. One approach for deriving these functional requirements is by evaluating human performance in the driving task.This study investigates the visual performance of train drivers under different conditions using a driving simulator. 18 active train drivers participated in the experimental study. The task of the participants in the simulator study was to drive a train and respond to stationary visual stimuli in the form of cubes at irregular intervals by pressing the signal horn. The study aimed to assess reaction times to objects under three different train protection systems: PZB (punktförmige Zugbeeinflussung, intermitted train protection system), ETCS (European Train Control System level 2 with cab signalling), and driving-on-sight. The square objects varied in size (90 cm and 180 cm) and color (brown and orange), creating a diverse range of scenarios for the drivers.Survival analysis, a statistical method used to analyze time-to-event data, was employed to evaluate the drivers’ performance. In this context, the ‘event’ was defined as the driver reacting to an object, and the ‘time’ was the reaction time. This method provided a detailed understanding of the distribution of reaction times and how they were influenced by the different driving conditions. The hazard function, which describes the instantaneous rate of occurrence of the event before its actual occurrence, was used to compare reaction times across different conditions. The results of the study revealed that object size, object contrast, and train speed had a significant effect on train drivers’ reaction time. Specifically, larger and more contrasting objects were associated with faster reaction times. Stimuli were detected more quickly at higher speeds, possibly due to the verticalization of gaze at increasing speeds and the objects visually enlarging more rapidly at higher speeds. Interestingly, the differences between train protection systems yielded complex results that warrant further investigation. Additionally, the probabilities that a driver had not yet reacted to an object by a certain time were estimated. It is important to note that although the study was conducted in a sophisticated simulation environment, it does not fully represent the real conditions of driving a train. Nevertheless, the study provides valuable findings into visual perception performance of train drivers. Furthermore, it demonstrates the utility of survival analysis in railway domain, particularly for analyzing reaction time data. The findings of this study have significant implications for the railway industry, particularly in the context of deriving functional requirements of ATO implementations. Understanding how human performance is influenced by operational and environmental factors can inform the design of safer and more efficient railway operations.
The implementation of Automatic Train Operation (ATO) systems is rapidly increasing in the railway sector, driven by its potential for improved efficiency, safety, and capacity. Automation levels, classified as Grades of Automation (GoA) in urban transit, have also gained traction in mainline railways (IEC, 2010). From GoA3 onwards, the responsibility for safe operation transitions from train drivers to the automation system. However, one of the key chal- lenges in implementing ATO systems is defining the functional requirements of these systems. One approach for deriving the functional requirements is by evaluating human performance in the driving task. This understanding serves as a basis for assessing the practical performance realistically achievable by technical systems.
Today, successful execution of tasks is dependent upon the efficient uti- lization of train drivers’ senses. Therefore, a comprehensive understanding of train drivers’ performance, with a specific focus on visual senses, becomes crucial. This study aimed to investigate the perceptual performance of train drivers across diverse driving conditions through the use of simulator exper- iments. The primary metric used to measure performance was the reaction time to visual stimuli. A hazard-based duration model (i.e. survival analysis)
was employed to examine the reaction time of train drivers under different conditions.
BACKGROUND
Considerable research has been dedicated to exploring the visual performance of car drivers. In the context of railways, there are several studies focused on the visual behavior of train drivers. The context of these studies includes the glance behavior of train drivers towards different elements of the visual scene (Luke et al., 2006) and the visual skills of urban train drivers (Naweed and Balakrishnan, 2013). A relatively smaller number of researchers have delved into quantified evaluation of the visual performance of train drivers under different conditions. These studies include examining the impact of variables such as train speed and background image complexity on driving performance and investigating the effects of the visual field of view on signal detection (Wada and Hataoka, 2020; Guo et al., 2015) Human visual performance is influenced by a multitude of factors. Key domains include the properties of the stimulus and the characteristics of the environment in which it is situated. It has been shown that reaction time decreases with an increase in the size or area of the stimulus (Bonnet et al., 1992). Visual perception is also sensitive to colour and bright- ness (Becker-Carus and Wendt, 2016). Performance of visual perception is impaired by poor lightning and visibility conditions (Schmidt-Clausen and Freiding, 2004). The allocation of attention between the driver’s cab and the outside area influences the detection probability of trackside hazards (Marinkos et al., 2005; Hely et al., 2015; Naghiyev et al., 2014). Higher driving speeds lead to the narrowing of the useful field of view (UFOV) (Rogé et al., 2004). In such conditions, perception of the stimulus could fail if it is not close to the centre of the field of view. Moreover, the study of Suzuki et al. (2019) showed that higher speeds were associated with more vertical and fewer horizontal gaze fixations, while lower speeds involved more hori- zontal gaze movements. This finding is in line with the results of a study of simulated car driving, in which higher driving speeds led to faster reactions to road signs (Cao and Wang, 2004).
Survival analysis is a probabilistic modeling approach for analyzing time- to-event data to model the probability distribution of the time until an event occurs (Kleinbaum and Klein, 2012). In a parametric survival model with accelerated failure time (AFT), the independent error term does not follow a normal distribution (George et al., 2014). Therefore, this approach could provide an effective method for analysing reaction time data. In the field of transportation research, examples of the application of a survival model include the time to occurrence of a vehicle accident and the time to adoption of new transportation technologies (Washington, 2020). There are several studies that apply parametric event time analysis with Accelerated Failure Time (AFT) to analyze the effects of covariates. Several studies have modeled car drivers’ reaction times to stimuli (e.g., pedestrians) with cell phone use as a distraction covariate (Haque and Washington, 2014; Choudhary and Velaga, 2017; Liu et al., 2021), while Pawar and Velaga (2020) investigated
Train Driver Visual Performance: A Parametric Survival Model of Reaction Time 633
the effect of time pressure on reaction times using event time analysis. In the railroad sector, event time analysis can be found mainly in the areas of preventive maintenance (Andersson et al., 2016).
METHOD
Materials, study design and analysis methodology are explained in this chapter.
Study Design The objective of the simulator experiments was to assess the visual percep- tion of train drivers during a ride under various conditions. Visual perceptual performance was defined as the reaction time to visual stimulus. The task in the experiment was to drive a train and respond to stationary visual stim- uli in the form of cubes at irregular intervals by pressing the signal horn. Stimuli appeared at an approximate distance of 800 m from the train. The study was carried out in a driving simulator of the Department of Rail Oper- ations and Infrastructure at the Technical University of Berlin (TUB). Stimuli appeared right next to the track with a maximum 3-meter distance to the track center. Two different train protection systems were used: PZB (punk- tförmige Zugbeeinflussung, intermitted train protection system) and ETCS (European Train Control System level 2 with cab signalling). As a third condi- tion, driving-on-sight was introduced. On-sight driving refers to the scenario where train drivers are solely responsible for the safety of the train without any technical safety barriers. During on-sight driving, train drivers can select their driving speed, with the maximum allowed speed of 40 km/h. Eight stim- uli were placed along the 31,5 km long PZB line. The ETCS route (50 km) included five stimuli. The difference in the number of stimuli between the sce- narios was caused by the constraints of the simulator setup. The travel times in the PZB and ETCS scenarios were around 25–30 minutes. The On-sight route was shorter (6 km, approx. 10–15 minutes) and comprised four stimuli of different size and contrast. Participants were directed to react as soon as possible to the identified objects, without consideration whether the object posed a potential threat. This approach enabled participants to concentrate exclusively on their sensory capabilities.
Study Variables Various influencing factors were selected as independent variables to be manipulated within the simulator environment. The size of the stimuli and the contrast to the background are two physical characteristics that were cho- sen as independent variables. Cubes with the edge length of 180 cm and 90 cm were chosen as the stimuli size, which are roughly the length of an adult and a child. For the high-contrast condition, a bright orange color, the hue of safety vests (HEX Code #f18e2a), was used. The low-contrast condition was approximately half the color contrast of the high-contrast condition, resulting in a brown hue (HEX code #9d6830). The operational parameters that were manipulated were the train protection system (PZB, ETCS in-cab signalling and driving on sight) and the train speed (40 km/h, 100 km/h and 160 km/h)
634 Cogan and Milius
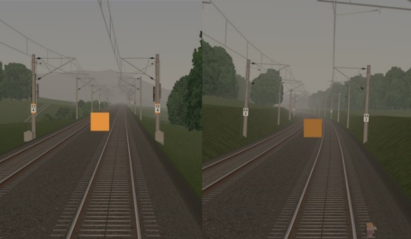
at the time of the object appearance. The stimuli appeared at 160 km/h only in the ETCS scenario. Both the ETCS and PZB lines included the 100 km/h speed level. The stimuli also appeared at 40 km/h in PZB line. Figure 1 shows a caption from the simulator environment with a high contrast and a low contrast object. Dependent variable, reaction time, was measured as the dura- tion from the appearance of the stimulus at a distance of approximately 800 meters until the detection of the stimulus. Activating (i.e. pushing or pulling) the train horn was employed by the train drivers to confirm object detection. This action is a similar behavior to the one expected in real world operations after detecting an object near the track.
Figure 1: Screenshots from the simulator environment.
Participants 18 active train drivers participated in the simulator study. The age of the participants ranged from 22 to 57 years old (mean = 33,4). Their professional experience range from 1 to 28 years (mean = 7,3). Participants rated their familiarity with different types of train safety systems on a scale from one (not familiar at all) to ten (very familiar). The level of familiarity with the PZB system received an average rating of 8,3, while the ETCS system averaged at 2,2.
Data Analysis First, a descriptive analysis was conducted to summarize the data in terms of mean and standard deviation values. A Weibull-AFT model was used to examine the relationship between reaction time and the explanatory vari- ables. In the model, the event is defined as the detection of the object by the drivers. Duration is defined as the time taken for participants to react to the objects. The model was fitted to the dataset using the flexsurv packages in R (R Core Team, 2023; Jackson, 2016). In the AFT model, the effects of covariates are modeled directly on the survival function, which eases the inter- pretation of results and provides better results when more than one covariate is present (George et al., 2014; Choudhary and Velaga, 2017). For a para- metric AFT model, the type of distribution for the duration variable is also required. The Weibull distribution allows for changes in the probability of an event occurring over time (Kleinbaum and Klein, 2012). Positive duration
Train Driver Visual Performance: A Parametric Survival Model of Reaction Time 635
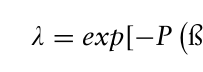
dependence means that the probability of the event increases over time (P>1). Density function of the Weibull model, where λ and P are the location and shape parameters of the Weibull distribution, is as follows:
Equation reproduced from the original PDF.
H (t) = (λP)(λt)P−1 and S (t) = exp[−(λt)P] The influence of covariates on survival time can be formulated, where X is a covariate within the vector of covariates (Xi) and ß0−n represents the coefficients:
Equation reproduced from the original PDF.
]
ß0 + ß1X0 + . . .
Censored data refer to observations in which the event of interest (i.e. object detection) has not yet occurred or could not be fully observed within the study period (Kleinbaum and Klein, 2012). Such censored survival times underestimate the true time to the event (Clark et al., 2003). Due to the exper- imental design, the detection of each object by the participants were recorded. Without censored data, complete information on the occurrence of events is available for all participants. Therefore, the data provide more information about the shape of the distribution (Klein and Moeschberger, 2003).
RESULTS
Following sections present the results of the analysis conducted in the study.
Descriptive Statistics Collected data was preprocessed for completeness. The interquartile range (IQR) of the actual speeds was calculated to ensure the train speed at the time of object appearance was in the predetermined speed-level. If the actual speed deviated from the corresponding speed category by more than three times the IQR, these data points were excluded from the analysis (five cases). A total of 287 observations were available after data preprocessing. Table 1 shows the geometric mean and standard deviation of reaction times for each com- bination. An examination using survival analysis was conducted to establish causal relationships.
Table 1. Descriptive statistics of the collected data. Geometric means and standard deviations (in parenthesis).
Table available in the original PDF paper.
40 km/h (OS & PZB) 100 km/h (PZB & ETCS) 160 km/h (ETCS) High contrast Large 6,35 (2,59) High contrast Large 5,99 (1,38) Small 9,92 (1,89) Small 5,79 (2,87) Low contrast Large 7,25 (4,21) Low contrast
Large 6,80 (1,53) Small 13,44 (1,66) Small 8,07 (1,32) High contrast Large 7,02 (1,67) High contrast Small 5,17 (2,07) High contrast Small 4,60 (1,30) Small 10,80 (1,74) Large 3,41 (1,34) Low contrast Large 8,51 (1,60) Low contrast
Small 4,78 (1,70) Small 11,05 (2,77) Small 6,74 (3,24)
Low contrast
636 Cogan and Milius
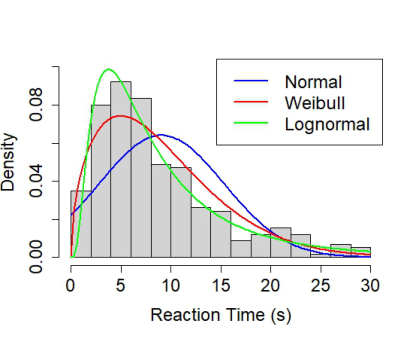
Distribution of Reaction Time Data The comparison of models with different distributions should inform the decision which type of parametric distribution to use (George et al., 2014). Therefore, a comparison of model fit parameters using Weibull, Normal and Log-normal distributions was conducted. The Weibull distribution has the highest log-likelihood, suggesting that based on this criterion the Weibull dis- tribution might be the most suitable for describing the data. Both Akaike’s Information Criterion (AIC) and Bayesian Information Criterion (BIC) are lower for the Weibull distribution, reinforcing the choice of the Weibull. The scale and location parameters of the fitted distribution is 1,52 and 10,07, respectively. The fitting curves of the distributions are shown in Figure 2.
Table 2. Goodness-of-fit statistics for three different distributions.
Table available in the original PDF paper.
Distribution Log-Likelihood AIC BIC Normal -931,9 1867,8 1875,1 Weibull -884,3 1772,6 1779,9 Lognormal -897,9 1799,9 1807,3
Figure 2: Histogram of the reaction times and the fitting curves of three diffent distributions.
Parametric Survival Model Model parameters are listed in Table 3. The estimated shape parameter (P) for the Weibull distribution is 1.85, indicating that the probability of the event increases with time. The scale parameter reflects the time scale of the survival outcome and indicates the time at which the event is most likely to occur. The difference in the log-likelihoods and the significant p-value of the chi-square test indicate that the model with covariates fits the data better than the model with the intercept only.
Train Driver Visual Performance: A Parametric Survival Model of Reaction Time 637
Table 3. Model parameters of the survival analysis.
Size_90 cm* 0,40 0,26 0,55 0,07 1,49 Speed_ 40 km/h* 0,36 0,17 0,54 0,09 1,43 Speed_ 160 km/h* -0,37 -0,60 -0,14 0,12 0,69 Contrast_low* 0,20 0,07 0,32 0,07 1,22 On-sight 0,13 -0,06 0,32 0,10 1,14 ETCS -0,24 -0,45 0,04 0,11 0,79 Goodness-of-fit statistics Est.: Estimated coefficients. 95% CI (L) and 95% CI (H): Lower and higher bound of the confidence intervals. SE: Standard error. Exp (Est.): Exponentiated coefficients. Number of observations: 287. The reference level of the model: PZB, 100 km/h, 180 cm cube, high contrast.
Three variables significantly influence driver reaction times. These are object size, contrast between object and its background and driving speed. Confidence intervals of the estimates for the train control system variable include the value of zero for both On-sight and ETCS L2 levels. There- fore, the train control system variable did not reach statistical significance. The estimates indicate the log time ratios, while the exponentiated estimates represent the acceleration factor. The negative estimates indicate a decrease in reaction times compared to the reference level. Exponentiated estimates indicate the multiplicative change compared to the base level. For exam- ple, estimated log-time ratio to detect the stimulus for one unit of change in object size was 0,40. The acceleration factor, exp(0,40), is 1,49. It means that with the decrease of stimulus size from 180 cm to 90 cm, the stimulus is detected 49% slower, adjusted for speed, contrast and train control vari- ables. Using the same approach, object detection at the speed of 40 km/h led to 43% longer reaction times compared to the reaction at 100 km/h. Similarly, increase in speed from 100 km/h to 160 km/h led to a decrease in reaction times by 31%. Objects with lower contrasts were associated with 22% slower reactions.
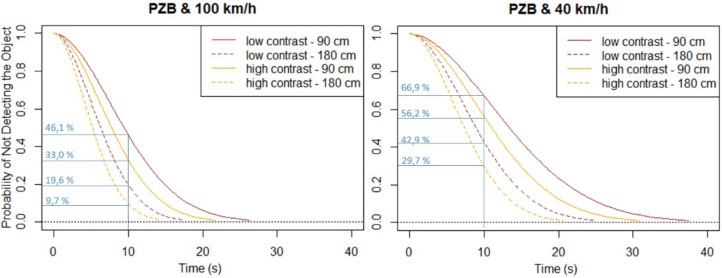
Hazard and survival functions can be used to calculate probabilities for certain conditions. For example, at time-point t=10 seconds, the probability that the large object will not be detected in the PZB scenario under the base conditions (S5| pzb) is approx. 9,7% (Figure 4). In order to calculate the probability value of the small object in the same condition, the variable Xsize takes the value of 1, while all other variables remain at their mean values or base levels. The results indicate a 33% probability that the small object is not detected after 10 seconds of the appearance of the object. The probability curves of the conditions in the PZB scenario and the probability values at t = 10 seconds are given in the Figure 3.
638 Cogan and Milius
Figure 3: Survival probabilities (i.e. probability of not detecting the object) in PZB scenario at 100 km/h and 40 km/h.
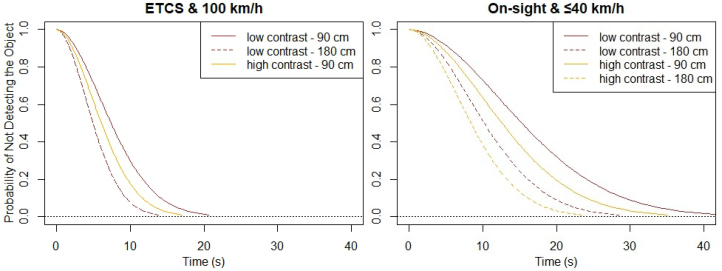
Comparison of PZB and on-sight driving at 40 km/h shows relatively sim- ilar survival curves. On the other hand, the probabilities of failure to detect the objects at 100 km/h in the ETCS scenario are considerably lower than either of the scenarios at 40 km/h (Figure 4). This could suggest that the vari- ations observed among train control systems may be attributed to differences in speeds rather than differences in the train protection systems.
Figure 4: Survival probabilities in ETCS at 100 km/h and in on-sight-driving at 40 km/h.
DISCUSSION
The probability of failing to detect the small object was significantly larger than the probability of failing to detect large objects. Similarly, higher con- trast between the object and its background increased the probability of its detection. This is in line with the widely acknowledged concept that stimulus intensity, such as size and the differences in brightness or color between the object and its background, influences reaction time. The present study found that this effect is a significant factor that increases the probability to detect objects near tracks, regardless of the train control system used. Increasing driving speed was also a significant factor that increases the probability of
Train Driver Visual Performance: A Parametric Survival Model of Reaction Time 639
the object being detected. These results could support the assumptions on the verticalization of gaze at faster speeds. It should also be noted that objects become optically larger more rapidly at higher speeds and are recognized more quickly. On the other hand, the findings on the relationship between different train control systems were inconclusive. Unlike the previous find- ings of varied allocation of visual attention when driving with different train control systems, the findings of the study did not indicate any significant differences. One potential reason for this is the differences in track geome- try between ETCS and PZB routes. Another reason could be the unbalanced design of ETCS scenario in the experiments, which prevented the thorough examination of all combinations of factors.
Train driving is a highly complex task and the visual monitoring of the area along the tracks is influenced by a complicated interplay of factors, not all of which could be taken into account in the study. The simulated driving often differs greatly from the real driving situation due to numerous limita- tions of the virtual environment. Another limitation is that participants were instructed to react to objects that they detect. The potential effects of expecta- tion on visual perception as well as decision making regarding the perceived risk posed by objects were not taken into account. Because the study involved a relatively short driving duration compared to actual operation conditions, the adverse effects due to fatigue or diminished vigilance were limited.
CONCLUSION
The study provides valuable findings into visual perception performance of train drivers. The results of the study revealed that object size, object con- trast, and train speed had a significant effect on train drivers’ reaction times. Specifically, larger and more contrasting objects were associated with faster reaction times. Stimuli were detected more quickly at higher speeds. How- ever, the findings on the link between different train control systems were inconclusive. The study demonstrates the application of parametric survival analysis for analyzing reaction time data in the train driving domain. The findings of this study have significant implications for the railway indus- try, particularly in the context of deriving functional requirements of ATO implementations. The complex relationship between reaction time and train protection systems and other underlying factors needs to be further investi- gated in future research. Future studies could also investigate how additional train driving tasks, such as communicating with the dispatchers or reading other instruments, influences visual perception performance.
REFERENCES
Andersson, M., Björklund, G. and Haraldsson, M. (2016), “Marginal railway track renewal costs: A survival data approach”, Transportation Research Part A: Policy and Practice, Vol. 87, pp. 68–77. Becker-Carus, C. and Wendt, M. (2016), Allgemeine Psychologie: Eine Einführung,
Springer, Berlin.
640 Cogan and Milius
Bonnet, C., Gurlekian, J. and Harris, P. (1992), “Reaction time and visual area: Searching for the determinants”, Bulletin of the Psychonomic Society, Vol. 30, No. 5, pp. 396–398. Cao, Y. and Wang, J.-H. (2004), “A Driving Simulation Based Study on the
Effects of Road Marking Luminance Contrast on Driving Safety”, in Institute of Transportation Engineers, District 1 Annual Meeting, Burlington, Vermont. Choudhary, P. and Velaga, N. R. (2017), “Modelling driver distraction effects due to mobile phone use on reaction time”, Transportation Research Part C: Emerging Technologies, Vol. 77, pp. 351–365. Clark, T. G., Bradburn, M. J., Love, S. B. and Altman, D. G. (2003), “Survival analysis
part I: basic concepts and first analyses”, British Journal of Cancer, Vol. 89, No. 2, pp. 232–238. George, B., Seals, S. and Aban, I. (2014), “Survival analysis and regression models”, Journal of nuclear cardiology official publication of the American Society of Nuclear Cardiology, Vol. 21, No. 4, pp. 686–694. Guo, B., Mao, Y., Hedge, A. and Fang, W. (2015), “Effects of apparent image veloc-
ity and complexity on the dynamic visual field using a high-speed train driving simulator”, International Journal of Industrial Ergonomics, Vol. 48, pp. 99–109. Haque, M. M. and Washington, S. (2014), “A parametric duration model of the reaction times of drivers distracted by mobile phone conversations”, Accident; analysis and prevention, Vol. 62, pp. 42–53. Hely, M., Shardlow, T., Butt, B., Friswell, R., McIntosh, A. and Williamson, A.
(2015), “Effects of automatic train protection on human factors and driving behaviour”, in Proceedings 19th Triennial Congress of the IEA, Citeseer, p. 14. IEC (2010), Bahnanwendungen - Automatischer städtischer schienengebundener Personennahverkehr (AUGT) Sicherheitsanforderungen No. DIN 62267. Jackson, C. H. (2016), “flexsurv: A Platform for Parametric Survival Modeling in
R”, Journal of statistical software, Vol. 70. Klein, J.P.and Moeschberger, M.L.(2003), Survival analysis: techniques for censored and truncated data, Springer. Kleinbaum, D. G. and Klein, M. (2012), Survival analysis: A self-learning text,
Statistics for biology and health, 3rd ed., Springer, New York, NY. Liu, Y., Alsaleh, R. and Sayed, T. (2021), “Modeling the influence of mobile phone use distraction on pedestrian reaction times to green signals: A multilevel mixed-effects parametric survival model”, Transportation Research Part F: Traffic Psychology and Behaviour, Vol. 81, pp. 115–129. Luke, T., Brook-Carter, N., Parkes, A. M., Grimes, E. and Mills, A. (2006), “An
investigation of train driver visual strategies”, Cognition, Technology & Work, Vol. 8, No. 1, pp. 15–29. Marinkos, H., Sheridan, T. and Multer, J. (2005), Effects of Supervisory Train Control Technology on Operator Attention, available at: https://rosap.ntl.bts.gov/vi ew/dot/23186. Naghiyev, A., Sharples, S., Carey, M., Coplestone, A. and Ryan, B. (2014), “ERTMS
train driving-incab vs. outside: an explorative eye-tracking field study”, in Con- temporary Ergonomics and Human Factors 2014: Proceedings of the Interna- tional Conference on Ergonomics & Human Factors 2014, Southampton, UK, 7–10 April 2014, CRC Press Boca Raton, FL, p. 343. Pawar, N. M. and Velaga, N. R. (2020), “Modelling the influence of time pressure on reaction time of drivers”, Transportation Research Part F: Traffic Psychology and Behaviour, Vol. 72, pp. 1–22.
Train Driver Visual Performance: A Parametric Survival Model of Reaction Time 641
R Core Team (2023), R: A Language and Environment for Statistical Computing, R Foundation for Statistical Computing, Vienna, Austria. Rogé, J., Pébayle, T., Lambilliotte, E., Spitzenstetter, F., Giselbrecht, D. and Muzet,
A. (2004), “Influence of age, speed and duration of monotonous driving task in traffic on the driver’s useful visual field”, Vision Research, Vol. 44, No. 23, pp. 2737–2744. Schmidt-Clausen, H.-J. and Freiding, A. (2004), Sehvermögen von Kraftfahrern und Lichtbedingungen im nächtlichen Straßenverkehr, Mensch und Sicherheit. Suzuki, D., Yamauchi, K. and Matsuura, S. (2019), “Effective Visual Behavior of
Railway Drivers for Recognition of Extraordinary Events”, Quarterly Report of RTRI, Vol. 60, No. 4, pp. 286–291. Wada, K. and Hataoka, M. (2020), “Effects of the angle between objects of gaze and a visual target when driving a train”, Japanese Journal of Applied Psychology, Vol. 46, No. SpecialEdition, pp. 19–28. Washington, S. (2020), Statistical and Econometric Methods for Transportation Data
Read this individual research paper free through the original publisher, or explore the full digital proceedings book.
ISBN 978-1-964867-24-3
Explore this ISBN in the AHFE Bookstore ↗Listed in the July 2026 bookstore catalogue; search by ISBN to confirm current availability · Digital book purchase optional