Xinlei Zhao, Gail Hopkins (2024). Designing a User-Centred Team Role Testing APP: Revealing Team Dynamics Through Visual Analysis. In: Human Interaction and Emerging Technologies (IHIET-AI 2024): Artificial Intelligence and Future Applications. AHFE Open Access, vol. 120, pp. 446–457. https://doi.org/10.54941/ahfe1004596
In today's fast-paced work environment, teamwork is considered to be one of the most effective ways of working. Teams facilitate cross-functional collaboration by assembling members with diverse backgrounds and areas of expertise. Nonetheless, the calibre of teamwork is contingent not solely upon the individual competencies of specific team members but also upon how well the roles and skills of each member are coordinated and balanced within the team. The allocation of roles within a team exerts a profound influence on the team's overall performance, and unfair or ineffective distribution principles can lead to significantly lower team performance in practice. Hence, in practical team collaboration, the equitable allocation of roles within the team is a challenging issue. The primary aim of this study is to design a visual tool to foster the establishment of an appropriately skills-balanced team while facilitating team members' comprehension of team dynamics.Following a comprehensive review of team working and team role allocation practices we proposed Belbin team roles as the theoretical underpinning for the tool’s team role equilibrium processes. We employed a qualitative methodology to gather user requirements, undertaking unstructured interviews with ten individuals experienced in collaborative working. Detailed user requirements were gathered from this data and an interactive prototype was designed using Axure. The prototype was designed to analyse users’ personality types with respect to Belbin team roles and use this information to allow the optimum allocation of members to teams for a proposed project. The tool also allows the make-up of the team to be visualized using a range of graphics which present the outcomes of team assessments and offer developmental recommendations tailored to the specific industry of the team.The tool was evaluated using a combination of the User Experience Questionnaire (UEQ) and semi-structured interviews. Two rounds of evaluation were conducted, using a further 10 individuals; five were non-industry users and five were industry experts. After each iteration the prototype design was refined.The design underscores the significance of product design and iterative processes grounded in user requirements within the realm of mobile application design. Such insights may hold substantial implications for teams across diverse industries and work environments, particularly concerning the equilibrium of team roles and the dynamics within teams in the future.
Teamwork can offer increased power and flexibility in dynamic work envi- ronments (Khawam et al., 2017). An optimal team needs an appropriate balance of roles and skills (Vishnubhotla et al., 2018) and an inappropriate balance can negatively impact performance and the organisation as a whole (Zhu et al., 2016). However, building such a team can be difficult (van den Hout et al., 2018) This aim of this work was to design a tool for equitable assignment of team roles. This paper describes the design of an app for testing and recommending team composition.
Designing a User-Centred Team Role Testing App: Revealing Team Dynamics 447
LITERATURE REVIEW
Team composition and performance has been the subject of research over many years (Mathieu et al., 2014). Contributing factors to team performance have been studied (e.g. Hastings et al., 2018; Ruch et al., 2018) and vari- ous approaches have been taken to propose optimal team compositions (e.g. Monslaves et al., 2023; Filippo et al., 2023). An overriding body of research has focused on personality as a key factor influencing team performance (Ahmad et al., 2018).
One of the most widely accepted and studied personality theories in psy- chology is the Five-Factor Model (FFM) (Soto, 2020) which proposes five fundamental, relatively stable, dimensions or traits of personality. There have been debates over the years as to the use of the FFM in personnel selection and understanding and enhancing team dynamics (Seibert and DeGeest, 2017) as its purpose is for understanding personalities and traits, but not team member allocation.
The widely-used MBTI (Myers-Briggs Type Indicator) measures the extent to which an individual prefers to operate within four dichotomous pairs of psychological functions and uses this to classify individuals into one of 16 personality types (Furnham, 2020). It is typically used to help personal devel- opment, communication and conflict management (Randall et al., 2017). Whilst it does not offer explicit directives for team role assignment, it does help team members to gain a deeper understanding of each other’s dispar- ities and behavioural patterns, thereby nurturing enhanced interpersonal relationships and teamwork (Al Salman and Hassan, 2016).
The Belbin Team Roles assessment focuses on behaviours of individuals and how they naturally fit into one or more “team roles”. The theory pro- poses that combinations of these roles can lead to the success or failure of a team (Belbin and Brown, 2022). It is one of the most used methods for profiling and categorising team members in professional settings (Mon- salves et al., 2023). Belbin’s theory defines nine team roles, stating that a high-achieving team needs an equilibrium of these roles among its members (Belbin and Brown, 2022). The Belbin Team-Role Self-Perception Inventory (BTRSPI) (Belbin, 2014) enables team members to evaluate the roles they are inclined towards, allowing them to understand their strengths, weaknesses and prospective contributions within a team.
Tools focusing on examining skills and competencies to aid team compo- sition have been developed (e.g., Vishnubhotla et al., 2018; Hastings et al., 2018; Filippo et al., 2023). However these tools have not given much focus to the presentation of information to teams or individuals. We argue that there is a need for tools that provide both the analysis of skills and traits for effective team composition and present these recommendations visually to aid the understanding of why such skill combinations are needed. This paper presents a user-centred design of such a tool.
448 Zhao and Hopkins
METHODOLOGY
An overview of the methodology can be seen in Figure 1. Purposeful sam- pling was used to select 10 users with teamwork experience. Require- ments were gathered from users through semi-structured interviews lasting 20–30 minutes. The interviews aimed to understand users’ views and expec- tations of team role testing products. The interview guide asked about similar product use experience, expectations for future product features, and expectations for team role test results.
Figure 1: Methodology outline.
Figure available in the original PDF paper.
A low-fidelity interactive prototype was created using Axure. The proto- type incorporated a testing interface asking users to rate different statements from the BTRSPI on a scale of zero to ten. It then offered a range of visu- alisations to present team dynamics. The prototype was tested with five non-industry-based users. Modifications to the prototype were made follow- ing this to create a high fidelity prototype which was then tested with five industry experts.
Initial testing used the User Experience Questionnaire (UEQ) (Laugwitz et al., 2008) to provide a comparison against industry benchmark standards. The UEQ aims to capture practicality and hedonic aspects of user experience by combining measures of usability and emotional response (Schrepp et al., 2017). It consists of a set of standardised questions to evaluate user expe- rience from six different dimensions: Attractiveness, Perspicuity, Efficiency, Dependability, Stimulation and Novelty. Participants were asked to complete the UEQ after interacting with the prototype. Data processing tools provided by the UEQ official website were used to calculate the average score for each dimension (Schrepp, 2023).
Semi-structured interviews were then carried out with each user ask- ing about their experience of using the prototype to identify potential improvements.
REQUIREMENTS In the interviews users acknowledged the importance of team role testing in task assignment in order to understand strengths and weaknesses, anticipate potential conflicts and find compatible matches. Users noted that this could also help with initial unfamiliarity with fellow team members and the major- ity believed the test to be more beneficial for start-up teams than for mature teams, something which researchers have considered (Bednár and Ljudvi- dová, 2020). Some participants expressed scepticism over the accuracy of the test results and whether they would result in improved team performance.
Designing a User-Centred Team Role Testing App: Revealing Team Dynamics 449
When asked about their expectations of features, a few of the participants described both positive and negative prior experiences with similar products. Some mentioned cumbersome team role testing websites with poor learnabil- ity and others noted struggling with results containing large amounts of text and no keywords. Concerns were voiced about products’ privacy features and users expressed a desire for a product with distinct permissions for each role.
Participants commented on the form of charts and graphs that might be placed in the test results based on the researcher’s description. Most of the participants had high expectations for the visualisation of charts in the test results, and felt that various forms of graphical data would make it more convincing and engaging to use the product than a single textual description. There was a strong preference for personalised results with advice tailored to specific sectors and without excessively formal or broad advice in the report.
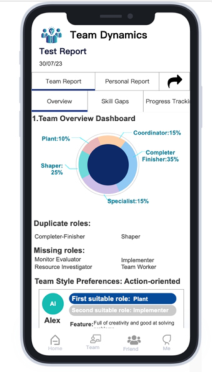
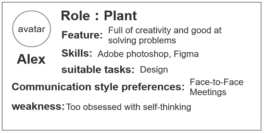
Participants favoured a team overview dashboard showing team personal- ity trait distribution, highlighting team excellence or need for improvement and showing overlaps or absence of roles. However several felt this would be more important for team leaders and personnel departments, as it would allow macro-level team analytics to inform training or recruitment. Key infor- mation on overall team style, highlights and skill deficits was wanted and, for each team member, their role, skill set and communication preferences.
The researcher proposed a skills analysis chart to enable a comparison of team skills against those required in industry. Some participants questioned the source and reliability of the industry standard data and most did not want to display the skills gap between individual and industry-standard team skills for privacy reasons. Some suggested visibility of this could be toggled for certain users.
Participants were asked about a progress tracking chart and display of historical data to show a team’s development trend or highlight areas for improvement. Most participants felt that visualisation of a team’s develop- ment would motivate progression and help managers quickly make changes to adjust team dynamics. Some said they would additionally like individual milestones for team members.
Considering individual reports with personal skills overview charts, par- ticipants emphasised the importance of specific, clear and explicit metrics. Most were happy for this chart to be public to other members, stating that it would help in understanding other team members’ skills, thus aiding team- work. However some were not keen for this publicity, stating they would feel more pressure to perform.
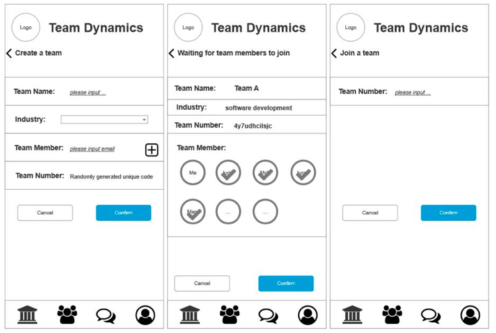
PROTOTYPE DESIGN The initial low-fidelity prototype (Figure 2) was evaluated with non-industry users and subsequently refined to produce a final high-fidelity prototype (Figures 3-6).
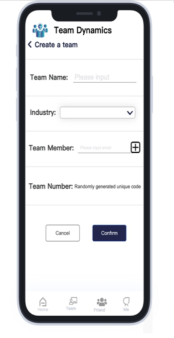
Figure 3 shows the creation of a team and the team role testing screens. After completing the BTRSPI, users are given a team report (Figures 4 and 5).
450 Zhao and Hopkins
Figure 2: Low-fidelity prototype.Figure 3: Initial team creation and testing.Figure 4: Team overview dashboard and test report.
Designing a User-Centred Team Role Testing App: Revealing Team Dynamics 451
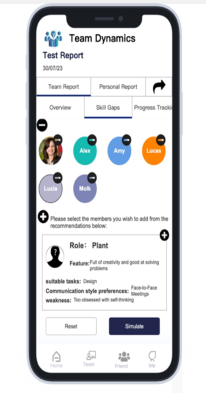
The team report provides visualisations of team composition (role distri- bution and characteristics of each role) and skills gaps (Figure 5). The skills gap analysis in Figure 5 uses a radar chart to show the gaps in skills between the current team and industry standard teams with the ability to simulate the dynamics by deleting or adding a virtual member to the team.
Figure 5: Team role analysis and skills gap chart.
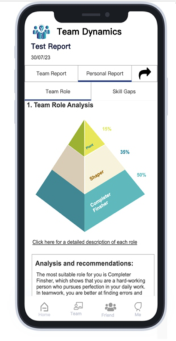
A user also has access to an individual report. The first chart in Figure 6 (left) shows the team role analysis and the second chart (right) shows the skills gap between the user and industry standard teams. A toggle allows the user to choose whether to make this chart visible to the rest of the team.
Figure 6: Individual report.
452 Zhao and Hopkins
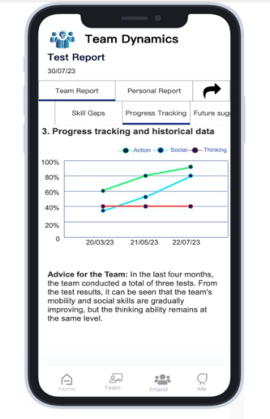
Figure 7 (left) shows progress tracking and historical data. This screen becomes available once a team has conducted at least two team role tests over a period of time and enables the team to understand the overall phased changes in order to adjust subsequent teamwork. The last part of the team report shown in Figure 7 (right) is a textual summary and analysis of the team’s overall test results, and proposes team recommendations based on the industry to which the team belongs.
Figure 7: Team test report progress tracking and forecast.
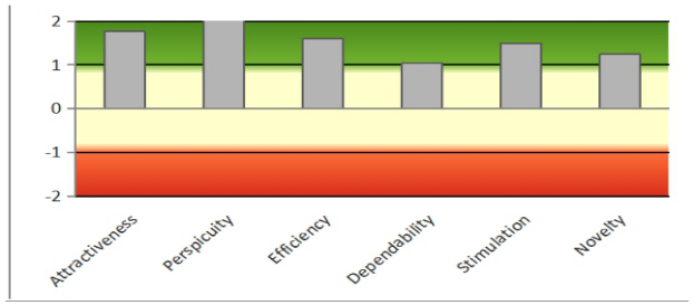
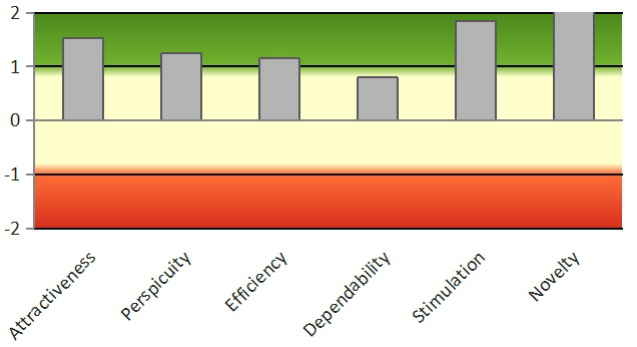
EVALUATION A group of five non-industry participants were used to evaluate the low fidelity prototype (see Figure 2). The initial UEQ evaluation results are shown in Figure 8.
Figure 8: Average UEQ values for low-fidelity prototype: non-industry users.
Designing a User-Centred Team Role Testing App: Revealing Team Dynamics 453
UEQ values between 0.8 and −0.8 represent neutral opinions for the corresponding scale (Schrepp et al., 2017); values greater than 0.8 repre- sent positive opinions, and values less than 0.8 represent negative opinions. Figure 8 shows the mean values of the six dimensions as rated by the non- industry participants. All the scales are within the green range (above 1), indicating positive responses, with the best score being perspicuity and the lowest dependability. Figure 9 shows these figures compared with industry standards.
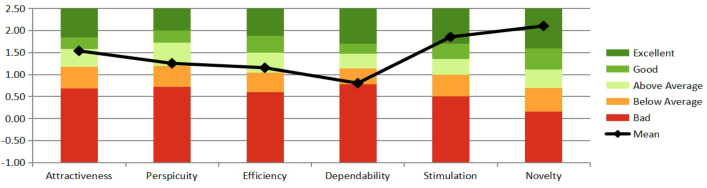
Figure 9: UEQ benchmark comparison for low-fidelity prototype: non-industry users.
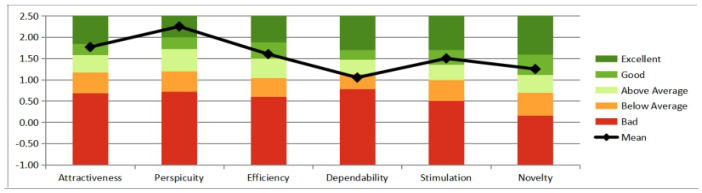
Figure 9 shows the user experience for all scales except dependability were within the “above average” or “good” range when compared with the benchmark dataset.
In the subsequent semi-structured interviews, the researcher asked partic- ipants questions to ascertain why dependability scores were low. Answers consistently showed that this was due to a degree of doubt about the results output by the test scale, something which was also raised in the requirements gathering. A few participants stated that relying solely on the outcomes of the BTRSPI might present certain constraints when identifying roles and allocat- ing tasks within the team, because effectiveness and accomplishment rely on many variables, including task complexity and scale. The origins and accu- racy of the industry-standard data used to produce the skills gap chart were also queried.
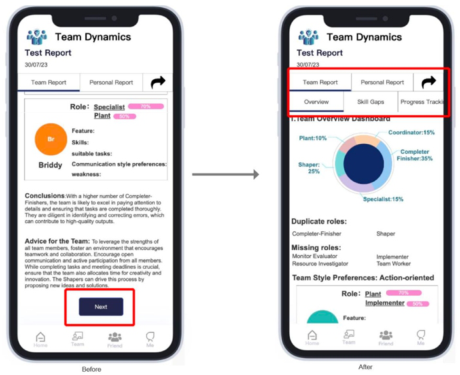
Additional concerns were raised about the ambiguity of some of the icons in the navigation bar. Participants also asked for clarification of the Bel- bin Role Test prior to completing the questions and multiple participants suggested that the individual role cards for each team member in the Team Overview Dashboard should not be restricted to showing just one Belbin type for the user. Participants suggested that 2–3 roles should ideally be shown, determined by the distribution of roles from the test results and as shown in the pyramid diagram. This would allow for tasks to be more suitably assigned to others when a primary role was missing from the team.
Refinements based on these comments were incorporated into the high fidelity prototype (Figure 10) and a description on the Belbin Test was added (Figure 3).
A group of five industry (expert) users evaluated the high fidelity proto- type using the UEQ. Figure 11 shows that the experts identified the design as highly innovative. However, dependability still received the lowest rating.
454 Zhao and Hopkins
Figure 10: Navigation menu and individual role card before (left) and after (right) initial user evaluation.Figure 11: Average UEQ values for high-fidelity prototype: expert users.
Figure 12 shows the user experience compared with the benchmark dataset again showing below average dependability which could lead to user dissatisfaction and undermine trust in the application.
Figure 12: UEQ benchmark comparison for high-fidelity prototype: expert users.
Factors impacting dependability were uncovered in the interviews. Most experts cited concerns around permissions for different users; some queried the ability of a user to choose to retest themselves, feeling that this should be restricted to team managers removing the risk of private retesting, altering the overall team results.
Designing a User-Centred Team Role Testing App: Revealing Team Dynamics 455
Figure 13: Prototype refinement following expert user evaluation.
The incorporation of multiple visual charts within the test report was praised for enhancing readability and the “simulator” feature in the skills gap chart emerged as the most favoured design element. Participants consid- ered this a novel feature which they would use frequently. However, experts queried the provision of a “next” button stating it implied a hierarchical relationship between charts. The prototype was consequently improved to include tabbed screens (see Figure 13).
DISCUSSION AND CONCLUSION Presenting team role imbalance in a meaningful way to team members is an important but challenging problem. The app design provides customised suggestions for team composition based on team industry and current com- position and enables the simulation of team skills with membership changes. These visual features were highly valued by the expert user group. Industry challenges often cite problems with understanding the skills and knowledge that exist within teams (Eppler and Sukowski, 2000) but existing tools do not incorporate such visuals.
The visualisations further enable team members to understand and take on different roles, promoting skill development and improving team per- formance. Team leaders can assign roles more appropriately, allowing more efficient task distribution and better utilisation of team members’ strengths.
Customisation based on both a team’s situation and industry standards, whilst being potentially powerful, could be technically challenging and use of AI could enable this, as others have considered (e.g. Ahmad et al., 2018). However, this requires additional care as automating team formation can be a sensitive topic amongst teams (Jahanbakhsh et al., 2017).
456 Zhao and Hopkins
Varying user permissions for different users was raised in both the require- ments gathering and evaluation phases. Personal privacy was also considered important in relation to the visibility of personal test results. The two aspects are, to an extent, related as visibility of test results could be a function of leadership hierarchy. The question is whether such visibility should be cus- tomisable so that teams can choose whether team members’ tests are, by default, visible to their team leader, to all team leaders, to the team as a whole or whether they should be entirely private. This would depend on how a team leader is defined and whether other hierarchies existed such as those found in scrum teams (Vishnubhotla et al., 2018). In a fully developed tool any customisation selected would need to be transparent to all users.
Whilst the evaluation showed a highly innovative prototype the depend- ability of the product prototype was low. This related to permissions and low user trust in BTRSPI. Belbin team roles are used in some areas of indus- try but not exclusively and provide only one mechanism for assessing the strength and potential of teams.
There were a number of limitations to the study. The UEQ assessment is benchmarked against industry standard data and the dependability scores were therefore dependent on the source and accuracy of the data. The sam- ple size for this study was relatively small, limiting the generalisability of the findings. As all participants lived in the UK the applicability of the findings to a more global or diverse user base may be limited. Additionally, much of the data relied on self-reported user feedback, which can be affected by bias or subjectivity. In future research, observational studies or objective per- formance indicators need to be introduced to supplement the self-reported data.
ACKNOWLEDGMENT
The authors would like to thank the participants who took part in this study.
REFERENCES
Ahmad, R., Siemon, D. and Robra-Bissantz, S. (2018). Creativity tests versus cognitive computing: How automated personality mining tools can enhance team composition. Al Salman, W. and Hassan, Z., (2016). Impact of effective teamwork on employee performance. Int. Journal of Accounting & Business Management, 4(1), pp. 76–85. Bednár, R. and Ljudvigová, I. (2020). Belbin team roles in a start-up team. In SHS
Web of Conferences, (Vol. 83, p. 01002). EDP Sciences. Belbin, R. M. (2014). Method, reliability & validity, statistics & research: a comprehensive review of Belbin team roles. Belbin UK. Belbin, R. M. and Brown, V. (2022). Team roles at work. Routledge. Eppler, M. J. and Sukowski, O. (2000). Managing team knowledge: core processes,
tools and enabling factors. European Management Journal, 18(3), pp. 334–341. Furnham, A. (2020). ‘Myers-Briggs type indicator (MBTI)’, Encyclopedia of personality and individual differences, pp. 3059–3062. Hastings, E. M., Jahanbakhsh, F., Karahalios, K., Marinov, D. and Bailey, B. P. (2018).
Structure or nurture? the effects of team-building activities and team composition
Designing a User-Centred Team Role Testing App: Revealing Team Dynamics 457
on team outcomes. Proceedings of the ACM on Human-Computer Interaction, pp. 1–21. Jahanbakhsh, F., Fu, W. T., Karahalios, K., Marinov, D. and Bailey, B. (2017). You want me to work with who? Stakeholder perceptions of automated team for- mation in project-based courses. In Proceedings of the 2017 CHI conference on human factors in computing systems, pp. 3201–3212. Khawam, A. M., DiDona, T. and Hernández, B. S. (2017) ‘Effectiveness of teamwork
in the workplace’, International Journal of Sciences: Basic and Applied Research (IJSBAR), vol. 32, no. 3, pp. 267–286. Laugwitz, B., Held, T. and Schrepp, M. (2008). Construction and evaluation of a user experience questionnaire. In HCI and Usability for Education and Work: 4th Symposium of the Workgroup Human-Computer Interaction and Usability Engi- neering of the Austrian Computer Society, USAB 2008, Graz, Austria, November 20-21, 2008. Proceedings 4 (pp. 63–76). Springer Berlin Heidelberg. Randall, K., Isaacson, M. and Ciro, C. (2017). Validity and reliability of the Myers-
Briggs Personality Type Indicator: A systematic review and meta-analysis. Journal of Best Practices in Health Professions Diversity, 10(1), pp. 1–27. Ruch, W., Gander, F., Platt, T., and Hofmann, J. (2018). Team roles: Their relationships to character strengths and job satisfaction, Journal of Positive Psychology, 13:2, 190–199. Schrepp, M., Hinderks, A. and Thomaschewski, J. (2014). Applying the User Expe-
rience Questionnaire (UEQ) in Different Evaluation Scenarios. In: Marcus, A. (Ed.): Design, User Experience, and Usability. Theories, Methods, and Tools for Designing the User Experience. Lecture Notes in Computer Science, Vol. 8517, pp. 383–392, Springer. Schrepp, M., Thomaschewski, J. and Hinderks, A. (2017). ‘Construction of a Benchmark for the User Experience Questionnaire (UEQ)’. Schrepp, M. (2023). User Experience Questionnaire, available at: https://www.ueq-
online.org, accessed 14/11/2023. Seibert, S. E. and DeGeest, D. S. (2017). The five factor model of personality in business and industry. The oxford handbook of the five factor model, 27, p. 381. Soto, C. J., and Jackson, J. J. (2020). Five-factor model of personality. In Dana S. Dunn (Ed.), Oxford Bibliographies in Psychology. New York, NY: Oxford. van den Hout, J. J., Davis, O. C. and Weggeman, M. C. (2018). The conceptualization
of team flow. The Journal of psychology, 152(6), pp. 388–423. Vishnubhotla, S. D., Mendes, E. and Lundberg, L. (2018), May. Designing a capability-centric web tool to support agile team composition and task alloca- tion: a work in progress. In Proceedings of the 11th International Workshop on Cooperative and Human Aspects of Software Engineering (pp. 41–44). Zhu, H., Sheng, Y., Zhou, X. and Zhu, Y. (2016). Group role assignment with cooper-
ation and conflict factors. IEEE Transactions on Systems, Man, and Cybernetics: Systems, 48(6), pp. 851–863.
LISTED IN THE AHFE DIGITAL BOOKSTORE CATALOGUE
Explore the complete digital volume
Human Interaction and Emerging Technologies (IHIET-AI 2024): Artificial Intelligence and Future Applications
Read this individual research paper free through the original publisher, or explore the full digital proceedings book.
ISBN 978-1-958651-96-4
Explore this ISBN in the AHFE Bookstore ↗Listed in the July 2026 bookstore catalogue; search by ISBN to confirm current availability · Digital book purchase optional