Adrian Flowers, Arthur Wollocko, Caroline Kingsley, Elizabeth Thiry, Michael Jenkins (2023). Degradation in Dynamic Color Discrimination with Waveguide-Based Augmented Reality Displays. In: Augmented, Virtual and Mixed Reality Simulation. AHFE Open Access, vol. 118, pp. 160–174. https://doi.org/10.54941/ahfe1004451
Objective: The aim of this study was to evaluate degradation in human color perception that can occur when using augmented reality displays.Background: Stereoscopic augmented reality displays are known to degrade a user’s ability to interpret projected color information. However, a quantitative breakdown of this degradation does not exist for contemporary augmented reality displays that use waveguide optical combiners.Method: Participants performed the Ishihara color test and an augmented reality-focused variant of the Farnsworth-Munsell 100 test on color perception using a set of commercially available augmented reality displays (Microsoft HoloLens, Magic Leap One, and DAQRI Smart Glasses).Results: From our analysis of participant performance, we generated specifications to maximize color discrimination and highlighted common areas of difficulty for each headset.Conclusions: We defined a novel aware modification to a gold-standard test of color discrimination that accounts for spatial color distortion along the lens an AR display. The optimal color usage across displays will vary based on the design of the optical combiner, which necessitates a re-usable color test to characterize color degradation on each headset design.Applications: The design guidelines specified in this article will minimize the degradation in color perception when using augmented reality displays, allowing them to be used in domains that require fine color discrimination.
Augmented Reality (AR) is the augmentation or enhancement of the real world with simulated sensory stimuli. AR, in the context of this article, will refer to stereoscopic visual augmented reality, where a head-mounted display will overlay virtual visual objects onto a real-world scene. These displays use a variety of approaches and techniques to provide the illusion of depth to increase the realism of these combined virtual and real-world settings. In providing the capability for users to interact with virtual objects in a real- world setting, AR has several uses across domains. Key examples are in medical training skills (Birkfellner et al., 2002; Moult et al., 2013; Webel et al., 2011), where trainees are able to practice surgical techniques at a low cost in a real-world environment, and maintenance training (Webel et al.,
2011), where users can interact with virtual stimuli, and monitoring systems can track training performance and provide real-time user feedback. Beyond training, there is also interest in the use of AR to provide real-time guidance for complex processes (Henderson & Feiner, 2009; Webel et al., 2011), where AR could enable a medic or technician to have critical information available to them at all times.
In recent years, AR technologies have seen prolific application across a range of domains (e.g., mechanical maintenance, architecture, gaming, col- laboration and remote social interaction, and navigation and information display for vehicle operation). However, despite the growing readiness of the AR technology space and the unique ability of AR to facilitate improved understanding of complex spatiotemporal relationships, no widely adopted AR approaches have been developed to support tasks that require this kind of spatiotemporal reasoning, e.g., Army Mission Command (MC).
The use of AR is known to impair visual perception (M. Livingston, 2006). The breadth of these perceptual impairments differ across AR headsets and the technology that drives them (M. Livingston, 2006; M. A. Livingston et al., 2013), but the impact on user performance can be catastrophic depending on use-case. This is particularly true in the use of AR for real-time guidance, which can have applications for emergency medical care, as well as in the military. If a medical care practitioner uses an AR system to provide unob- trusive assessment during an emergency medical operation (Wu et al., 2014), and it degrades their ability to detect minute abnormalities in a patient, it can lead to life-threatening consequences. Similarly, in a situation where a military technician wants to use AR to assist in the completion of complex tasks, the use of AR may degrade the technician’s ability to respond to new and emergent threats in their surroundings, which can put both their own life and the lives of others at risk. When applied in MC, it is possible that sol- diers will be unable to identify, reason about, and react to emerging threats using the various visual sources available to them (e.g., military symbology displayed on a monitor or within the AR headset, or live video feeds from the battlespace).
To characterize these risks and the variance of these risks across headsets, we performed a set of human subject research studies focused on the degra- dation of real-world perceptual capabilities that occurs when using AR. This study is concerned with the degradation of color perception that is known to occur in AR. While studies have previously been performed on this color degradation (M. Livingston, 2006; M. A. Livingston et al., 2013), those stud- ies were performed using obsolete AR systems or those that were custom made within a laboratory environment and not reflective of the systems used commercially. Therefore, there is a need to characterize color degradation in modern AR headsets.
The most significant technological advancement in the use of AR since the studies performed by M. Livingston (2006) is the use of waveguides as an optical combiner. An optical combiner is the component in an AR sys- tem responsible for the fusion of the virtual environment with a real-world image.
Waveguides as Optical Combiners In recent years, waveguides have gained popularity as an optical combiner for AR. A waveguide optical combiner fuses real-world and virtual imagery in a two-step process. The first step is the collimation of light from the virtual image, where collimation is the process of narrowing and refocusing a beam of light into parallel lines.
Because collimation prevents light from dispersing, it allows light to travel long distances without divergence. Upon successful collimation, a waveg- uide will reflect the light from the virtual image onto the real-world image. The method used to transport light via reflection used within a waveg- uide is referred to as total internal reflection (TIR). TIR is a phenomenon that occurs when the angle of refraction for a light beam exceeds a critical angle, which allows the light beam to be reflected without suffering from dispersion.
Waveguides differ among one another in various dimensions, such as the method they use to collimate light, and how they reflect the collimated version of the virtual image onto the real-world image. The four types of waveguides commonly used in industry are diffractive, holographic, polar- ized, and reflective. Holographic waveguides use a series of holographic optical elements to directly reflect the collimated light through the waveg- uide. Diffractive waveguides use an array of slanted gratings to collimate light gradually, which is then reflected to the real-world image. Polarized waveguides use a series of internal reflections driven by polarized surfaces to combine real-world and virtual images. Reflective waveguides directly guide light using a series of semi-reflective mirrors (Kore, 2018; Wagner, 2019). For the displays represented in this study, both the Microsoft HoloLens and the Magic Leap One use a diffractive waveguide, and the DAQRI Smart Glasses use a reflective waveguide.
Color Non-Uniformity in Waveguides The process of repeated reflections in use by waveguide optical combiners can distort the colors perceived by users. Different wavelengths of light yield different colors. As a result, diffractive waveguides distort color significantly, because the angle at which light hits the diffusion gratings can vary based on color. The greater the incidence angle from the collimated light source, the greater this distortion can become (Mukawa et al., 2008). This process leads to a greater distortion of color the further the light is from the center of the headset’s field of view (FOV). This expression of color non-uniformity can be avoided, to an extent, by reducing the FOV of the headset. This approach ensures the supported incidence angles do not exceed a threshold that leads to a significant distortion.
Even if this non-uniformity is unnoticeable during normal use, it is likely that it will still degrade tasks that require fine color discrimination. To investigate the degradation of color perception that can occur when using waveguide-based AR displays, we investigated color perception with two studies: a functional color task evaluated with the Ishihara color test and an extensive investigation of fine-color discrimination.
Degradation in Dynamic Color Discrimination 163
METHODS
To understand the functional impact of AR displays with waveguide optical combiners, we performed two human subject studies that received approval by the New England Institutional Review Board. For the first study, par- ticipants completed the Ishihara color test to see if the degradation in a user’s color perception was enough to degrade their overall color recognition. Afterwards, participants in a second study took a variant of the Farnsworth- Munsell 100 color test to identify their ability to discriminate between similar colors in AR. This research complied with the American Psychological Asso- ciation Code of Ethics and was approved by the New England Independent Review Board. Informed consent was obtained from each participant.
Equipment For both studies, we used AR headsets with waveguide optical combiners. Specifically, we used the Microsoft HoloLens, which uses a diffractive waveg- uide; the Magic Leap One, which also uses a diffractive waveguide; and the DAQRI Smart Glasses, which use a reflective waveguide. For the baseline condition, we had participants perform the task on a desktop PC with a traditional 2D monitor.
Laboratory Conditions The laboratory was lit with two 120V Photoflood Lamps with a 3200K tung- sten color temperature. The environment was kept in photopic conditions, and the stimuli from the AR headsets was projected to a wall with a CIELUV color profile of (65 cd/m2, 0.4432, 0.4129).
STUDY 1 Ishihara Color Test for General Color Perception
In the first study, we investigated whether the use of a waveguide AR headset would reduce a user’s color perception to the point where it would signifi- cantly degrade their color perception. We did this with the Ishihara color test (ICT) (Ishihara, 1918). The ICT is a standardized test for color blindness that makes use of a series of plates, which consists of a set of colored dot patterns with numbers and other visual stimuli embedded within them. Participants are shown these plates and must specify what visual stimuli are embedded within the dot patterns. We made use of the 14-plate color test variant of the ICT for this study. To determine if the selected headsets would degrade a user’s color perception, we investigated whether participants would receive a lower score when they used the headset compared against their baseline.
Methodology
The study used a repeated measure design. For this study, participants would complete the Ishihara test once on the desktop and once on an AR headset. The order in which participants completed the study on the desktop and AR headset was randomized. Participants were randomly assigned an AR headset (i.e., the use of the HoloLens, the Magic Leap One, and the DAQRI Smart
Glasses was a between-subjects condition). Ishihara plates were projected to the center of each display to minimize potential issues caused by spatial color degradation. This study had 21 participants. Participants did not suffer from color blindness.
Hypothesis The null hypothesis for this investigation was that a participant would per- form identically when presented with the ICT on both the desktop and AR headset. The alternate hypothesis was that the use of a waveguide AR head- set would impair the participant’s ability to resolve the embedded visual stimuli and degrade their performance. In addition, we hypothesized that AR headsets employing diffractive waveguides (HoloLens, Magic Leap One) would impair participant performance more significantly than a headset that employed a reflective waveguide (Smart Glasses).
Results
Using the non-parametric Wilcox ranked sum test, we found that every par- ticipant performed equally to the baseline or better on the AR headset than on the desktop, with a significance of 0.05. The data support the null hypoth- esis. This result suggests that none of the demonstrated headsets degraded the overall color vision of participants. The percent accuracy of each headset investigated under the study can be seen in Table 2.
Because the Ishihara test does not provide fine-grained discrimination, we used a variant of the Farnsworth–Munsell 100 test (Farnsworth, 1943) to learn what aspects of the visual color space participants had the most difficulty discerning in AR.
Methodology
The Farnsworth-Munsell 100 hue test presents participants with four rows of color blocks in randomized order. The participants must then sort the blocks within each row by hue. This allows an experimenter to test what range in the color space participants have difficulty discriminating.
Degradation in Dynamic Color Discrimination 165
The original design of the Farnsworth-Munsell 100 hue test cannot port directly to an AR headset. The test requires a large amount of horizontal space, which would exceed the FOV limitations possessed by contemporary AR displays. This would require participants to rotate their head to interact with each row. To study the degradation of visual perception in AR, it is nec- essary for a participant’s view to remain stationary (to investigate the spatial inaccuracy along the lens). The Farnsworth-Munsell test also requires partic- ipants to physically sort and order each of the blocks in the test. This would complicate the interface and potentially introduce dynamic color distortion due to spatial distortion along the lens.
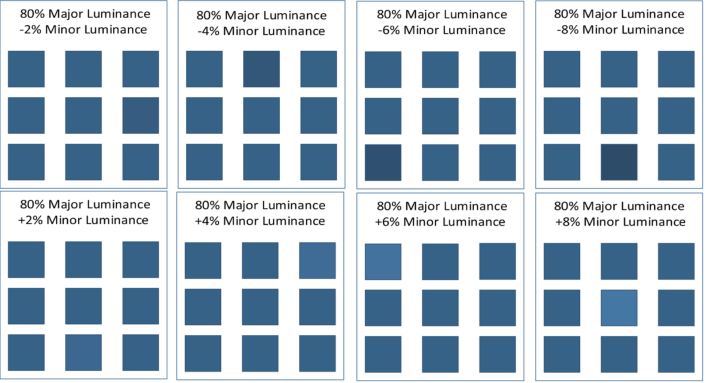
To adapt the Farnsworth-Munsell test for an AR display, instead of pre- senting users with four rows of 25 color blocks, we present users a 3x3 grid, where each cell of the nine cells in the grid contains a color block. Eight of the nine color blocks are identical, and the remaining color block will vary from the others by some offset in luminance. Participants were tasked with selecting which color block was different from the other eight. The luminance for the eight identical color blocks within a trial is referred to as the major luminance, and the remaining block is referred to as the minor luminance. The amount of luminance that the unique color block was offset from the major luminance is referred to as the luminance offset.
Unlike the original Farnsworth-Munsell 100 hue test, our goal in this investigation was to identify how well participants were able to discrim- inate differences in luminance rather than hue. The reason for this is to meet the real-world needs of MC to refine their color requirements for symbology in AR. The color for MC symbology can be defined in one of five discrete hues, but the luminance for these colors can be any value within a continuous interval. To maximize the capability of users to perceive and resolve visual information, these continuous intervals require greater specificity.
Color Selection The colors used for this test are taken from the colors defined in the MIL- STD 2525D interface standard, which defines a set of five colors that have been validated for their ability to be distinctly discerned across multiple back- grounds. This set of colors, alongside the Hue-Saturation-Luminance (HSL) encoding for them, is shown in Table 2. By using a color standard in use by the military for MC symbology, we ensure direct applicability of the results of this study towards the use of AR for MC.
Table 2. MIL-STD 2525D HSL color definitions.
Table available in the original PDF paper.
Color Dark Medium Light Red (0, 255, 100) (0, 255, 152) (0, 255, 192) Blue (138, 255, 70) (138, 255, 110) (138, 255, 192) Green (85, 255, 80) (85, 255, 113) (85, 255, 213) Yellow (42, 255, 110) (42, 255, 128) (42, 255, 192) Purple (213, 255, 40) (213, 255, 64) (213, 255, 208)
Trials Each trial in the study consisted of a color from Table 2, alongside a major luminance and a luminance offset. There are four possible major luminance values for each color. These four luminance values correspond to 20%, 40%, 60%, and 80% of the maximum luminance for a selected color. Within a trial, the luminance offset for the unique color block could range from a −10% to a +10% offset from the major luminance, with a step size of 2%. To ensure each participant saw every possible color, major luminance, and luminance offset combination, the study includes 200 unique trials per participant. An example demonstrating eight of the ten trials a participant will encounter for the color blue, at an 80% major luminance, is shown in Figure 1.
Figure 1: Example of trials for blue at 80% major luminance from −8% to +8% minor luminance.
Trial Administration The study used a repeated measure design. For this study, participants com- pleted the color discrimination test once on the desktop and once on an AR headset. The order in which participants completed the study on the desktop and the AR headset was randomized. The trial order for the study was ran- domized to prevent color adaptation, which would inhibit the participant’s ability to discriminate color differences, by ensuring that no two successive trials are the same color. As an additional mitigation against color adaptation, the maximum time to respond to each trial is three seconds. If participants do not successfully input an answer in the timeframe, the study will fail the current trial, and proceed to the next trial. For this study, 25 participants completed all trials. No participants suffered from color blindness.
Analysis This study had three major hypotheses: (1) an AR headset would degrade par- ticipants’ ability to discriminate between fine changes in luminance; (2) the
Degradation in Dynamic Color Discrimination 167
spatial position of color blocks within the AR display would affect color expression; and (3) participants’ performance in discriminating luminance would differ across colors.
We began with a preliminary analysis on whether the use of AR head- sets degraded a participant’s ability to properly resolve fine differences in luminance. For this analysis, we used the non-parametric Wilcoxon ranked test to compare the performance of participants with an AR headset and without a headset (the control). The overall characteristic statistics for color discrimination are shown in Table 3. From this analysis, we see a significant decrease in performance between the use of an AR headset and the control (alpha < .001).
Table 3. Color discrimination accuracy.
Table available in the original PDF paper.
Display Mean Standard Deviation Control 30% 8.5% HoloLens 23.7% 3.2% MagicLeap 22.1% 5.3% DAQRI 16.1% 9.6%
We then generated overall characteristic statistics for user performance based on major luminance on a per-headset basis (see Table 4).
Characterization After looking into the overall characteristics of the data, we performed a per device analysis of color representation. We began this by investigating the average accuracy of participants on a per-color basis under the control for each headset. Unfortunately, we found that the presence of a few strong out- liers, who experienced unexpected difficulties on the computer-based control, added a significant shift skew to the characterization of the data.
When investigating the baseline condition, using the Kruskal-Wallis non- parametric test on analysis of variance for our 25 participants, we found significant differences in the accuracy of color discrimination between colors (alpha < 0.001). Participants had the greatest difficulty detecting differ- ences between shades of blue and yellow; and had the easiest time detecting differences in shades of red and purple (see Table 5).
Table 5. Baseline color accuracy.
Table available in the original PDF paper.
Colors Mean Standard Deviation Red 40.2% 12.31% Blue 17.8% 7.98% Green 34.2% 10.3% Yellow 21.6% 10.22% Purple 36.0% 11.55%
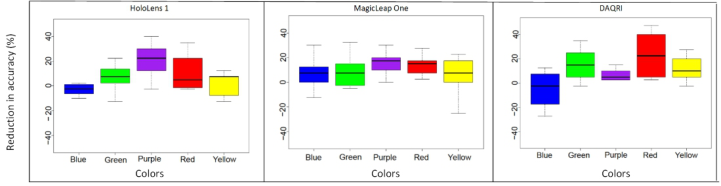
After finishing our analysis of the control group, we performed a follow- up analysis to see how each of the three headsets degraded the participants’ color accuracy compared to their baseline performance (see Table 6). Box- plots visualizations of the reduction in color accuracy for each HMD are shown in Figure 3.
Table 6. Percent decrease in color accuracy when compared against the participant’s baseline performance.
Figure 2: Percent reduction in per-color accuracy when using HMDs.
Because both the HoloLens and Magic Leap One use diffraction waveg- uides, we hypothesized that they would significantly distort color perception. We expected that color discrimination on the DAQRI Smart Glasses would not be significantly affected because it instead uses a reflection waveguide. However, we found that color discrimination was impaired across all three headsets.
Spatial Selection Bias Given the nature of waveguide displays, it is possible for the magnitude of the HMD’s color distortion to increase the further from the center of the lens
Degradation in Dynamic Color Discrimination 169
an object is displayed. To investigate if there was a bias introduced by the spatial location of color information, we first ensured that the randomized placement of the offset cell followed the same distribution between the desk- top control and when displayed on the participant’s AR HMD. Although we randomized which cell in the 3x3 grid was the offset cell–because the random ordering differed between the control and HMD condition–it is possible for the distribution of the offset cell placement to differ between both cases. To test this, we calculated the frequency that each of the nine cells was selected to be the offset cell for both the control and for the HMD. We then took the difference between these frequencies across conditions and used a two- tailed paired Kruskal-Wallis test to analyze the variance across this difference to ensure an equal distribution between the control and HMD conditions. We found no significant difference between the offset placement distribution between the control and HMD condition, confirming this placement was approximately equivalent across groups.
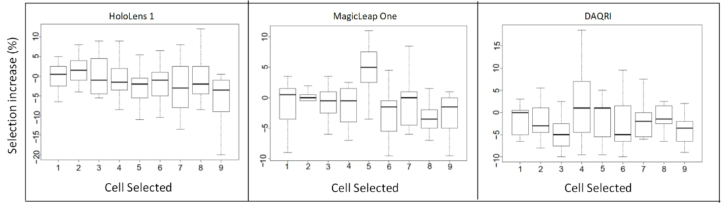
We used the same method to investigate if there was a difference between the selections made by participants between the control and HMD condi- tion, by taking the difference between the per-cell selection frequency of participants in the control and HMD condition. Our analysis identified no difference in cell selection patterns between the desktop and HMD conditions for the HoloLens and the DAQRI Smart Glasses (i.e., there is no evidence of a bias in spatial selection patterns). For the Magic Leap One, we identified a trend that participants had a higher likelihood of selecting the center-most cell when using the Magic Leap One than for the desktop/control condition (p = 0.16).
The boxplots in Figure 3 display the increased likelihood (in percentages) of a participant selecting a cell in the 3x3 color grid when using an HMD compared to the desktop control. In this plot, the cells in the grid are num- bered 1–9 from the upper-left most cell to the lower-right most cell. In this figure, the Magic Leap One’s trending spatial bias towards the center-most cell (cell 5) can be seen.
Figure 3: Boxplot of the percent increase in selecting a cell when using an HMD in comparison to the control condition.
Luminance Thresholds We investigated the effect of the major and offset luminance thresholds to understand the optimal usage of each color on a per-display basis. To assess
this, we applied a non-parametric exact binomial test to assess whether par- ticipants successfully completed a trial, consisting of a unique combination of a major luminance and offset with a rate greater than the probability of random chance when given nine options (∼11%).
For the baseline condition, we found that in general, a minimum of a 6% difference in luminance was required for participants to be able to identify the offset cell across all ranges. Across colors, the discrimination ability of par- ticipants varied dependent on the major luminance, with yellow and purple having best performance at low luminance values, while discrimination for red, green, and blue was highest at mid-high luminance values. Participants had the most difficulty with the color yellow, for which the highest accu- racy achieved during testing was approximately 60%. Participants had the greatest overall discrimination for the color red. Green provided the largest effective discrimination range, with participants exceeding the probability of random chance for 22 discrete major luminance and offset combina- tions. Purple was the best color in providing high user discrimination and a large range, with 21 discrete major luminance and offset combinations that performed higher than random chance.
Using a one-tailed paired non-parametric Wilcoxon ranked sum test, we investigated whether participants expressed reduced performance for each HMD based on the major and minor luminance bands. For the HoloLens, we observed that participants had significantly degraded performance for all major luminance values aside from the 60% major luminance threshold. For the Magic Leap One, we found that participants had significantly degraded performance for all major luminance values aside from the 40% major luminance threshold. The DAQRI Smart Glasses showed significant perfor- mance degradation between the 40% to 80% major luminance thresholds but showed no evidence of performance degradation at a 20% major luminance. These results and the associated P-Values are highlighted in Table 7.
Table 7. P-Values for one-tailed paired non-parametric Wilcoxon ranked sum test on whether the HMD degraded performance at the specified major luminance range.
HMD Usage and Color Characterization After assessing the effect of the major luminance of color discrimination, we assessed if there was a significant difference in color discrimination for each unique major luminance and offset trial between the control and HMD con- ditions, using the paired non-parametric McNemar test. We then combined the results of this test with our per trial exact binomial test, to assess which trials fit the following criteria: (1) there is a significant difference between the
Degradation in Dynamic Color Discrimination 171
control and HMD condition; (2) participants pass the trial in the control con- dition; and (3) participants could not pass the trial in the HMD condition (to a significant degree). The tables and plots generated during this testing can be provided in supplementary material by request to the author.
Using this analysis, we generated tables for each HMD that specify under which luminance conditions participants could discern colors. For the HoloLens 1, the conditions under which participants expressed accuracy greater than random chance are defined in Table 8, the HoloLens expressed optimal performance for the colors red and purple.
Table 8. HoloLens 1 optimal viewing conditions.
Table available in the original PDF paper.
Color Optimal luminance range Minimum offset Red ≥60% 6% Blue ≥60% >10% Green Any >10% Yellow 20% >10% Purple ≤40% 6% offset at low luminance >10% offset at higher luminance
For the Magic Leap One, participants had the greatest performance with the colors red and green. Yellow had the worst effective performance, with only three trials in which participants were able to identify the offset color, and within these trials, the accuracy of participants did not exceed 33%. The accuracy for color discrimination using the Magic Leap One rarely exceeded 67%, which could suggest that factors other than luminance had a significant impact on color discrimination.
The mitigating factor is likely the trend of a spatial color distortion iden- tified when using the Magic Leap One. If this spatial deformation does exist, it means that developers must be aware of the spatial distribution of content projected to the Magic Leap One and should ensure that any objects where a user must discriminate between objects with a similar color profile preferably keep these objects near the center of the display, where the distortion will be minimized. If this is not feasible, the developers should keep these objects within close spatial proximity to one another so that a similar distortion is applied to them. The conditions under which participants expressed accuracy about random chance for the Magic Leap One are defined in Table 9.
Table 9. Magic leap one optimal viewing conditions.
Table available in the original PDF paper.
Color Optimal luminance range Minimum offset Red ≥60% 6% Blue ≥60% >10% Green ≥60% >10% Yellow 20% 6% Purple Any >10%
The DAQRI Smart Glasses saw the largest degradation at high luminance values and retained strong discrimination at low luminance values. Fur- thermore, participants using the Smart Glasses had the greatest difficulty processing the colors red and blue but had the widest color discrimination range for purple, with results summarized in Table 10.
Table 10. Magic leap one optimal viewing conditions.
Table available in the original PDF paper.
Color Optimal luminance range Minimum offset Red ≥60% 10% Blue None Indiscernible Green 20% 6% Yellow 20% 6% Purple ≤40% 6%
RESULTS
Our analysis confirmed that while contemporary AR headsets do not degrade gross color discrimination, as shown by the ICT test, they do impose a sig- nificant degradation in fine-color discrimination, with results summarized in Table 11.
Table 11. HMD color discrimination key takeaways.
Table available in the original PDF paper.
Microsoft HoloLens 1
Expressed optimal performance in reds and purples.
The Magic Leap One
Expressed a trend suggesting spatial distortion.
Has optimal performance with reds and greens.
The DAQRI Smart Glasses
Performance at a very low major luminance threshold (20%) was similar to performance in the control.
The Smart Glasses expressed optimal performance with the color purple.
Dissimilar to the HoloLens and the Magic Leap One, the Smart Glasses expressed a poor performance for the color red.
We noticed that for each group there existed significant outliers who showed extremely poor performance differing significantly from other users. From user feedback, we believe this is likely due to test fatigue. This study consists of 200 trials, each of which lasts up to three seconds. It is likely that the fatigue accrued in completion of this study twice increased the diffi- culty for participants to complete the trials over time. In future iterations of this study, we will remove the offset ranges that participants were unable to identify across all colors in any of the test groups (e.g., the +/−2, and +/−4 luminance offsets). This will reduce the total number of trials by 40%.
Degradation in Dynamic Color Discrimination 173
DISCUSSION
Previous studies have shown that the use of the Ishihara Color Test (ICT) on a desktop is not as accurate as the test performed using the physical printed color prints, because it is difficult to ensure fully accurate color representation on the desktop. However, even with slight differences in color expression, they are considered good enough to provide a general understanding of the participant’s ability to perceive colors (Hoffman & Menozzi, 1999; Marey et al., 2014). Because the performance of non-color-blind participants on the ICT using an AR headset is equal to or greater than their performance on the desktop, we conclude that in a general case where fine color discrimination is not required, contemporary waveguide AR headsets provide enough variance in color expression that they do not harm a user’s ability to interact with visual stimuli.
Fine color discrimination will degrade because of the color non-uniformity found in most waveguides. Performing a per-headset analysis of fine-color discrimination, we identified significant weaknesses in the ability for par- ticipants to differentiate colors in specific portions of the color space. If fine-color discrimination is a necessity, it is necessary to understand the strengths of the headsets in use to ensure that decision choices do not degrade the ability of users to interact with and interpret visual stimuli. Performance will vary according to differences in both the hue and the level of luminance in the stimuli. Through understanding of the perceptual characteristics of each headset, developers can make informed design choices to maximize human performance and minimize errors that occur as a limitation of the medium.
While it is tempting to make a judgement on the performance of diffusion vs. reflective waveguides from the result of this study, the sample of headsets is too small to make such an assumption. This is particularly true because of differences in projection technology and AR display design that could con- tribute to this degradation beyond the impact of the selection waveguide. Upon execution of this study on a larger number of representative AR dis- plays, we will be able to make such a generalization, but no such statements can be made at this time.
ACKNOWLEDGEMENTS
This material is based upon work supported by C5ISR under Contract No. W56KGU-18-C-0002. Any opinions, findings and conclusions or recom- mendations expressed in this material are those of the author(s) and do not necessarily reflect the views of C5ISR.
REFERENCES
Birkfellner, W., Figl, M., Huber, K., Watzinger, F., Wanschitz, F., Hummel, J., Hanel, R., Greimel, W., Homolka, P., Ewers, R., & Bergmann, H. (2002). A head- mounted operating binocular for augmented reality visualization in medicine— Design and initial evaluation. IEEE Transactions on Medical Imaging, 21(8), 991–997. https://doi.org/10.1109/TMI.2002.803099 Farnsworth, D. (1943). The Farnsworth-Munsell 100-Hue and Dichotomous Tests
for Color Vision. Journal of the Optical Society of America, 33(10), 568–578.
Henderson, S. J., & Feiner, S. (2009). Evaluating the benefits of augmented reality for task localization in maintenance of an armored personnel carrier turret. Mixed and Augmented Reality, 2009. ISMAR 2009. 8th IEEE International Symposium On, 135–144. https://ieeexplore.ieee.org/abstract/document/5336486/ Hoffman, A., & Menozzi, M. (1999). Applying the Ishihara test to a PC-based
screening system. Displays, 20(1), 39–47. Ishihara, S. (1918). Tests for color-blindness. American Journal of Ophthalmology, 1(5), 376. Kore, A. (2018, September 16). Fundamentals of display technologies for Augmented
and Virtual Reality. Hackernoon. https://hackernoon.com/fundamentals-of-displ ay-technologies-for-augmented-and-virtual-reality-c88e4b9b0895 Livingston, M. (2006). Quantification of visual capabilities using augmented reality displays. 3–12. https://doi.org/10.1109/ISMAR.2006.297788 Livingston, M. A., Gabbard, J. L., Swan, J. E., Sibley, C. M., & Barrow, J. H. (2013).
Basic Perception in Head-Worn Augmented Reality Displays. In W. Huang, L. Alem, & M. A. Livingston (Eds.), Human Factors in Augmented Reality Envi- ronments (pp. 35–65). Springer New York. https://doi.org/10.1007/978-1-4614- 4205-9_3 Marey, H., Semary, N., & Mandour, S. (2014). Ishihara electronic color blindness test: An evaluation study. Ophthalmology Research: An International Journal, 3(3), 67–75. Moult, E., Ungi, T., Welch, M., & Fichtinger, G. (2013). Ultrasound-guided facet
joint injection training using Perk Tutor. International Journal of Computer Assisted Radiology and Surgery, 8(5), 831–836. Mukawa, H., Akutsu, K., Matsumura, I., Nakano, S., Yoshida, T., Kuwahara, M., Aiki, K., & Ogawa, M. (2008). A Full Color Eyewear Display using Holographic Planar Waveguides. The Society for Information Display, 89–92. Wagner, D. (2019, August 7). Why is making good AR displays so hard?
Linkedin. https://www.linkedin.com/pulse/why-making-good-ar-displays-so-ha rd-daniel-wagner/ Webel, S., Bockholt, U., Engelke, T., & Peveri, M. (2011, October). Augmented Reality Training for Assembly and Maintenance Skills. BIO Web of Conferences: SKILLS. Wu, J.-R., Wang, M.-L., Liu, K.-C., Hu, M.-H., & Lee, P.-Y. (2014). Real-time
advanced spinal surgery via visible patient model and augmented reality system. Computer Methods and Programs in Biomedicine, 113(3), 869–881.
LISTED IN THE AHFE DIGITAL BOOKSTORE CATALOGUE
Explore the complete digital volume
Augmented, Virtual and Mixed Reality Simulation
Read this individual research paper free through the original publisher, or explore the full digital proceedings book.
ISBN 978-1-958651-94-0
Explore this ISBN in the AHFE Bookstore ↗Listed in the July 2026 bookstore catalogue; search by ISBN to confirm current availability · Digital book purchase optional