Jolene Feldman, Lynne Martin, Gregory Costedoat, Vimmy Gujral (2023). Usability of pre-flight planning interfaces for Supplemental Data Service Provider tools to support Uncrewed Aircraft System Traffic Management. In: Application of Emerging Technologies. AHFE Open Access, vol. 115, pp. 357–366. https://doi.org/10.54941/ahfe1004333
Small uncrewed aircraft systems (sUASs) operate in low-altitude, uncontrolled airspace – where support services for their operators (UASOs) are not currently provided. NASA’s System-Wide Safety (SWS) project is identifying the potential risks and hazards to sUAS operations to provide, inform, and improve the designs of In-time Aviation Safety Management Systems (IASMS). The IASMS will include a suite of data-driven tools that compile and analyze data collected from aviation systems and environmental sources to predict hazards, and provide information to allow operators to mitigate these risks (Young et al., 2020). These risk and hazard services can be run and displayed to operators on graphical user interfaces (GUIs), as they relate to a vehicle(s)’ route of flight. These interfaces offer both a means to present hazard service output and offer an opportunity to test user understanding of the information, user decision making, and the best ways to present such data to an operator. Based on these future technologies and intended missions, it is important to investigate interface requirements and evaluate how operators might use these tools. Presenting salient and meaningful risk assessment information to operators is necessary to increase situation awareness and ultimately safety. Building on previous research (Feldman et al., 2022), a usability study comparing two GUIs was conducted to explore how individuals interacted with different styles of information displays. A series of pre-flight hazard and risk-assessment tasks were developed to evaluate participant performance using the Supplemental Data Service Provider Consolidated Dashboard and the Human Automation Team Interface System interfaces. Participants were trained to use both GUIs and their performance was analysed across different scenarios involving multiple sUASs. Performance on simple tasks and the System Usability Scale scores were reported by Feldman et al., 2023. Additional analyses and evaluations on more complex tasks (e.g., risk assessment, prioritization), workload and response times are examined in this paper.
Future operations for Urban Air Mobility and small Uncrewed Aircraft Sys- tems (sUASs) will likely require operators to manage multiple vehicles in time-sensitive and potentially complex low-altitude, uncontrolled airspace environments. Support services and tools to successfully manage these types of operations can be utilized ahead of the flight to enable and maintain safe and efficient operations. Predictive risk and hazard information can be presented to operators through services and tools during sUAS pre-flight planning. These services can be run and displayed through Supplemental Data Service Provider (SDSP) interfaces – which provide support to oper- ators as they assess risks and hazards by increasing situational awareness, mitigating risks and determining potential alternate routes.
Providing potential risk and hazard flight path data displayed through SDSPs can be informative, but how this information is conveyed and used requires consideration. Huttner and Friedrich (2020) reviewed studies inves- tigating human-systems interactions when managing sUAS planning and summarized key characteristics for successful interactions. They concluded that to achieve effective collaboration between the user and systems, inter- faces should be easy to learn and use, minimize operator cognitive workload, support situation awareness and decision making, adjust the level of automa- tion support, enhance user engagement, and foster appropriate levels of trust.
We conducted a usability study to further develop and test prototype hazard and risk services, and evaluate how operators might use such tools for sUAS operations (see Feldman et al., 2023). Our objective was to determine whether two candidate interfaces could provide enough informa- tion for operators to understand and successfully complete risk and hazard assessment tasks (predicted to be typical in real-world sUAS operations) in simulated scenarios. The Supplemental Data Service Provider-Consolidated Dashboard (SDSP-CD), developed at NASA Ames Research Center, and the Human Automation Team Interface System (HATIS), developed by the Human Automation Teaming Solutions company, are candidate graphical user interfaces (GUIs) that display the results of predictive services to the operator.
This paper focuses on analyses of data collected from our usability study. The purpose of these analyses is two-fold: to assess workload, and to high- light display design features that may affect the time it takes for operators to complete a task (i.e., efficiency). Previous reviews have provided some guiding principles for managing workload, with studies investigating display design and workload mitigation (e.g., executing menu functions) in human- robotic interactions (see Prewett et al., 2010). Operator workload demands can change depending on, for example, how raw and/or aggregate data is accessed through an interface. Even in the pre-flight planning phase, oper- ations at scale may be complex, time-driven, and demanding. As operators completed tasks in our usability study (i.e., as users accessed information from the displays), we wanted to determine how the two GUIs affected per- ceptions of workload and the time needed to complete tasks. Verbal responses
Usability of Pre-Flight Planning Interfaces for Supplemental Data Service 359
and data entry responses from a series of tasks, including prompted what- if questions (e.g., questions about assessing risks), drawing on paper maps, responses to a paper and pencil workload task, and feedback on open-ended questions were collected. Data analyses include response time (RT) and work- load ratings (NASA Task Load Index (TLX) ratings, Hart & Staveland, 1988), responses on risk assessment tasks, and subjective feedback.
METHODOLOGY
This study was conducted in-person at NASA Ames Research Center. Sixteen participants were trained to use the two GUIs and then completed the above- mentioned tasks in two nominal scenarios using the two different GUIs. Both scenarios simulated four sUASs. In the Wildlife scenario, the sUASs completed bird and animal monitoring missions. In the Package scenario, the four sUASs delivered different types of parcels. For details about the methodology, sce- narios, GUIs, and analyses of the usability data collected, see Feldman et al. (2023).
To determine workload, two blocks of similar tasks were constructed for each GUI – discriminative tasks 1 and 2. In the first discriminative task block (D1), participants were asked about power management, specifically, han- dling risks regarding an insufficient battery charge (e.g., “With the existing battery alert for UAV403, what options do you have and what would you decide to do?) and altering flight paths to meet specific criteria (e.g., drawing on a paper map to adjust a flight path to avoid roads). In the second dis- criminative task block (D2), participants were asked to resolve issues with a population hazard (i.e., identify which vehicles had a population hazard, and to adjust those flight paths to avoid this hazard). Participants either drew on a paper map to show their solutions when using the SDSP-CD, or used the rubber-banding feature on the HATIS. A modified version of the TLX was administered after these two contiguous blocks of tasks. The TLX is a brief scale that assesses subjective workload over multiple dimensions, resulting in an overall workload score (Hart & Staveland, 1988). Participants marked their responses from 0 to 100 (Low to High) for each of five ratings. These ratings were for: mental demand, temporal demand, performance, effort, and frustration level. Physical demand (e.g., pushing, pulling, etc.) was omitted and not examined in this study.
The time to complete each task was also collected. For specific questions, participants were informed that they should attempt to respond as quickly as possible. The first response time question (RTQ-1) asked participants to identify the total number of hazards across all vehicles. The second response time question (RTQ-2) asked users to report the frequency of a specific haz- ard type (i.e., the number of GPS hazard alerts). Due to some technical issues with the HATIS interface, certain services were unavailable and, as a result, the users were asked about the frequency of an available service. Video and audio were used to record and time stamp these events, resulting in an RT score for each question. For each question, only users that reported the cor- rect response to both the SDSP-CD and HATIS interface were considered for
analysis. For RTQ-1, 9 users’ data were analyzed, and for RTQ-2, 11 users’ data were analyzed.
Unweighted scores were calculated for the TLX data; paired samples t-tests (two-tailed) were performed for the TLX and RT data to determine significance.
Tasks that included open-ended questions (i.e., questions without set response criteria), for example, asking participants about risk(s) and how they would alter a flight path, and why, required more subjective analyses. Two coders reviewed and scored these data, seeking an additional coder as necessary to reach consensus based on specific criteria or to determine general themes.
RESULTS
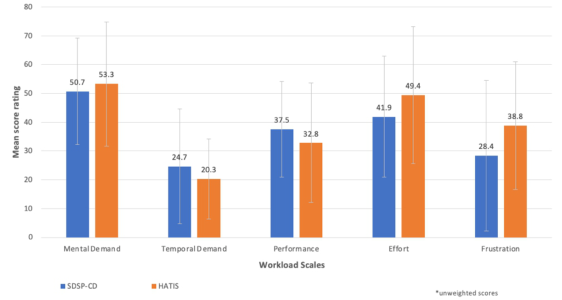
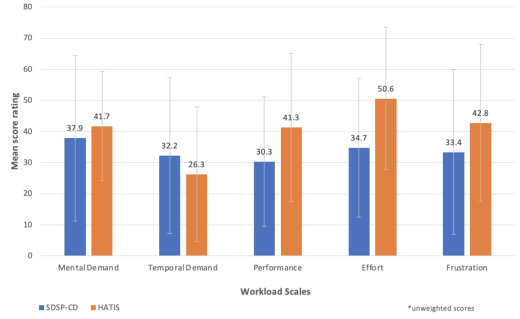
The TLX workload ratings for the five sub-scales were combined into a single workload rating, using raw and unweighted ratings for each GUI, and after each of the two discriminate task blocks. The mean workload scores were similar within the D1 task block for both GUIs, with less than a 3-point difference that was not significant (p>0.05) – with the SDSP-CD receiving a mean rating of 36.1, and the HATIS receiving a mean rating of 38.4. There was a greater difference between the workload scores while using the two GUIs for the D2 task – with the SDSP-CD receiving a mean rating of 33.3 and the HATIS receiving a mean rating of 40.5. However, this difference was also not significant (p>0.05).
In Fig. 1 (task block D1) and Fig. 2 (task block D2), we show the work- load ratings for each of the five sub-scales. When looking across the D1 and D2 task blocks, except for the TLX performance rating (i.e., how success- ful participants felt in completing the tasks), the general pattern of mean scores across subscales and interfaces is similar (Figs. 1 and 2). That is, for both blocks the mean ratings for mental demand, effort, and frustration were higher using the HATIS than the SDSP-CD, while temporal demand was higher for the SDSP-CD than the HATIS. No significant differences in the workload ratings were found between GUIs within the task blocks (p>0.05).
Figure 1: Mean TLX workload ratings for five workload sub-scales for the D1 task block by GUI type. Error bars represent standard deviation.
Usability of Pre-Flight Planning Interfaces for Supplemental Data Service 361
Figure 2: Mean TLX workload ratings for five workload scales for the D2 task block by GUI type. Error bars represent standard deviation.
For RTQ-1, The results indicated that the time needed to identify the total number of hazards was less when using the SDSP-CD interface (M = 13.89 s, SD = 11.91 s), i.e., it was faster, compared to HATIS (M = 25.33, SD = 12.36), t(8) = 8.20, p <.0001. For RTQ-2, the results also revealed that the time needed to identify specific hazards was less using the SDSP- CD (M = 4.00 s, SD = 1.84 s) than when using HATIS (M = 25.82 s, SD = 18.35 s), t(10) = 4.09, p <0.01.
Risk assessment tasks focused on questions about hazards, and prompted participants to describe their rationale for adjusting a flight path. In gen- eral, participants correctly identified the risks and hazards in the scenarios (Table 1), with only the low-battery risk questions resulting in less than 90% correct responses – that is participants had more difficulty identifying low- battery risk alerts than other types of risks and hazards. However, it was participants’ reasoning and solutions that were of most interest.
Table 1. Number of participants, out of eight in each cell, who correctly identified the risk / hazard.
Table available in the original PDF paper.
Package scenario Wildlife scenario Types of Risks and Hazards CD HATIS CD HATIS
Low battery risk 7 6 8 5 Nearby population hazard 8 7 8 8 Proximity to ground obstacle hazard 8 8 8 8 Risks to a specific vehicle 7 8 7 8 Total correct responses out of 32 30 29 31 29
For the Package scenario, participants were asked which alerts they would prioritize and resolve first. The low battery risk and nearby population haz- ard were perceived to be high-priority risks and were reported by the majority of participants as the primary alerts they would address. An example of one
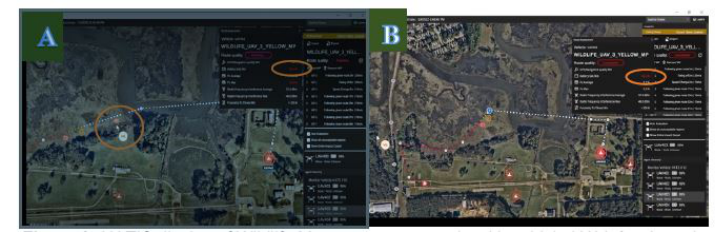
type of these risk scenarios, a nearby population hazard is shown in Fig. 3 – the population hazard is indicated by the orange circle along the flight path in Fig. 3A. In the Wildlife scenario using the HATIS GUI, when presented with a nearby population hazard, all eight participants correctly identified the pop- ulation hazard (corresponding to the yellow highlighted cell in Table 1) and chose lateral (direction not altitude change) solutions.
In this scenario, to resolve this hazard, six participants (75%) moved waypoint 8 towards the north to avoid the population hazard (see Fig. 3B), while two participants edited the flight path either by shortening it and/or by removing waypoints. In this particular case, the participant used the HATIS rubber-banding feature to adjust the flight path to avoid the population hazard (i.e., the orange circle is no longer displayed in Fig. 3B).
Although participants successfully altered the path to avoid the popula- tion hazard, there was still an unacceptable low-battery alert (in Fig. 3B, the orange oval shows that the low-battery risk is still present after resolving the population hazard). Only two participants indicated that they considered how their adjustments could affect the battery power available. The HATIS vehicle panel provides updated information to the operator about any effects of route changes on the services. Here, adjusting the flight path to increase its length would also increase the severity of the battery risk. There were also situations where participants’ attempts to adjust a flight path to resolve risks created new and unexpected hazards. In some cases, participants found that they had to try many iterations to rubber-band the flight path to reach an “acceptable” or “good” flight path. Participants reported some levels of frustration when adjusting a flight path to avoid one hazard, only to discover that, after the adjustment, the original hazard had not been resolved and/or a new hazard, that was not previously depicted on the map, was now present.
In the Wildlife scenario using the HATIS GUI, five out of eight participants (see the blue highlighted cell in Table 1) correctly identified the low-battery risks by determining threshold changes (from yellow to red by waypoint). To solve the low-battery risk, most participants said that they would shorten the route. One participant using the HATIS reported that they could not see the final waypoint – this waypoint was hidden under a GPS hazard icon. With the option of altering flight paths to remove risks, most participants chose to alter the routes laterally, rather than vertically or to make no changes.
For open-ended feedback, participants described their workload concerns with respect to a fleet manager’s pre-flight workload. Most described how these interfaces could ultimately reduce workload and make an operator’s job easier by having the ability to identify hazards and determine issues and loca- tions quickly (e.g., on the HATIS GUI, the yellow to red route color transition showed the boundaries of where a risk of a hazard increased or decreased), provide change options, and opportunities for resolving the hazard (e.g., deconflicting plans). Participants indicated that planning could be more effi- cient and effective and that workload could be reduced since the GUIs warn operators of threats that they can manage without a lot of research. Par- ticipants also described how reducing the click count (e.g., not having to toggle between separate vehicles and instead having one view) could reduce workload. Some alternate perspectives described how these tools were more
Usability of Pre-Flight Planning Interfaces for Supplemental Data Service 363
of a safety check rather than useful for flight planning directly; they would mostly change the balance of the workload – with more work upfront and less to do during flight. Others described how the integration of these systems with other systems could affect workload (e.g., system’s ability to import cer- tain files can result in an overall workload reduction). A few, who thought workload could be increased with these GUIs, described being concerned if they were required to use these services in addition to other software systems, specifically with respect to the workload required to enter all the flight paths, the time needed to prioritize services, and having to temporally deconflict the vehicles.
Figure 3: HATIS display of wildlife management scenario with vehicle UAV_3 selected. A) The population hazard (i.e., fishermen by the creek) is depicted in the orange circle before the flight path is altered by the participant. B) After the participant has adjusted the flight path north-west of the creek to avoid the population hazard.
DISCUSSION
Data reported in this paper focuses on workload ratings, response times, and subjective risk assessment. Subjective feedback provided explanations about why, for example, participants chose to adjust a flight path and what was frustrating about a GUI feature. Largely, participants were positive about the capabilities of both GUIs and the majority expressed that the GUIs and services they displayed would reduce operator workload for pre-flight planning.
The higher mean temporal workload scores for the D2 task block (Fig. 2) was expected, as there was a specific time component for these tasks. How this information could be accessed between GUIs may have amplified the dif- ference between the workload for each block. The layout of this information linking vehicles and services is presented differently on the SDSP-CD and the HATIS – and may be reflected in these scores. Having a single comprehensive view of all vehicles and information on the SDSP-CD made completing this task more accessible. This contrasts with how flight and vehicle information is accessed using the HATIS, which requires selection of one vehicle at a time, while other vehicles remain in a queue on the interface panel. The partici- pant needs to click through each vehicle individually, remember the number of affected alerts, keep this information in memory while navigating through the remaining vehicles, and finally, summarize and report this number. This
process requires not only more navigation through the interface but is more cognitively demanding. Furthermore, in open-ended comments about work- load, participants reported that there was “too much clicking” in the HATIS interface as compared to the SDSP-CD.
More complete interpretation of TLX workload ratings can be gained through comparisons to similar studies in relevant areas. As a reference, Grier (2015) found that global TLX scores between 33-39.45 reflect work- load ratings between the 20-30th percentile (this range of scores includes the physical demand scale and both weighted and unweighted data). Here, the discriminative task TLX scores (presented in Figs. 1 and 2) may align at the 20-30th percentile, which is lower in comparison to ratings in other analyses of ATC workload, but are much higher than the lowest ATC work- load score of 6.21 (Grier, 2015). We may infer that the discriminative tasks were not too demanding nor too simple but indicated low-average workload levels.
Again, the method through which to access and identify hazards differed by GUI, and this was reflected in significant differences in response time scores. For both RT questions, users were able to respond more quickly when using the SDSP-CD interface than when using HATIS. The most likely explanation for this finding is that, in the SDSP-CD, all of the hazards for each vehicle are remain constantly visible on the dashboard. In contrast, for HATIS, users are required to click on each vehicle to populate the hazard information. The necessity to click through each vehicle is the most obvi- ous difference between the two interfaces and likely contributed, to the RT differences observed in the present study. As mentioned previously, this is not to diminish from the HATIS functions or capabilities, but to demon- strate the possible effect of display design and data access on efficiency. Response time performance in simulated communications of UAS operations has been evaluated (Shively et al., 2013) – underpinning time as a consid- eration in complex operations. The timeliness of pre-flight operations may contribute to in-time operations. In future operations, the role of a fleet man- ager may require evaluation of re-routing and modifications for in-time flight operations, and despite potential automated tools (Suzuki & Dao, 2022) to support this responsibility, such operations will still be bounded by time limitations.
As illustrated in Fig. 3, predictive tools that provide some level of guid- ance for multiple alternate acceptable flight paths, or heat map data to indicate areas to avoid, could support flight planning operations. In addi- tion, it is possible that providing more than one alternate flight path option could enable operators to remain active in-the-solution-loop as opposed to passively accepting automated options. To illustrate, the design of an inter- face support system influenced the exploration and evaluation of alternative plans by users in a study by Layton et al. (1994). In one case, the sys- tem design induced 40% of the commercial pilots studied to select a poor flight plan despite the ability to explore alternatives. The effect of providing an alternative solution to users did not necessarily guarantee optimal flight plan selection, reflecting that the kind of information presented can impact decision making.
Usability of Pre-Flight Planning Interfaces for Supplemental Data Service 365
Assessments revealed how participants handled specific risks (e.g., popu- lation hazards) to the flight plans and route adjustments, as well as prioriti- zation of risks based on the scenario and the missions. Some of the adjusted flight paths were not necessarily the most efficient, compromised the mission, failed to consider the constraints, or the effect on other services. Given the option to change planned flight paths, participants’ explanations about how they assessed risk and adjusted routes provide insight into how future hazards may be prioritized, what the implications might be, and what may need to be emphasized in advance for specific vehicles and missions. Some design considerations for supporting the task; for example, the difficulty caused by obscured information and the need to prevent masked data (e.g., hidden waypoints), were described in this study.
Although the training time was the same for both GUIs, and while mission information was readily available to participants on paper, the significance and relevancy of this information could have been emphasized more during training. Additionally, discrepancies between what was presented on the GUI display versus the paper maps may have contributed to the differences in the ability to identify risks from structures and vehicle alerts. One participant reported it was difficult to cross-reference between the paper map versus the GUI display, which introduced a level of uncertainty.
SUMMARY A usability study was conducted to evaluate participant performance using two pre-flight planning GUIs that support sUAS missions. This paper focused on evaluations and analyses using specific measures which highlighted users’ impressions and interactions with the functions and capabilities of the SDSP- CD and HATIS interfaces – determining how operators used these tools for pre-flight sUAS planning. The effects on workload, response times, hazard prioritization and flight path alteration feedback can guide and advance future GUI designs and development. Well-designed interfaces that display risk and hazard prediction services, and tools that optimally inform opera- tors and sUAS operations can provide the necessary support to ensure mission safety and success of sUAS flights.
ACKNOWLEDGMENT
This work was supported by the System-Wide Safety (SWS) project, under the Airspace Operations and Safety Program (AOSP) within the NASA Aeronautics Research Mission Directorate (ARMD).
REFERENCES
Feldman, J., Martin, L., Bradley, J., Walter, C., & Gujral, V. (2022). Developing a dashboard interface to display assessment of hazards and risks to sUAS flights, Proceedings of the AIAA Aviation 2022 Forum, Chicago, IL and Online. https://doi.org/10.2514/6.2022-3462
Feldman, J., Martin, L., Gujral, V., Walter, C., Billman, D., Revolinsky, P., & Costedoat, G. (2023). Developing and testing two interfaces for Supplemental Data Service Provider (SDSP) tools to support UAS Traffic Management (UTM), Proceedings of the AIAA Aviation 2023 Forum, San Diego, CA and Online. Grier, R. A. (2015). How high is high? A metanalysis of NASA TLX global workload
scores, Proceedings of the Human Factors and Ergonomics Society 59th Annual Meeting, doi: 10.1177/1541931215591373. Hart, S. G., & Staveland, L. E. (1988) Development of NASA-TLX (Task Load Index): Results of empirical and theoretical research, In Hancock P. A., Meshkati N. (Eds.) Human Mental Workload. Amsterdam: North Holland Press. Hertzum, M. (2021). Reference values and subscale patterns for the Task Load Index
(TLX): A meta-analytic review. Ergonomics, 64(7), 869–878. Huttner, J. P., & Friedrich, M. (2023). Current challenges in mission planning systems for UAVs: A systematic review, 2023 Integrated Communication, Navigation and Surveillance Conference (ICNS), Herndon, VA, USA, 2023, pp. 1–7, https://doi.or g/10.1109/ICNS58246.2023.10124299 Layton, C., Smith, P. J., & McCoy, C. E. (1994). Design of a cooperative problem-
solving system for en-route flight planning: An empirical evaluation, Human Factors, 36(1), 94–119. Politowicz, M. S., Chancey, E. T., & Glaab, L. J. (2021). Effects of autonomous sUAS separation methods on subjective workload, situation awareness, and trust, AIAA SciTech Forum, Virtual Event. https://doi.org/10.2514/6.2021-1176 Prewett, M. S., Johnson, R. C., Saboe, K. N., Elliott, L. R., & Coovert, M. D. (2010).
Managing workload in human-robot interaction: A review of empirical studies. Computers in Human Behavior, 26, 840–856. Ruff, H. A., Narayanan, S., & Draper, M. H. (2022). Human interaction with levels of automation and decision-aid fidelity in the supervisory control of multiple simulated unmanned air vehicles. Presence: Teleoperators and Virtual Environments, 11(4): 335–351 https://doi.org/10.1162/105474602760204264 Shively, R. J., Vu, K.-P. L., & Buker, T. J. (2013). Unmanned aircraft system response
to air traffic control clearances: Measured response. Proceedings of the Human Factors and Ergonomics Society Annual Meeting, 57(1), 31–35. https://doi.org/ 10.1177/1541931213571009 Suzuki, A. S., & Dao, Q. V. (2022, September). A flight replanning tool for terminal area urban air mobility operations. In 2022 IEEE/AIAA 41st Digital Avionics Systems Conference (pp. 1–7). IEEE. Young, S., Ancel, E., Moore, A., Dill, E., Quach, C., Foster, J., Darafsheh, K., Small-
ing, Vazquez, S., Evans, E., Okolo, W., Corbetta, M., Ossenfort, J., Watkins, J., Kulkarni, C., & Spirkovska, L. (2020). Architecture and information requirements to assess and predict flight safety risks during highly autonomous urban flight operations, NASA/TM-220440. https://ntrs.nasa.gov/citations/20200001140
LISTED IN THE AHFE DIGITAL BOOKSTORE CATALOGUE
Explore the complete digital volume
Application of Emerging Technologies
Read this individual research paper free through the original publisher, or explore the full digital proceedings book.
ISBN 978-1-958651-91-9
Explore this ISBN in the AHFE Bookstore ↗Listed in the July 2026 bookstore catalogue; search by ISBN to confirm current availability · Digital book purchase optional