Qianhui Shen, Jinyi Zhi, Zerui XIANG, Chunhui Jing, Ruizhen Li, Shu Feng, Xing Yao (2023). Factors Research of Visual Comfort on Driving Interfaces: A Review. In: Application of Emerging Technologies. AHFE Open Access, vol. 115, pp. 339–349. https://doi.org/10.54941/ahfe1004331
This paper analyses and summarizes the factors affecting visual comfort in the driving interface. Relevant factors affecting drivers' visual comfort are summarized, including three types of factors: user, interface and environment; useful indicators are proposed according to different influencing factors, such as gaze duration, pupil dilation and ICA increase when interface information increases. Finally, the proposed influencing factors are summarized and the problems and deficiencies in the assessment methods are analysed, pointing out the development direction of the visual comfort assessment of the interface in driving, and in view of the human-computer relationship included in the driving task, it is suggested to adopt a combination of subjective and objective assessment methods to improve the validity and robustness of the assessment of visual comfort of the driving interface. This paper can provide some references for the research on visual comfort of interfaces.
Driving Interface is the channel for human-machine interaction and exchange of information in equipment, and is the most important interface between human and system (Yao et al., 1988). It is widely used in aerospace, naviga- tion, rail transportation, engineering machinery and automobile cab (Li, Bo and Sui-Huai, 2016). Through the driving interface, drivers are able to mon- itor the internal and external information of the transportation and make decisions, but operating in a state of high physical and mental load for a long period of time will lead to brain fatigue and driving fatigue (Ueno et al., 2021; Christopher et al., 2021). According to the survey, most traffic acci- dents are caused by drivers checking the driving interface for a long time, and it is the development trend to improve the comfort of the driving inter- face. Because cockpit visual comfort has a direct impact on the driver, it may cause the driver to make wrong judgment and wrong operation (Xiaoli et al., 2015; Xiao, Wan-yan and Zhuang, 2014). The percentage of accidents caused directly or indirectly by driver observation of the driving interface is 70% to 80% in (China Wiegmann and Shappell 2001; Edkins and Pollock, 1997). The effect of interface visual comfort on drivers’ cognitive efficiency is rarely mentioned.
As an important physical factor in the driving process, the visual comfort of the driving interface becomes one of the important design factors when the driver monitors the driving interface for a long time. Therefore, it is necessary to conduct an in-depth study on the comfort of the driving interface to ensure the driver’s cognitive efficiency of the interface and to reduce the difficulty of the driving task.
Due to early technological and hardware limitations, there has been less research related to visual comfort in driving interfaces. The issue of visual comfort has been in interface display research for a long time, and the fac- tors research of visual comfort in driving interfaces may contribute to safely driving in the future.
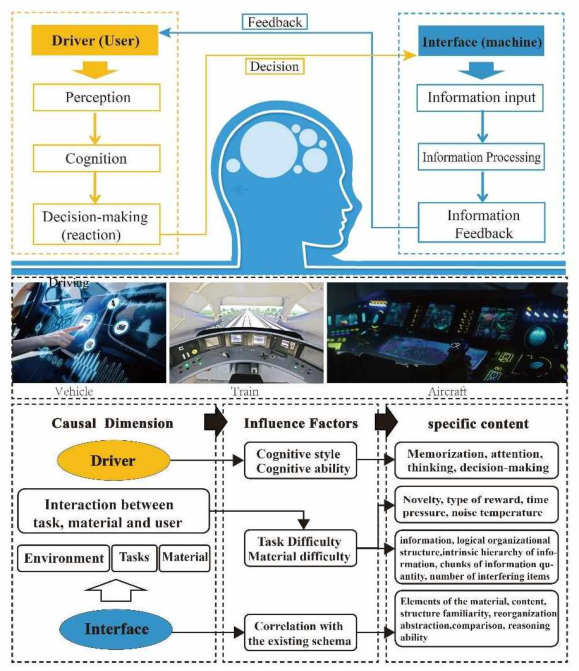
VISUAL COMFORT STUDY OF DRIVING INTERFACES There are two main ways for drivers to extract information, the first is the extraction of outdoor environment information; the second is the extraction of driving information in the cab (Deng et al., 2019). The human-computer interaction perception during driving is complex and variable (see Figure 1).
Figure 1: The perception process and influencing factors of human-computer interac- tion in driving interface.
Factors Research of Visual Comfort on Driving Interfaces: A Review 341
User perception and driving interface are the sources of influence on visual comfort of driving interface because drivers need to pay attention to the key information in the driving interface all the time, which results in cognitive load. The cognitive load structure model was firstly proposed by Pass (Paas et al., 1994), who divided the influence source of cognitive load into three aspects: task (environment) characteristics, learner characteristics, and the interaction between task and learner (Brunken et al., 2004) ; Qian-wen based on cognitive load structure (Qian-Wen, 2020), combined with the interface task and material characteristics, the user’s own characteristics, and the inter- action between the former two and the same as constituting the cognitive load of the human-computer interface influencing the factors. It is pointed out that the two parts that constitute the user’s cognitive driving interface are the extrinsic interface factors and the intrinsic user factors.
Therefore, the visual comfort of driving interface can be mainly influenced by three factors: user, driving interface and environment (see Figure 1). It is not widely recognized standard definition for the concept of comfort. In this paper, we define the visual comfort of the driving interface from the perspectives of physiological characteristics of the user and physical attributes of the interface, based on the interaction characteristics of the user and the driving interface during the driving process.
(1) Visual comfort is the absence of visual discomfort. Reid (Reid, 1974) proposes the term comfort as the absence of the subjective feeling of discomfort. In addition to this, there are other definitions of visual discomfort, for example, Lambooij (Lambooij et al., 2009) defined visual discomfort as subjective discomfort as well as visual fatigue, and reflected the quality of experience (QoE) of the user part; Quan Wei (Wei et al., 2018) explained visual discomfort from physiological and psychological levels specifically in the physiological indexes of pain and numbness as well as in the self-psychological feelings. (2) Visual comfort is a subjective human feeling. In terms of the definition of comfort in the U.S. Webster’s Dictionary, it is a state or feeling that is specifically manifested in the human physiological, psychological and physical dimensions, such as relaxation (relief), encouragement (encour- agement) and enjoyment (enjoyment) (Ueno et al., 2021; Kuijt-Evers et al., 2004). Thus, the visual comfort of the driving interface can be used to refer to the subjective comfort felt by the user when viewing the driving display. (3) Visual comfort is affected by a variety of factors, including internal psychological factors and external physical and physiological factors (Christopher et al., 2021; Lueder, 1983). Comfort and discomfort are subjective feelings that arise from the combination of physiological and psychological experiences, such as prolonged face-to-face screen opera- tion will reduce visual comfort, increase cognitive load, and cause visual and mental fatigue. (4) The basic condition for visual comfort is visual health. Comfort is a state of reaction between the individual and the environment- (Yu-Chen and Yun-Yi, 2022; Lange, 2019), and the definition of
visual comfort is specified in the European standard: “Visual com- fort is induced by the visual environment, for which visual health is a subjective condition” (Basic terms and criteria for specifying light- ing requirements, 2011). Visual comfort is especially important because the monitor needs to pay attention to the interface information at all times.
USER INFLUENCING FACTORS OF VISUAL COMFORT ON THE DRIVING INTERFACE User factors, as intrinsic factors affecting the visual comfort of the driving interface, include the user’s own physiological and psychological factors, which are specifically manifested in physical, psychological and conscious activities, among which visual fatigue and cognitive load are the main influencing factors.
(1) Fatigue is the most important factor on the psychological dimension of comfort (Pashler, 1998), which is an indicator of visual comfort (Jin, Niu and Zhou, 2016). Visual senses receive visual information through the human brain (Wei and Zhou, 2020). Visual comfort is used to evaluate the effect of lighting, display and products on visual fatigue of human eyes under the angle of optics from the perspective of human eye’s visual function, and it is the degree of comfort of human eyes to the stimulus feeling, which is a psychological feeling quantity (Ying, We and Jue, 2017), so it is difficult to measure it directly.
In addition to this, it has been well documented that important driving information, such as speed and navigation, can be provided to the driver directly within the driver’s field of view in a Horizontal View Display (HUD) (Wan and Tsimhoni, 2021).
(2) Cognitive load of the driver is closely related to the visual comfort of the driving interface (Qu, 2005). Cognitive load affects the allocation of a driver’s attention to a driving task (Reimer et al., 2010) and visual search (Jin, Niu and Zhou, 2016) and visual attention (Pashler, 1998) are com- monly used to study the effects of interfaces on a user’s cognitive responses. When the information content of an interface is cognitively overloaded for a driver, compensatory changes in attention and behavior may occur, resulting in changes in task prioritization (Redenbo, Lee and Ching, 2010; Gwizdka, 2010; Hong-Tao, 2018). In addition, the longer the interaction time, the higher the level of distraction when the driver is performing a cognitive task (Reyes et al., 2008); Instrument pointers, pointing directions, and character and scale display values also have an effect on driver cognition (Kai, 2014).
Therefore, subjective measures of cognitive load are commonly used in visual studies targeting driving interfaces. For example, the Vienna Psycho- logical Testing System (VTS) (Xiao-Feng et al., 2015) and the NASA-TLX scale present cognitive load questionnaires for assessing drivers’ mental performance abilities and screening good drivers.
Factors Research of Visual Comfort on Driving Interfaces: A Review 343
HMI INFLUENCING FACTORS OF VISUAL COMFORT ON THE DRIVING INTERFACE The pilot interface is an external factor that affects the visual comfort of driving. Civilian aircraft driving interface provides rich driving information through icons (Forster et al., 2017; Yoon et al., 2019). Visual comfort is affected by design factors such as brightness contrast, icons, symbols, text, colors and overall layout of the pilot interface.
(1) A large body of literature has investigated the effect of luminance contrast of text and background on visual comfort and performance in inter- active interfaces (HMIs), and the common denominator of the findings is that higher luminance contrast (An-Hsiang and Ming-Te, 2000)is associated with higher visual comfort and performance in terms of legibility (Ayama et al., 2007), and response time (Rea et al. 2016), search (Chin-Chuan and Kuo- Chen, 2013)and visual performance (An-Hsiang and Ming-Te, 2000; Ling and Schaik, 2002). The higher the luminance contrast, the better the visual comfort and performance.
(2) Some researchers gradually realized that complex graphic displays have an obvious impact on drivers’ visual comfort. Text display is important for drivers’ visual comfort, which can affect users’ browsing time (Reimer et al. 2014). Yang Man-Juan found that when there were more than three textual contrasts, the driver’s ability to discriminate significantly decreased (Man- Juan, Ling-tao and Sheng-heng, 2010). There have been more studies on the cognitive effects of Chinese character font glyphs (Derogatis and Cleary, 1977), for example, Character Fonts can be used as the best fonts for the black Chinese character logos on the control panels in the cockpit of the aircraft (Duan-Qin et al., 2014).
(3) Color is an important part of screen design, attracting human attention and affecting the performance of the user’s visual search in text (Zhao et al., 2004; Noiwan and Norcio, 2006). In engineering design, color regulation has a direct effect on human psychophysiology (Hong-Tao, 2018); improving atmosphere, reducing fatigue; improving safety and reducing the incidence of accidents, etc. (Rothermund et al., 2018; Song and Lei, 2011).
(4) The main interface layout factors are the interface components, the interface shape and the number of interface operation buttons. The over- all layout of the information content plays a key role in the design of the information display in the driver interface (Xiaoli et al., 2015). The interface layout factors (Chen and Chiang, 2011), the layout method (Li et al., 2017), the shape of the icon display panel (Chen and Chiang, 2011), the number of interface buttons (Feng, Liu and Chen, 2018), and the layout of interface icons (Moseley et al., 1986) all have a direct impact on the user’s visual com- fort. For instance, icons not only affect the user’s cognitive performance of the interface layout, but also the arrangement of the interface layout (Jin et al., 2021). (5) In recent years, it has been found that drivers facing but a single visual warning may result in longer reaction times (Morando et al., 2019). While driving, the interface provides feedback such as visual or tactile to the user. Zi-Hui proposed that dynamic and static interactions are applicable to different scenarios (Zi-Hui, Weiwei and Xiao-Yuan, 2020).
The above interface design factors in the human-computer collaboration task (Rainieri et al., 2021), which can be used to adjust the driving interface to optimize the display, can be further applied in enhancing the visual comfort of human-computer interaction.
LIGHT ENVIRONMENT FACTORS OF VISUAL COMFORT ON THE DRIVING INTERFACE Studies on the display content and lighting environment of the driver interface have analysed the extent to which interface environmental factors affect the visual function of the human eye (Moseley et al., 1986). Previous research on user light environments has aimed to assess specific aspects of visual comfort, such as the amount of available light, light uniformity, the quality of light for rendering colors, and predicting the risks of light environments, which reflect the relationship between human needs and light environments in the triad of human-mechanism-environment. Visual interactions in driving interfaces are mostly focused on icons and other means of providing driving information (Forster et al., 2017; Yoon et al., 2019). Display interfaces show a continuous trend of miniaturization, and how to effectively highlight information content is a key issue for interface displays (Carte and Silverstein, 2010).
Existing research on visual comfort of HMI (Human Machine Interface) mainly focuses on uncomfortable glare (Yuan-Peng et al., 2022) and visual fatigue (Hui-Juan et al., 2020). Physiological indicators and environmen- tal parameters are included in the assessment of uncomfortable glare, for example, the two physiological indicators that are highly correlated with the subjective evaluation of uncomfortable glare are eye movement veloc- ity and pupil diameter (Yan-Dan et al., 2015). Environmental parameters such as illuminance (Shieh and Lin, 2000), glare index, and luminance metrics are commonly evaluated for uncomfortable glare, while other stud- ies on the effects of ambient light have investigated on-screen readability (Wang et al., 2017). In addition, some studies have evaluated factors such as light level (Saito et al., 1997) that affect the user’s visual comfort. Li-Chen Ou et al. investigated the effect of text background luminance difference on visual comfort (Ou et al., 2015), the visual comfort of a light background under a display screen with a display luminance of 551.8 cd/m2 increases with increasing luminance difference, and conversely, the best visual comfort can be obtained when there is a moderate luminance difference in a dark background.
CONCLUSION
Visual comfort of driving interface is becoming a critical piece of complex systems to help resolve system designs. This paper summarizes the influenc- ing factors of visual comfort in driving interface, and points out the research direction of visual comfort in human-machine interface. From the above description, it is clear that there are some urgent problems that need to be explored in the research of visual comfort of driving interface.
Factors Research of Visual Comfort on Driving Interfaces: A Review 345
From the assessment point of view, as a subjective feeling, visual comfort is difficult to be directly converted. Because the combination of subjective and objective measurements should be considered (Brouwer et al., 2014). In addition to the subjective-objective combination of experimental approaches, dual objective experimental paradigms can achieve better detection effects, such as combining visual tasks with EEG detection (Cheng Luo et al., 2020).
There is no standardized method to measure the visual comfort of an inter- face display for the assessment of visual comfort. Comfort is a subjective human feeling (Christopher et al., 2021). Driving is not only a physical task, but also a psychological one (Wan and Tsimhoni, 2021). Therefore, it is nec- essary to combine both subjective and objective perspectives to evaluate the visual comfort of driving interfaces.For example, Rainieriet combined psy- chometric (NASA-TLX) and eye-tracking instrument to record data (Rainieri et al., 2021); Kay Cuiused the eye-tracking instrument and the ASQ Subjec- tive scale measurements as objective and subjective indicators of the effect of visual attention on visual comfort (Hong-Tao, 2018). These studies pro- vide useful directions for exploring the visual comfort research of related indicators on the driving interface.
According to existing studies, current visual comfort evaluation metrics for driving interfaces have some limitations in real scenario applications. For complex driving tasks, physiological metrics for a single airplane or car need to be verified by further experiments. Besides, for the lack of clarity in the definition, the division of the influencing factors, and the selection of the eval- uation indexes to bring about the insignificant effect of the interface design, the above issues need to be further explored.
ACKNOWLEDGMENT
We gratefully acknowledge the financial support from the National Key R&D Program of China (Grant No. 2022YFB4301201; 2022YFB4301202; 2022YFB4301203), and the National Natural Science Foundation of China (Grant No. 52175253).
REFERENCES
An-Hsiang, W. and Ming-Te, C. (2000). Effects of polarity and luminance contrast on visual performance and VDT display quality, International Journal of Industrial Ergonomics, Volume 25 No. 4, pp. 415–421. Ayama, M, ed. (2007). Effects of contrast and character size upon legibility of
Japanese text stimuli presented on visual display terminal, Optical Review, Volume 14 No. 1, pp. 48–56. Basic terms and criteria for specifying lighting requirements. (2011). Light and lighting - Basic terms and criteria for specifying lighting requirements; German version EN 12665:2011. Brouwer, A. M, ed. (2014). Evidence for effects of task difficulty but not learn-
ing on neurophysiological variables associated with effort. International jour- nal of psychophysiology: official journal of the International Organization of Psychophysiology, Volume 93 No. 2, pp. 242-52. Brunken, ed. (2004). Assessment of cognitive load in multimedia learning with dualtask methodology: auditory load and modality effects, Experimental Psychology, 32(1-2), pp. 115–132.
Carter, R. and Silverstein, L. (2010). Size matters: Improved color-difference estimation for small visual targets, Journal of the Society for Information Display, Volume 18 No. 1, pp. 17–28. Chen, C. H. and Chiang, S. Y. (2011). The effects of panel arrangement on search
performance, Displays, Volume 32 No. 5, pp. 254–260. Cheng Luo, A, ed. (2020). Visual target detection in a distracting background relies on neural encoding of both visual targets and background, NeuroImage, p. 216. Chin-Chiuan, L. and Kuo-Chen, H. (2013). Effects of ambient illumination con-
ditions and background color on visual performance with TFT-LCD screens, Displays, Volume 34 No. 4, pp. 276–282. Christopher, D, ed. (2021). Engineering Psychology and Human Performance.
Routledge. Deng, T, ed. (2019). How do drivers allocate their potential attention? driving fixation prediction via convolutional neural networks, IEEE Transactions on Intelligent Transportation Systems, 21(5), pp. 2146–2154. Derogatis, L. R. and Cleary, P. A. (1977). Confirmation of the dimensional struc-
ture of the scl-90: a study in construct validation, Journal of Clinical Psychology, Volume 33 No. 4, pp. 981–989. Duan-Qin, X, ed. (2014). A study of pilots’ visual preference for bold Chinese character glyphs, Ergonomics, Volume 20 No. 1, pp. 45–46. Edkins, G. D. and Pollock, C. M. (1997). The influence of sustained attention on
railway accidents, Accident Analysis and Prevention, 29(4), pp. 533–539. Feng, F., Liu, Y. and Chen, Y. (2018). Effects of quantity and size of buttons of in-vehicle touch screen on drivers’ eye glance behavior, International journal of human-computer interaction, Volume 34 No. 10, pp. 1105–1118. Forster, Y, ed. (2017). Driver compliance to take-over requests with different auditory
outputs in conditional automation, Accident Analysis and Prevention, Volume 109, pp. 18–28. Gwizdka and Jacek. (2010).”Distribution of Cognitive Load in Web Search”, Journal of the American Society for Information Science and Technology, Volume 61 No. 11, pp. 2167–2187. Hong-Tao, W, ed. (2018). A novel real-time driving fatigue detection system based
on wireless dry EEG, Cognitive Neurodynamics, Volume 12 No. 4, pp. 365–376. Hui-Juan, T, ed. (2020). Research on visual comfort evaluation method of VDT based on pupil diameter, Advances in Lasers and Optoelectronics, Volume 57 No. 15, pp. 300–306. Jin, T., Niu, Y. and Zhou, L. (2016). Cognitive mechanism of warning icons under
different working loads, Journal of Southeast University (Natural Science Edition) Volume 46 No. 6, pp. 1204–1208. Jin, T, ed. (2021). Influence mechanism of icon layout in visual search, Journal of Northeastern University: Natural Science Edition, Volume 42 No.11, p. 6. Kai, C. (2014). The analysis of the cockpit display interface’s color effects on novice
drivers’ visual pre-attentive progress, Ergonomics, Volume 20 No. 2, pp. 35–40. Kuijt-Evers, L, ed. (2004). Identifying factors of comfort in using hand tools. Applied Ergonomics, 35(5), pp. 453–458. Lambooij, M, ed. (2009). Visual discomfort and visual fatigue of stereoscopic dis-
plays: a review. Journal of Imaging Science and Technology, 53(3), pp. 30201–1- 30201-14(14). Lange, P, ed. (2019). Comparison of local equivalent temperatures and subjective thermal comfort ratings with regard to passenger comfort in a train compartment, IOP Conference Series: Materials Science and Engineering, 609(3).
Factors Research of Visual Comfort on Driving Interfaces: A Review 347
Li, D., Bo, C., and Sui-Huai, Y. (2016). Hra evaluation of interior environmental of cabin based on analytic hierarchy process and grey correlation analysis. Computer Engineering and Applications, 52(1), pp. 260–265. Li, R, ed. (2017). Effects of interface layout on the usability of in-vehicle information
systems and driving safety, Displays, Volume 49, pp. 124–132. Ling, J. and Schaik, P. V. (2002). The effect of text and background colour on visual search of web pages, Displays, Volume 23 No. 5, pp. 223-230. Lueder, R. K. (1983). Seat comfort: a review of the construct in the office environ-
ment, Human Factors, 25(6), p. 701. Man-Juan, Y., Ling-Tao, W. and Sheng-Heng, T. (2010). Research on the influence of foreign language characters on visual recognition in road signs, Highway Traffic Science and Technology, Volume 27 No. 9, p. 126. Morando, ed. (2019). A Reference Model for Driver Attention in Automa-
tion: Glance Behavior Changes During Lateral and Longitudinal Assistance, IEEE Transactions on Intelligent Transportation Systems, Volume 20 No. 8, pp. 2999–3009. Moseley, M. J, ed. (1986). Effects of display vibration and whole-body vibration on visual performance, DISPLAYS, Volume 34 No. 8, pp. 977–983, Noiwan, J. and Norcio, AF. (2006). Cultural differences on attention and perceived
usability: Investigating color combinations of animated graphics, International Journal of Human-Computer Studies, Volume 64 No. 2, pp. 103–122. Ou, L, ed. (2015). Visual comfort as a function of lightness difference between text and background: a cross-age study using an lcd and a tablet computer, Color Research and Application, Volume 40 No. 2, pp. 125–134. Paas, ed. (1994). Variability of worked examples and transfer of geometrical
problem-solving skills: a cognitive-load approach, Journal of Educational Psy- chology, 86(1), pp. 122–133. Pashler, H. E. (1998). The psychology of attention, Trends in Neurosciences Volume 21 No. 6, pp. 271–271. Qian-Wen, F. (2020). Research on Optimization Method of VR Task Scenario
Resources Driven by User Cognitive Needs, Information, 11(2). Qu, Z. S, ed. (2005). Effects of digital information display time on human and machines monitoring performance, Space Medicine & Medical Engineering Volume 18 No. 3, p. 191. Rainieri, G, ed. (2021). Visual Scanning Techniques and Mental Workload of
Helicopter Pilots During Simulated Flight, Aerospace Medicine and Human Performance, Volume 92 No. 1, pp. 11–19. Rea, M, ed. (2016). Visual performance using reaction times, Lighting research and technology, Volume 20 No. 4, pp. 139–153. Redenbo, S., Lee J. and Ching, Y. (2010). Effects of cognitive and perceptual loads
on driver behavior, Transportation Research Record, Volume 2140 No. 2138, pp. 20–27. Reid, B. (1974). An annotated bibliography of United States Air Force applied physical anthropology : Reid, B. Bibliography Jan, 1946- May 1973, 66pp; Government Reports Announcements (Report No. AD-762 287), Applied Ergonomics, 5(2), pp. 104–105. Reimer, B, ed. (2010). The Impact of Systematic Variation of Cognitive Demand
on Drivers’ Visual Attention across Multiple Age Groups. Proceedings of the Human Factors and Ergonomics Society Annual Meeting Volume 54 No. 24, pp. 2052–2055.
Reimer, B, ed. (2014). Assessing the impact of typeface design in a text-rich automotive user interface, Ergonomics, Volume 57 No. 11, pp. 1643–1658. Reyes, M, ed. (2008). Effects of cognitive load presence and duration on driver
eye movements and event detection performance, Transportation Research Part F Traffic Psychology & Behaviour, Volume 11 No. 6, pp. 391–402. Rothermund, K, ed. (2018). Three decades of Cognition & Emotion: A brief review of past highlights and future prospects, Cognition and Emotion, Volume 32 No. 1, pp. 1–12. Saito, S, ed. (1997). Ergonomic evaluation of working posture of VDT operation
using personal computer with flat panel display, Industrial Health, Volume 35 No. 2, pp. 264–270. Shieh, K. and Lin, C. (2000). Effects of screen type, ambient illumination, and color combination on VDT visual performance and subjective preference, International Journal of Industrial Ergonomics, Volume 26 No. 5, pp. 527–536. Solovey, E. T, ed. (2012). Brain: Enhancing Interactive Systems with Streaming FNIRS
Brain Input, CHI’12 Proceedings of the 2012 ACM annual conference on Human Factors in Computing Systems, ACM. Song, L. and Lei, M. (2011). Exploration of the effect of color on cognitive tasks and its mediating factors, Song Lu[C]//Enhancing the consciousness and function of psychology to serve the society-A collection of abstracts from the 90th anniversary of the founding of the Chinese Psychological Association and the 14th National Psychology Academic Conference, p. 240. Ueno, S, ed. (2021). Evaluating Comfort in Fully Autonomous Vehicle Using Bio-
logical Emotion Map. In: Stanton, N. (eds) Advances in Human Aspects of Transportation. AHFE 2021. Lecture Notes in Networks and Systems, vol. 270. Springer, Cham. Wan, J. and Tsimhoni, O. (2021). Effects of luminance contrast and font size on dualplane head-up display legibility (“The Double 007 Rule for HUDs”), Journal of the Society for Information Display Volume 29 No. 5, pp. 328–341. Wang, Y, ed. (2017). A model for evaluating visual fatigue under LED light
sources based on long-term visual display terminal work, Lighting Research and Technology, Volume 50 No. 5, pp. 729–738. Wei, H. and Zhou, R. (2020). High working memory load impairs selective attention: EGG signatures, Psychophysiology, 57(11). Wei, Q, ed. (2018). Comfort evaluation model based on region of interest and
contrast of stereo images, Guangzi Xuebao Acta Photonica Sinica, 47(12), p. 1210002. Wiegmann, D. A. and Shappell, S. A. (2001). Human error analysis of commercial aviation accidents: application of the Human Factors Analysis and Classifica- tion system (HFACS), Aviation, space, and environmental medicine, 72(11), pp. 1006–1016. Xiao, X., Wan-Yan, X., and Zhuang, D. (2014). Human-rating design of visual
coding based on the airworthiness requirements, Procedia Engineering, 80, pp. 93–100. Xiao-Feng, H, ed. (2015). Research on the measurement method of driver’s cognitive load under multi-source information, China Safety Science Journal, Volume 25 No. 12, pp. 34–39. Xiao-Li, F, ed. (2015). Principle of plane display interface design based on visual
search, Journal of Beijing University of Aeronautics and Astronautics, 41(2), pp. 216–221.
Factors Research of Visual Comfort on Driving Interfaces: A Review 349
Xiaoli, F, ed. (2015). Principles of aircraft display interface design based on visual search, Journal of Beijing University of Aeronautics and Astronautics, Volume 41 No. 2, pp. 216–221. Yan-dan, L, ed. (2015). Eyes Movement and Pupil Size Constriction Under Discom-
fort Glare, Investigative Ophthalmology and Visual Science, Volume 56 No. 3, pp. 1649–1656. Yao, W, ed. (1988). American National Standard for human factors engineering of visual display terminal workstations : Human Factors Society The Society, Applied Ergonomics Volume 20 No. 2, pp. 145–145. Ying, J., Jun, H., Wei, W. and Jue, Q. U. (2017). An objective description method
of visual comfort for VDT display interface, Journal of Central South University (Science and Technology) Volume 48 No. 1, pp. 77–83. Yoon, S. H, ed. (2019). The effects of takeover request modalities on highly automated car control transitions, Accident Analysis and Prevention, Volume 123 No. Feb, pp. 150–158. Yuan-Peng, G, ed. (2022). Investigation on the current situation of cockpit light envi-
ronment in helicopter with intelligentization as the target orientation, Journal of Lighting Engineering, Volume 33 No. 1, p. 8. Yu-Chen, Y. and Yun-Yi, J. (2022). A Review on Human Comfort Factors, Measurements, and Improvements in Human-Robot Collaboration, Sensors, 22(19). Zhao, H, ed. (2004). Sonification of Geo-Referenced Data for Auditory Information
Seeking: Design Principle and Pilot Study[C]/ ICAD 2004: The 10th Meeting of International Conference on Auditory Display, Sydney, Australia, July 6-9, DBLP. Zi-Hui, G., Weiwei, G. and Xiao-Yuan, T. (2020). Analysis of eye movement characteristics and behavior of drivers taking over self-driving vehicles, Chinese Journal of Safety Science, Volume 32 No.1, pp. 65–71.
LISTED IN THE AHFE DIGITAL BOOKSTORE CATALOGUE
Explore the complete digital volume
Application of Emerging Technologies
Read this individual research paper free through the original publisher, or explore the full digital proceedings book.
ISBN 978-1-958651-91-9
Explore this ISBN in the AHFE Bookstore ↗Listed in the July 2026 bookstore catalogue; search by ISBN to confirm current availability · Digital book purchase optional