Nico Rabethge, Dominik Bentler (2023). Measuring the Impact of Picture-Based Explanations on the Acceptance of an AI System for Classifying Laundry. In: Artificial Intelligence, Social Computing and Wearable Technologies. AHFE Open Access, vol. 113, pp. 77–87. https://doi.org/10.54941/ahfe1004181
Artificial intelligence (AI) systems have increasingly been employed in various industries, including the laundry sector, e.g., to assist the employees sorting the laundry. This study aims to investigate the influence of image-based explanations on the acceptance of an AI system, by using CNNs that were trained to classify color and type of laundry items, with the explanations being generated through Deep Taylor Decomposition, a popular Explainable AI technique. We specifically examined how providing reasonable and unreasonable visual explanations affected the confidence levels of participating employees from laundries in their respective decisions. 32 participants were recruited from a diverse range of laundries, age, experience in this sector and prior experience with AI technologies and were invited to take part in this study. Each participant was presented with a set of 20 laundry classifications made by the AI system. They were then asked to indicate whether the accompanying image-based explanation strengthened or weakened their confidence in each decision. A five-level Likert scale was utilized to measure the impact, ranging from 1 (strongly weakens confidence) to 5 (strongly strengthens confidence). By providing visual cues and contextual information, the explanations are expected to enhance participants' understanding of the AI system's decision-making process. Consequently, we hypothesize that the image-based explanations will strengthen participants' confidence in the AI system's classifications, leading to increased acceptance and trust in its capabilities. The analysis of the results indicated significant main effects for both the quality of explanation and neural network certainties variables. Moreover, the interaction between explanation quality and neural network certainties also demonstrated a notable level of significance.The outcomes of this study hold substantial implications for the integration of AI systems within the laundry industry and other related domains. By identifying the influence of image-based explanations on acceptance, organizations can refine their AI implementations, ensuring effective utilization and positive user experiences. By fostering a better understanding of how image-based explanations influence AI acceptance, this study contributes to the ongoing development and improvement of AI systems across industries. Ultimately, this research seeks to pave the way for enhanced human-AI collaboration and more widespread adoption of AI technologies. Future research in this area could explore alternative forms of visual explanations, to further examine their impact on user acceptance and confidence in AI systems.
The advancement of artificial intelligence has introduced numerous appli- cations across various industries, and the laundry industry is no exception. Automated sorting of laundry based on color, type, material and soiling is a challenging and demanding task, often imposing substantial mental and phys- ical stress on human operators, as it requires significant effort and resilience against disgust and stress (Rabethge and Kummert, 2023). Convolutional Neural Networks (CNNs) have emerged as powerful tools for automating such classification tasks. However, the black-box nature of CNNs often raises concerns regarding their transparency and user acceptance (Brasse et al., 2023; Xu et al., 2019). To address these concerns, providing explanations for the decisions made by AI systems has gained increasing attention. Explanations can help users to understand the underlying reasoning and thereby increase their trust in the AI system’s decisions. In the context of laundry sorting, image-based explana- tions offer a promising approach to provide users with a visual representation of the classification process, fostering transparency and acceptance.
This publication presents a study, which utilizes a diverse sample of par- ticipants consisting of laundry employees, who are directly involved in the sorting process. Their perspectives and experiences are crucial in evaluating the efficacy of image-based explanations in real-world scenarios. By focus- ing on this target group, we aim to provide insights into the acceptance and usability of AI systems for laundry sorting, as perceived by those who will interact with the technology daily.
The key research objective of this study is to measure the impact of image- based explanations on user acceptance of CNNs for laundry sorting. We hypothesize that providing users with visual explanations will enhance their understanding of the classification process, increase their trust in the AI sys- tem’s decisions, and ultimately improve their acceptance of the technology. To measure this impact, participants evaluated a series of laundry classifica- tions made by the CNN, indicating their acceptance level and trust in each decision.
RELATED WORK
The black-box nature of AI systems has raised significant concerns and limita- tions, particularly in domains where the stakes are high and critical decisions are made, as it makes AI decisions and predictions non-transparent to the user (Xu et al., 2019; Förster et al., 2020; Rai, 2020; Ribeiro, Singh and Guestrin, 2016). Industries such as healthcare, finance, and autonomous vehicles require AI models that can be thoroughly explained and understood to inspire confidence, establish accountability, and ensure safety. In scenar- ios where AI systems are responsible for assisting human decision-making, the inability to provide transparent explanations can lead to user scepticism, hindering the adoption and acceptance of these technologies. Furthermore, it prevents understanding of the underlying mechanisms which are required to identify and eliminate undesirable results.
Measuring the Impact of Picture-Based Explanations on the Acceptance 79
The rapid proliferation of AI has given rise to the field of explainable AI in response to the pressing need for transparency and interpretability. With AI systems becoming more pervasive and influential, the demand for comprehensible decision-making processes has gained significant attention. Explainable AI strives to overcome the black-box nature of AI models, enabling users to understand how decisions are made, instilling trust, and facilitating responsible and informed AI deployment. This is also supported by various governments and parliaments (European Commission, 2020; The White House, 2022).
Several approaches have been proposed to address the issue of AI black- box systems, focusing on improving interpretability and explainability. In case of image classification, post hoc interpretability methods, such as Deep Taylor Decomposition (DTD) (Montavon, 2017) and Layer-Wise Relevance Propagation (LRP) (Montavon, 2019) attempt to shed light on the decision-making process by visualizing the relevance of each pixel for the final decision.
There are several studies that provide evidence on the impact of XAI in experimental settings. For instance, Binns et al., (2018) observed justice per- ceptions, Dodge et al., (2019) fairness, Lai and Tan (2019) perception as a human-AI team, Hohman et al., (2019) increased usability, several publica- tions (Kim, Khanna and Koyejo, 2016; Lim, Dey and Avrahami, 2009; Rader, Cotter and Cho, 2018) increased understanding of the model and various studies (Cai, Jongejan and Holbrook, 2019; Cheng et al., 2019; Kaur et al., 2020) a positive impact on trust and understanding. Moreover, Meske and Bunde (2022) and Hamm et al., (2023) found several positive effects of XAI like perceived ease of use, perceived usefulness, intention of use, perceived informativeness and trustworthiness.
Despite these efforts, achieving complete transparency in AI systems with- out compromising performance remains an ongoing challenge. Striking a delicate balance between interpretability and accuracy is essential for wide- scale adoption and acceptance of AI technologies in critical applications. The scientific community continues to investigate novel approaches and method- ologies to create more transparent AI systems that provide comprehensive and meaningful explanations, ultimately fostering acceptance, accountability, and reliability of AI-driven decision-making processes.
HYPOTHESES This research focuses on the calibration of trust (Bussone, Stumpf and O’Sullivan, 2015) in an AI system using an image-based explanation tech- nique. The sole use of explanations should not blindly increase trust. Users should use the created opportunity to better comprehend the system and also verify whether the learned mechanisms make sense. If the explanation is plausible, understandable and transparent, trust should increase (Adadi and Berrada, 2018), because humans tend to trust systems, they are able to understand (Arrieta et al., 2020). Accordingly, we hypothesize that:
Hypothesis H1: Plausible explanations provided by an AI system during the decision-making process will lead to a higher level of perceived trust among users.
80 Rabethge and Bentler
Moreover, we want to make sure that the display of explanations does not blindly increase trust. Ullrich, Butz and Diefenbach (2021) observed that users have inappropriate overtrust in intelligent systems. This phe- nomenon is also often further reinforced by the use of hard targets (Müller, Kornblith and Hinton, 2019). Furthermore, there are several cases where explanations unveiled working, but not resilient mechanisms. E.g., Huskies being classified as wolves, if no snow is present (Ribeiro, Singh and Guestrin, 2016) or detecting horses by recognizing a specific source tag (Lapuschkin, 2019). Due to data bias neural networks might learn to use and therefore rely on context instead of the main object of reason. Conse- quently, it is important to still be aware. In such cases users might identify sources of error and provide data for further model training to eliminate such errors. Thus, we want to investigate the extent to which users behave with different network certainties when explanations are unplausible. And there- fore, test whether the explanations do not always raise the perceived trust. Unplausible explanations should result in a decreased level of trust. So, we hypothesize that.
Hypothesis H2: Unplausible explanations provided by an AI system during the decision-making process will lead to a lower level of trust among users compared to plausible explanations.
METHODS
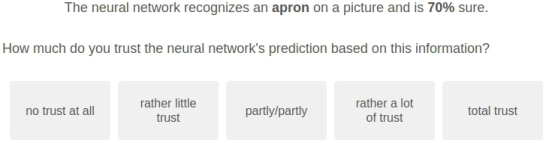
Experimental Design To test the explanations provided by our system, we carried out an exper- imental study. We developed a dashboard with an AI component to assist participants classifying the wash color and type of laundry items. Wash color is the color-coding used to indicate how different types of laundry should be sorted before wash. Participants in the control group were able to use the dashboard as shown in Fig. 1. This version gives information about the clas- sification result and the network certainty. The probabilities provided for the network certainty were randomly drawn in advance from a range of 10 to 100%. The minimum was set at 10% as it is the lowest possible maximum with 10 different classes given for the wash color. Since we used the same set of probabilities for both categories and only changed the order each time, the minimum probability for the type is also 10%.
Figure 1: Dashboard for the control group with the classification results and the associ- ated network certainty. Below, participants can select their level of confidence in each decision.
Measuring the Impact of Picture-Based Explanations on the Acceptance 81
For the treatment group, the dashboard additionally included an XAI com- ponent, which shows the relevance of each input pixel for the prediction using a heatmap (see Table 1). We deliberately showed neither the control nor the treatment group the input image to eliminate the possibility of cheating.
Table 1 shows a selection of the randomly chosen explanations generated using Deep Taylor Decomposition. During the survey, the same number of decisions regarding the classification task as well as our assessment of the quality were shown. As we used the same set of probabilities for both classifi- cation tasks, we were able to provide one good as well as one bad explanation for each probability. We classified explanations as bad if those do not show plausible characteristics/areas for a specific classification.
Table 1. Two exemplary explanations for each combination of explanation quality and category. The heatmap depicts the relevance of each, where red corresponds to high, yellow medium and green low relevance for the final classification.
Table available in the original PDF paper.
Bad Explanations Good Explanations Type a b c d
Wash Color e f g h
Explanation a shows only a label and b a collar, neither of which is a clear indicator of a specific class. In contrast, explanation c shows the outline as well as the bands of an apron and explanation d shows the clear outline of a pair of trousers.
When identifying the wash color, it is useful to find the area of the entire piece of laundry and identify the relevant color. Explanation e shows that the
82 Rabethge and Bentler
white connecting piece of the conveyor belt was used here, i.e. the piece of laundry was possibly not detected by the neural network. This is probably the same case for f, except that the gray conveyor belt was used here. In contrast, explanations g and h show that the area of the entire laundry pieces was used and thus at least the basis for the decision is correct.
Experimental Task In our experiment each participant was first shortly briefed about the AI system and which data was used for its training. Additionally, we hinted that a 10% certainty of the system could be interpreted as guessing and 100% as absolute certainty. Furthermore, two explanation heatmaps and input data were presented to aid in understanding the color encoding and task explanation.
Each participant was presented with a set of 20 laundry classifications made by the AI system. First, 10 explanations of the type classification and then 10 of the wash color classification. They were then asked to indicate whether the presented information strengthened or weakened their confi- dence in each decision. A five-level Likert scale was utilized to measure the impact, ranging from 1 (strongly weakens confidence) to 5 (strongly strengthens confidence).
The AI component in the background was a CNN (LeCun et al., 1989), which is state of the art for image-based classification applications. Using the softmax activation function for the final layer of the network the output is normalized to a probability distribution over the predicted output classes. The model achieved an accuracy greater than 0.96 on test data for both categories (Rabethge and Kummert, 2023).
To overcome the black-box character of the trained CNNs we explored various image-based explanation techniques. Beginning with an occlusion- based analysis (Zeiler and Fergus, 2014), we also considered gradient- based techniques such as Layer-Wise Relevance Propagation or Deep Taylor Decomposition and feature visualization methods (Olah et al., 2017). For this study, we limited ourselves to one strategy. Using gradient-based approaches, we were able to explain each classification and its foundation in one picture without showing the original input. We finally chose DTD over LRP for generating explanations because they were significantly easier to understand.
Sample The survey was conducted in 2023. We collected data from 32 participants (14 control group, 18 treatment group). Participation was voluntary and rewarded with non-monetary recognition in the form of sweets and usb- sticks. We drew a random number to assign participants to one of the two experimental conditions. This random variable was drawn independently for each participant. The presentation of the 20 AI decisions was also random- ized for each of the classification targets to avoid unwanted effects (e.g., learning effects) due to the order of the images.
Measuring the Impact of Picture-Based Explanations on the Acceptance 83
Of all participants, 50.00% were employees in industrial laundries and 50.00% were employees of a company constructing such systems. Three dif- ferent companies and organizations participated in the survey. There were significantly more men (68.75%) than women (31.25%) and zero diverse people. The average age of the participants was approximately 39.97 years and ranging from 18 to 62.
The subjects had been working for their company for an average of 11.46 years. The participants are distributed across various functional areas, with most respondents working in the areas of textile, engineering and production.
RESULTS
The data analysis was conducted with the software SPSS 28. For the cal- culation of the analyses, the mean values were investigated via T-Test and General Linear Models. At the beginning it was checked whether there are differences in the trust in the neural network’s decisions based on the presentation of visual material. The confidence of the participants does not differ depending on whether pictures are presented to them or not (Mwithout Picture = 2.86, SDwithout Picture = 0.39; Mwith Picture = 2.93, SDwith Picture = 0.60; t(30) = −0.38, p.71, d −0.14, 95% CI [−0.83, 0.57]).
Subsequently, it was checked whether the level of confidence differs with respect to the quality of the explanations. If the explanations for the neural network were good or comprehensible, the trust is signifi- cantly higher compared to bad explanations (MGood Explanations = 3.64, SDGood Explanations = 0.54; MBad Explanations = 2.22, SDBad Explanations = 0.81; t(17) = 8.73, p <.001, d 2.06, 95% CI [1.22, 2.88]). Thus, we can con- firm the hypothesis that there is a main effect of explanation quality. Good and comprehensible explanations are trusted significantly more than poor explanations.
Furthermore, a main effect for the certainty in the neural network’s deci- sion could be found. Provided that the neural network is certain in the decision with > 50%, the decisions are trusted significantly more than deci- sions with < 50% certainty (M> 50% = 3.36, SD> 50% = 0.60; M< 50% = 2.44, SD< 50% = 0.70; t(31) = 6.45, p <.001, d 1.14, 95% CI [0.69, 1.58]).
Finally, the interaction of explanation quality and certainty of the decision was tested. Again, significant differences in scores were found, F(1, 17) = 40.35, p < .001. Table 2 shows the mean values.
Table 2. Mean values and standard deviation for each pair of explanation quality and certainty level.
Table available in the original PDF paper.
Bad Explanations Good Explanations Certainty < 50% M 1.97, SD 0.87 M 3.40, SD 0.75 Certainty > 50% M 2.47, SD 0.86 M 3.88, SD 0.67
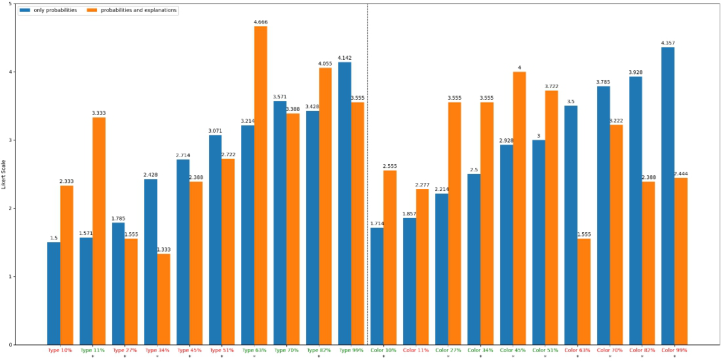
Fig. 2 shows the mean value of the Likert scale (1-5) for every item. 16 out of 20 items had the predicted effect on perceived trust.
84 Rabethge and Bentler
Figure 2: Likert Scale (1-5) means of the perceived trust of the type (left) and wash color (right) classifications without explanations (blue) and with explanations (orange), sorted by network certainty. The color of the labels indicates our assessment of the explanation quality (red – bad, green – good). If the assessment matches with the actual change in the mean, the label is marked with an *.
DISCUSSION
Hypothesis (H1) assumed that XAI has a higher degree of perceived trust if the explanations indicate plausible decision-making strategies of the AI com- ponent. We found support for this hypothesis. Furthermore, we found that the main effect for the network certainty variables as well as the interaction between them and the explanation quality is significant. This is in line with previous literature including the study by David, Resheff and Tron (2021) which reported that participants have higher levels of trust when AI systems have feature- and performance-based explanations. The second hypothesis (H2) predicted lower degree of perceived trust if unplausible explanations are presented, which was also confirmed in this study. We conclude that XAI indeed leads to higher levels of perceived trust, if it learns valid and reliable features. Additionally, it was shown that users are attentive and perceived trust may decrease if explanations are not conclusive.
During the survey we found that the interpretation of the heatmaps was difficult for a few participants. Possible causes are lack of technical under- standing or understanding of the task in general. When assessing the color classification, it was noted a few times that the color cannot be recognized in contrast to the characteristic parts in the type classification. Accordingly, it was not always understood that certainty should be drawn from the identifi- cation of a meaningful region. Since we want to test the intuitive perception of the system, we only explained the colorization of the heatmaps briefly. Here it would be useful to find an introduction, which, however, does not influence the participants. This was also particularly noticeable for explana- tions that are plausible for certain subclasses but cannot be generalized to the
Measuring the Impact of Picture-Based Explanations on the Acceptance 85
entire dataset. For example, in the case of sweaters from a specific supermar- ket chain, the brand logo is a clear indicator of the color, as they are always, for instance, red. In case that, contrary to all expectations, a different color is associated with this logo, retraining would be necessary. It would have been better if only the color had been used from the beginning. It is evident that not every explanation can be easily categorized as either good or bad. The classification is not flawless. This is also observable in Fig. 2, where some explanations have a stronger impact on perceived trust than others.
CONCLUSION
In conclusion, this experimental study in a real-world industrial setting has provided compelling insights into the pivotal role of visual explanations in shaping users’ perceptions and trust in AI systems. The analysis of the results has illuminated the influential impact of both explanation quality and the information about network certainty conveyed. The observed significant main effects for these variables underscore their individual contributions to users’ comprehension and trust-building processes.
Furthermore, the identified interaction effect between explanation quality and network certainty unveils a nuanced relationship that deepens our under- standing of how users perceive and respond to AI explanations. The finding that good explanations engender heightened levels of perceived trust while poor explanations diminish it underscores the critical importance of crafting clear, informative, and engaging visual explanations.
These findings hold practical implications for the design and deployment of AI systems. By recognizing the power of effective visual explanations in influencing trust perceptions, developers and designers can enhance user experiences and encourage informed interactions with AI.
In essence, this study serves as a valuable contribution to the burgeon- ing field of AI-human interaction. It highlights the symbiotic relationship between explanation quality, information density, and perceived trust, paving the way for more informed design choices and strategies that foster positive user engagement with AI systems. As technological advancements continue to shape our interactions with AI, the insights from this study will support the development of more transparent, comprehensible, and trustworthy AI systems.
REFERENCES
Adadi, A. and Berrada, M. (2018) ‘Peeking inside the black-box: A survey on explainable artificial intelligence (XAI)’, IEEE Access, 6, pp. 52138–52160. Arrieta, A. B. et al. (2020) ‘Explainable artificial intelligence (XAI): Concepts,
taxonomies, opportunities and challenges toward responsible AI’, Information Fusion, 58, pp. 82–115. Binns, R. et al. (2018) “It’s Reducing a Human Being to a Percentage’ Perceptions of Justice in Algorithmic Decisions’, Proceedings of the 2018 Chi conference on human factors in computing systems, pp. 1–14. Brasse, J. et al. (2023) ‘Explainable artificial intelligence in information systems: A
review of the status quo and future research directions’, Electron Markets, 33(26).
86 Rabethge and Bentler
Bussone, A., Stumpf, S. and O’Sullivan, D. (2015) ‘The role of explanations on trust and reliance in clinical decision support systems’, 2015 International conference on healthcare informatics. IEEE, pp. 160–169. Cai, C. J., Jongejan, J. and Holbrook, J.: (2019) ‘The effects of example-based expla-
nations in a machine learning interface’, Proceedings of the 24th international conference on intelligent user interfaces, pp. 258–262. Cheng, H.-F. et al. (2019) ‘Explaining decision-making algorithms through UI: Strategies to help non-expert stakeholders’, Proceedings of the 2019 chi conference on human factors in computing systems, pp. 1–12. David, D. B., Resheff, Y. S. and Tron, T. (2021) ‘Explainable AI and adoption of
financial algorithmic advisors: an experimental study’, Conference on AI, Ethics, and Society (AAAI/ACM), pp. 390–400. Dodge, J. et al. (2019) ‘Explaining models: an empirical study of how explanations impact fairness judgment’, Proceedings of the 24th international conference on intelligent user interfaces, pp. 275–285. European Commission (2020) White Paper on Artificial Intelligence: a European
approach to excellence and trust. Available at: https://commission.europa.eu/doc ument/d2ec4039-c5be-423a-81ef-b9e44e79825b_en (Accessed: 23 August 2023) Förster, M. et al. (2020) ‘Fostering human agency: A process for the design of usercentric XAI systems’, International Conference on Information Systems (ICIS), pp. 1–17. Hamm, P. et al. (2023) ‘Explanation matters: An experimental study on explainable
AI’, Electron Markets, 33(17). Hohman, F. et al. (2019) ‘Gamut: A design probe to understand how data scientists understand machine learning models’, Proceedings of the 2019 CHI conference on human factors in computing systems, pp. 1–13. Kaur, H. et al. (2020) ‘Interpreting interpretability: understanding data scientists’
use of interpretability tools for machine learning’, Proceedings of the 2020 CHI conference on human factors in computing systems, pp. 1–14. Kim, B., Khanna, R. and Koyejo, O. O. (2016) ‘Examples are not enough, learn to criticize! criticism for interpretability’, Advances in neural information processing systems, 29. Lai, V. and Tan, C. (2019) ‘On human predictions with explanations and predictions
of machine learning models: A case study on deception detection’, Proceedings of the conference on fairness, accountability, and transparency, pp. 29–38. Lapuschkin, S. et al. (2019) ‘Unmasking Clever Hans predictors and assessing what machines really learn’, Nat Commun, 10, Article number: 1096. LeCun, Y. et al. (1989) ‘Handwritten Digit Recognition with a Back-Propagation
Network’, Advances in Neural Information Processing Systems, 2. Lim, B. Y., Dey, A. K. and Avrahami, D. (2009) ‘Why and why not explanations improve the intelligibility of context-aware intelligent systems’, Proceedings of the SIGCHI conference on human factors in computing systems, pp. 2119–2128. Meske, C. and Bunde, E. (2022) ‘Design principles for user interfaces in AI-
based decision support systems: The case of explainable hate speech detection’, Information Systems Frontiers. Montavon, G. et al. (2017) ‘Explaining nonlinear classification decisions with deep Taylor decomposition’, Pattern Recognition, 65, pp. 211–222. Montavon, G. et al. (2019) ‘Layer-Wise Relevance Propagation: An Overview’, in
Samek, W., Montavon, G., Vedaldi, A., Hansen, L., Müller, KR. (eds) Explain- able AI: Interpreting, Explaining and Visualizing Deep Learning. (LNCS, volume 11700), Cham: Springer, pp. 193–209.
Measuring the Impact of Picture-Based Explanations on the Acceptance 87
Müller, R., Kornblith, S. and Hinton, G. E. (2019) ‘When does label smoothing help?’, Proceedings of the 33rd International Conference on Neural Information Processing Systems. Curran Associates Inc., Article number: 422, pp. 4694–4703. Olah, C., Mordvintsev, A. and Schubert, L. (2017) ‘Feature Visualization’, Distill. Rabethge, N. and Kummert, F. (2023) ‘Developing a human-centred AI-based sys-
tem to assist sorting laundry’, First Working Conference on Artificial Intelligence Development for a Resilient and Sustainable Tomorrow, Springer. Rader, E., Cotter, K. and Cho, J. (2018) ‘Explanations as mechanisms for supporting algorithmic transparency’, Proceedings of the 2018 CHI conference on human factors in computing systems, pp. 1–13. Rai, A. (2020) ‘Explainable AI: From black box to glass box’, Journal of the Academy
of Marketing Science, 48(1), pp. 137–141. Ribeiro, M. T., Singh, S. and Guestrin, C. (2016) “‘Why should I trust you?”: Explaining the predictions of any classifier’, Proceedings of the 2016 Conference of the North American Chapter of the Association for Computational Linguistics: Demonstrations, pp. 97–101. The White House (2022) Blueprint for an AI Bill of Rights. Available at: https://ww
w.whitehouse.gov/ostp/ai-bill-of-rights/ (Accessed: 23 August 2023) Ullrich, D., Butz, A. and Diefenbach, S. (2021) ‘The Development of Overtrust: An Empirical Simulation and Psychological Analysis in the Context of Human–Robot Interaction’, Front. Robot. AI, 8:554578. Xu, F. et al. (2019) ‘Explainable AI: A Brief Survey on History, Research Areas,
Approaches and Challenges’, Natural Language Processing and Chinese Comput- ing. NLPCC 2019, (LNAI, volume 11839), Cham: Springer, pp. 563–574. Zeiler, M. D. and Fergus, R. (2014). ‘Visualizing and Understanding Convolutional Networks’ in Fleet, D., Pajdla, T., Schiele, B., Tuytelaars, T. (eds) Computer Vision – ECCV 2014, (LNIP, volume 8689), Cham: Springer, pp. 818–833.
LISTED IN THE AHFE DIGITAL BOOKSTORE CATALOGUE
Explore the complete digital volume
Artificial Intelligence, Social Computing and Wearable Technologies
Read this individual research paper free through the original publisher, or explore the full digital proceedings book.
ISBN 978-1-958651-89-6
Explore this ISBN in the AHFE Bookstore ↗Listed in the July 2026 bookstore catalogue; search by ISBN to confirm current availability · Digital book purchase optional