Michelle Stewart, Andrea Tineo, Michael Wasik, Benjamin Woodrow, Selina Chan (2023). Continuous personal monitoring and personalized hydration recommendations with wearable sweat sensors to prevent occupational heat stress. In: Artificial Intelligence, Social Computing and Wearable Technologies. AHFE Open Access, vol. 113, pp. 322–332. https://doi.org/10.54941/ahfe1004205
Exposure to extreme heat during physical exertion may impair cognitive and physical abilities commonly known as heat stress. Industrial workers are vulnerable to the effects of extreme heat due to increasing ambient temperatures, tasks with radiant heat exposures, work intensity, and added personal protective equipment (PPE) burden. New wearable sweat sensors may help mitigate heat stress by monitoring physiological signs of dehydration and provide real-time hydration recommendations. As wearable sensors are introduced into the workplace, this study aims to understand whether continuous personal, physiological monitoring is a better indicator of heat stress risk than current, traditional industrial hygiene, environmental monitoring.
Heat stress describes a set of heat-related illnesses that occur when the body is unable to dissipate heat that is largely preventable when proper health and safety controls are in place (Gauer, 2019). The International Labor Orga- nization (ILO) reports that ambient temperatures above 25
C (77
F) are associated with reduced labor productivity and found that at 34
C (93.2
F) workers executing tasks at moderate work intensity lost 50% of work capac- ity (Tord Kjellstrom, 2019). According to the US Center for Disease Control and Prevention (CDC), more than 600 people are killed by extreme heat in the U.S. each year (NIOSH, 2022). From 2011-2019, the Bureau of Labor Statis- tics recorded 344 worker-related deaths due to environmental heat exposure (US BLS, 2021). Industrial workers are vulnerable to the effects of extreme heat due to increasing ambient temperatures, tasks with radiant heat expo- sures, work intensity, and added personal protective equipment (PPE) burden (Fontaine, 2022; NIOSH, 2016). As exposure to extreme heat induced by
Continuous Personal Monitoring and Personalized Hydration Recommendations 323
climate change is likely to increase in the coming decades (Dahl, 2019), it is critical for industries and companies to evaluate the impacts of extreme heat on their workers and incorporate mitigation strategies to prevent heat-related illnesses and injuries.
Recommendations and guidelines provided by US Occupational Safety and Health Administration (OSHA, 2023), National Institute for Occupational Safety and Health (NIOSH, 2016), and American Conference of Governmen- tal Industrial Hygienists (ACGIH Table 3, 2017) estimate a worker’s risk of heat illness using average and median values found among study populations. Utilizing average values may lead to over-or under-estimation of an individual worker’s experience of heat. While these recommendations may be an excel- lent resource for employers to build out heat illness prevention programs, we hypothesize that the impact of an individual worker’s health parameters and environment have more influence over the determination of their risk of heat illness and needed mitigations than what current practices suggest.
Wearable, sensor-based technologies provide individualized recommenda- tions to workers on when to drink water, consume electrolytes, or take a break based on physiological data, to mitigate their personal risk of heat ill- ness. While limited studies have been conducted on wearable sweat sensors, they show promise in their use to mitigate heat stress (Patel, 2022; Sharma, 2022.) Some companies have released commercialized wearable sweat sen- sors that have been marketed toward and used by athletes (Seshadri, 2019.) This study is among the first to examine the use of wearable sensors to measure sweat and subsequently, risk of heat illness among industrial work- ers. Conducted by Chevron Technical Center, Chevron Technology Ventures, and partners, this study measures sweat and electrolyte (sodium) loss, and local temperature (temperature sensor between skin and personal protective equipment (PPE) clothing), using a novel wearable sensor technology.
PERSONALIZED HYDRATION AND BEHAVIOR MODIFICATION TO HELP PREVENT HEAT STRESS IN AN OCCUPATIONAL SETTING The purpose of this study is to evaluate the effectiveness of a wearable sweat sensor in mitigating heat stress among industry workers. The wear- able sweat sensor notifies the worker, in real-time of when to hydrate with water or electrolytes based on the amount of sweat lost and measured by the wearable sensor. Hydration cues are used because maintaining proper hydra- tion is proven to be one of the most effective ways to mitigate heat stress (Ioannou, 2021.) If successful, this type of wearable sensor may empower workers to stay properly hydrated before symptoms of heat illness occur.
Methods to Measure Potential Heat Illness Risk Today’s primary methods to measure heat stress include Wet Bulb Globe Temperature (WBGT) and the Heat Index. The WBGT is a surrogate mea- sure of heat stress in direct sunlight that accounts for humidity, temperature, wind speed, sun angle, and cloud cover. WBGT use may be limited given that the monitors are not widely available and require subject matter exper- tise to use and interpret data making them impractical for daily use in most
industries. Given these limitations, many industries choose to use the more widely accessible option, Heat Index. The Heat Index is computed using ambient temperature and relative humidity and can be interpreted using tables provided by the National Weather Service (US Dept Commerce, 2022) which factors in several constants based on environmental and physiological assumptions. These assumptions are based on average working conditions and may under or overestimate environmental and physiological parameters that influence the way an individual experiences heat.
Case for Hydration – What We Learned From Athletes Sports medicine research highlights the importance of preventing hypohy- dration (body water deficit) and hyponatremia (blood sodium levels below normal) among athletes. Like athletes, industrial workers expend tremendous amounts of energy in the outdoors and are at high risk for heat illness due to high temperatures and hypohydration. The American College of Sports Medicine and the National Athletic Trainers Association recommend mon- itoring body mass changes during exercise to prevent hypohydration (2% body mass deficit) and hyperhydration (Smith, 2021; Baker, 2022). There is no one-size-fits-all when it comes to hydration recommendations (Sawka, 1998; Pryor, 2018), likely due to subjects having different levels of acclima- tization, physical fitness, and personal health risks that may affect how they experience heat. Researchers have investigated and found that individ- ualized hydration plans based on sweat rate and electrolyte (sodium) loss may improve athletic performance and optimize the safety and health of athletes (Ayotte, 2018). Studies have yet to investigate the effectiveness of individualized hydration plans in an occupational setting.
Study Details As wearable sensors are introduced into the workplace a goal of this study is to understand whether continuous personal, physiological monitoring is a better indicator of heat stress risk than current traditional industrial hygiene monitoring of the workplace environment (e.g., Heat Index).
Study Assumptions This study analysis relies on several assumptions related to the work envi- ronment and the wearable sweat sensor.
Methods Study data was collected from the wearable sensors that measured sweat vol- ume, sweat conductivity, and skin temperature. Ambient temperature and relative humidity data were also collected using date, geographic location, and time. Observations of participants and pre- and post-study question- naires were conducted to gather information on user experience including comfort, training effectiveness, ease of use and application interface. The wearable sensors were paired with workers’ smartphones to provide real- time feedback regarding fluid loss. The device notified workers to hydrate, or take breaks, when fluid loss benchmarks were reached.
Continuous Personal Monitoring and Personalized Hydration Recommendations 325
Table 1. Study assumptions Assumption
Table available in the original PDF paper.
Study participants are acclimatized to the work environment. Study participants are wearing double-woven, long-sleeve, long-pant, flame retardant clothing. The Connected Hydration wearable sweat sensor temperature readings are comparable “feels like” temperature (between worker’s skin and PPE) in the absence of humidity readings or reflects a personal heat index. Workload and metabolic rate are approximately moderate to heavy for the entirety of work sessions (ACGIH Table 3, 2017). The Heat Index can be substituted for WBGT when computing heat stress estimates. The same WBGT-based clothing adjustment factor may be applied to the Heat Index to adjust for PPE burden. (ACGIH Table 1, 2017)
Study Participants Wearable sweat sensors were deployed among three participant groups in two different locations with a focus on routine duties in the oil and gas off-shore and on-shore working environments. For each study group, workers were recruited and participated voluntarily (Table 2). Each participant received a supply of reusable wearable sweat sensors “patches” and a personal biomet- ric reusable module to be used for the entire duration of the study. In addition to receiving training on heat stress / heat illness and common mitigations, each participant received training on how to apply the patch and reusable module, operate the system, and upload data to a smartphone.
The wearable sweat sensor used in this study is the Connected Hydration patch 3 (CHP3), a wearable microfluidic system used to measure sweat as a proxy for dehydration (Aranoysi, 2021). The Connected Hydration device consists of the reusable biometric module, and a single use sweat sensor. The Connected Hydration device collected data for up to sixteen hours.
Upon activation of the wearable sweat sensor, workers entered information regarding their height, weight, and sex at birth to provide baseline metrics for sweat calculations. As a web-based tool, participants also entered their email address to connect to the partner cloud services of the iPhone application (App.) Each worker applied the Connected Hydration patch at the start of, and removed at the end of, the work shift (∼12 hours) for a period of around 14 days. Patches were placed on the upper arm between the deltoid and the bicep. Throughout the day participants recorded fluid and electrolyte intake into the Connected Hydration App during natural work breaks and uploaded final data to cloud services at the end of each shift.
When connected to the App, workers had access to real-time rehydration recommendations. As sweat thresholds were reached, the biometric device provided participants with an alert or alarm, prompting workers to rehy- drate and take a break. An alert, defined by a single short device vibration, denoted that a participant lost the sweat equivalent of one bottle of water (500 ml). The hydration alert helps with the workers awareness of sweat loss between water/rest breaks. An alarm, defined by a single long device vibra- tion, denoted that a participant lost the sweat equivalent of 2% of their body weight and may be at an elevated risk of heat illness. The hydration recom- mendation provided by the App is to take a break immediately and rehydrate with water and electrolytes per the App’s recommendations and record in the App, reducing the risk of heat illness.
RESULTS
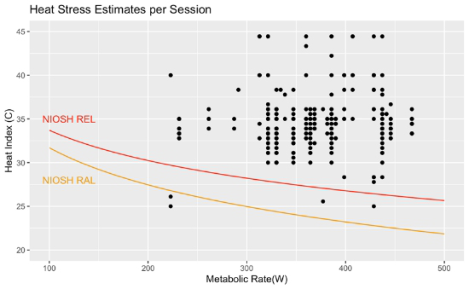
Maximum daily Heat Index and sensor temperature values were chosen for the analysis to show highest risk, as opposed to average risk. A clothing adjustment factor of +3 was added to maximum ambient Heat Index val- ues in relation to metabolic rate to capture the effect of PPE burden (ACGIH Table 1, 2017). Fluid loss and fluid intake were averaged by session dura- tion and compared to NIOSH hydration recommendations. Several variables were computed using the data collected in the field. Heat stress was calcu- lated using the regression equation developed by Lans P. Rothfusz (Rothfusz, 1990). Metabolic rate estimates were computed using the ACGIH Metabolic Work Rate equation (ACGIH Table 3, 2017). NIOSH Recommended Expo- sure Limit (REL) and Recommended Alert Limit (RAL) lines were drawn uti- lizing the equations cited in NIOSH Criteria for a Recommended Standard: Occupational Exposure to Heat and Hot Environments.
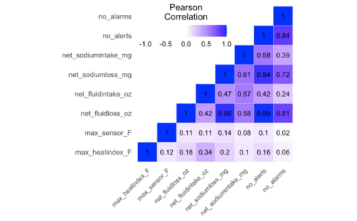
Analysis showed negligible to very high positive associations between study variables (Fig 1). Low positive and negligible correlations were observed between Heat Index and sensor temperature variables and fluid loss, fluid intake, sodium loss, and sodium intake. A very high positive corre- lation was found between fluid loss and sodium loss, fluid loss and number of alerts, and sodium loss and number of alerts.
Figure 1: Pearson product moment correlation analysis for study variables. R values fall between 0-1, R = 0 indicates no association, R = 1 indicates a total positive association.
Continuous Personal Monitoring and Personalized Hydration Recommendations 327
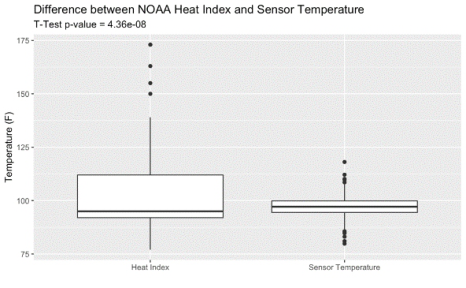
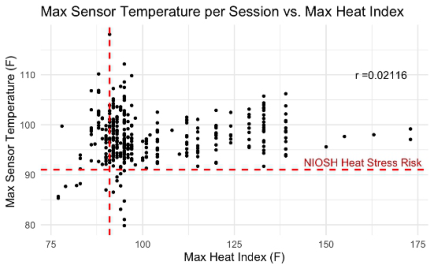
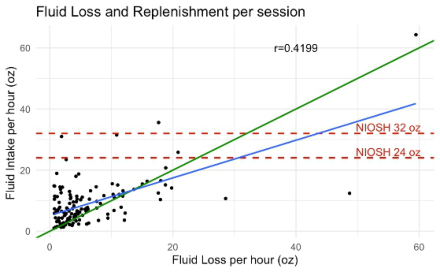
Figure 2: Difference in means between heat index and sensor temperature. T-test (p-value = 4.36e-08, t = 5.578, df = 420.93, 95% confidence interval = 3.25-6.79).Figure 3: Association between maximum heat index per session and maximum sensor temperature per session. Dashed lines represent NIOSH’s 32.7 ◦C (91◦F) temperature threshold indicating heat stress risk. Pearson product-moment correlation r = 0.12.Figure 4: Total fluid loss and fluid intake per session compared to NIOSH hydra- tion recommendations (24-32 oz / hour). Green line indicates target rehydration ratio (1 oz lost: 1 oz consumed), and blue line indicates rehydration linear regression line. Pearson product moment correlation (r = 0.42), linear regression: (p<2e-16, F statistic = 78.38).Figure 5: Estimated heat stress risk per session based on estimated metabolic rate (watts) and clothing adjusted heat index. Heat index was substituted for WBGT in determination of heat stress estimate. Modified NIOSH REL and RAL equations RAL [◦C-WBGT] = 59.9 – 14.1 log10 M [W], REL [◦C-WBGT] = 56.7 – 11.5 log10 M [W].
DISCUSSION
Strong associations between variables support the functionality of the device (fluid-loss and number of alerts and alarms, and sodium loss and number of alerts and alarms) and between physiological variables (fluid-loss and sodium loss). Our data supports previous sports medicine research highlighting the variability of sweat rate and conductivity between individuals (Fig. 1, Fig. 4).
Under the assumption that the sensor temperature data reflects a person- alized heat index, the results revealed a significant difference between the maximum session temperature values for the Heat Index and sensor temper- ature (Fig. 2, 3). These results support our hypothesis that the Heat Index does not reflect the “feels like” temperature of any given individual. When compared to the NIOSH heat stress risk value of 32.7
C (91
F), we observe that most of the worker study population may be at risk of heat stress and should be closely monitored for symptoms of heat illness.
When examining fluid-intake compared to NIOSH’s recommendation (24- 32 oz of water per hour), we observe that most workers consumed less than 24 oz of water per hour, and very few exceeded 32 oz of water per hour, recommended by NIOSH (Fig. 4). Linear regression analysis shows a signifi- cant positive association between fluid loss and fluid intake, suggesting that workers are rehydrating in response to dehydration cues (thirst and device alerts and alarms). The ideal hydration ratio is 1 unit loss: 1 unit intake. Ide- ally, employers should aim to narrow the gap between the observed hydration regression line and the ideal hydration regression line.
Substituting heat index values for WBGT values may yield inaccurate heat stress estimates and underestimate PPE burden and the effects of working in direct sunlight. This substitution, however, allows us to compare our study population to NIOSH recommendations and guidelines. Workers from our study population generally participate in tasks with moderate to heavy work intensity. Assuming that during an average work shift a participant is working
Continuous Personal Monitoring and Personalized Hydration Recommendations 329
at a moderate intensity, the computed heat stress estimates for most partici- pant sessions indicate a potential exceedance of NIOSH RELs (Fig. 5). These findings support the need for continued heat stress mitigation controls for this study population. When heat stress estimates exceed NIOSH RELs, cur- rent recommendations are to deploy engineering and administrative controls such as fans, air conditioning, and increased breaks to cool workers down. The use of the wearable sweat sensor to define a personalized heat stress mitigation strategy or intervention, may ensure individual users are aware of thermal work conditions and their physiological response to heat (Fig. 5). Hydration cues (alerts and alarms) provided by the wearable sweat sensor may introduce increased hydration needs and rest break awareness which, in turn, provides time for rest and recovery to a cooler core body temperature. This feedback circuit provided by the wearable sweat sensor demonstrates potential for individual-specific heat stress monitoring, similar to findings in Sharma et al., 2022.
Future trial considerations:
Adding a control dataset and baseline environmental and physiological measurements.
Trials should collect WBGT data to better determine if temperatures mea- sured from a wearable sensor are more accurate in reporting temperature than traditional environmental monitoring (e.g., WBGT) for regulatory comparisons.
Incorporate a relative humidity measurement to better estimate an individ- ualized “feels like” temperature to develop a personal heat index equation using multiple regression analysis.
Baseline fluid intake and bodyweight measurements should be collected to ensure more precise hydration recommendations and alert and alarm thresholds. Workers should be weighed and surveyed for fluid intake prior to starting their shift.
Have participants maintain a food intake diary to account for electrolytes (sodium) ingested in addition to drinks.
CONCLUSION
Accurately monitoring for heat exposure requires expensive equipment and competent staff to interpret results, which may likely not be cost-effective or feasible for most work sites. While one of the major limitations in this study was the lack of WBGT data for comparison, the study design reflected a real- work scenario where workers likely do not have access to a WBGT. Workers already know risks of heat stress, and deployment of wearable technology that intervenes before signs of heat illness appear was a welcome interven- tion amongst the study population. Compared to conventional techniques, the wearable technology is a strong contender to reduce the likelihood of a worker experiencing an injury from heat stress.
Results from this trial showed notable variability in relation to the strength of association between environmental and physiological variables. The dis- cussion and limitations have outlined possible explanations for low and
negligible correlations; however, the high correlations show promise for the functionality of the device in the field. Additionally, the data showed a moderate correlation between fluid loss and fluid intake followed by sodium loss and sodium intake, showing potential for the intervention to target an ideal rehydration ratio through personal hydration recommendations. Data supports known physiology about sweat and the need to implement controls for heat stress mitigation. While workers are rehydrating in response to cues, there is room to improve hydration trends. This trial should be repeated with modifications and additions (e.g., use of a control population) to make more accurate comparisons and improve our understanding of the relationship between environmental and physiological variables. As we see temperature and humidity levels exceeding safe limits in the workplace, implementing personal wearable sweat sensors, like the Connected Hydration device, may use dehydration risk as an early warning system to prevent heat stress and ultimately heat illness before it occurs.
ACKNOWLEDGMENT
The authors would like to acknowledge Chevron Technology Ventures staff Louisa Reid, Kathryn Underhill and Monica Suman Krishnan, Chevron study support team members, University of California, Berkeley professors Carisa Harris and Sadie Costello, as well as the many wonderful scientists at Epicore Biosystems.
This project was supported by the Training Grant T42OH0842918, funded by National Institute for Occupational Safety and Health (NIOSH) / Centers for Disease Control and Prevention (CDC).
REFERENCES
American Conference of Governmental Industrial Hygienists (ACGIH). Heat Stress and Strain: TLV® Physical Agents 7th Edition Documentation (2017). Clothing Adjustment Factors Table 1. TLVs and BEIs with 7th Edition Documentation, CD- ROM. Cincinnati, OH, 2017. American Conference of Governmental Industrial Hygienists (ACGIH). Heat Stress
and Strain: TLV® Physical Agents 7th Edition Documentation (2017). Metabolic Work Rates Table 3. TLVs and BEIs with 7th Edition Documentation, CD-ROM. Cincinnati, OH, 2017. Aranyosi (2021). Aranyosi AJ, Model JB, Zhang MZ, et al. Rapid Capture and Extraction of Sweat for Regional Rate and Cytokine Composition Analysis Using a Wearable Soft Microfluidic System. J Invest Dermatol. 2021;141(2): 433–437. e3. doi: 10.1016/j.jid.2020.05.107. Ayotte (2018). Ayotte D, Corcoran MP. Individualized hydration plans improve per-
formance outcomes for collegiate athletes engaging in in-season training. J Int Soc Sports Nutr. 2018;15(1):27. doi: 10.1186/s12970-018-0230-2. Baker (2022). Baker LB, Seib MS, Barnes KA, et al. Skin-Interfaced Microfluidic System with Machine Learning-Enabled Image Processing of Sweat Biomarkers in Remote Settings. Adv Mater Technol. n/a (n/a):2200249. doi: 10.1002/admt.202200249.
Continuous Personal Monitoring and Personalized Hydration Recommendations 331
Dahl (2019). Dahl K, Licker R, Abatzoglou JT, Declet-Barreto J. Increased frequency of and population exposure to extreme heat index days in the United States during the 21st century. Environ Res Commun. 2019;1(7):075002. doi: 10.1088/2515- 7620/ab27cf. Fontaine B. (2022). Understanding the Heat Burden While Wearing Personal Protec-
tive Clothing -. Occupational Health & Safety. Published July 29, 2022. Accessed October 20, 2022. https://ohsonline.com/articles/2022/07/29/understanding-the- heat.aspx Gauer (2019). Gauer R, Meyers BK. (2019) Heat-Related Illnesses. Am Fam Physician. 2019;99(8): 482–489. Ioannou (2021). Ioannou LG, Mantzios K, Tsoutsoubi L, et al. Occupational Heat
Stress: Multi-Country Observations and Interventions. Int J Environ Res Public Health. 2021;18(12):6303. doi: 10.3390/ijerph18126303. NIOSH – Heat Stress (2022). Heat Stress Related Illness | NIOSH | CDC. Published May 18, 2022. Accessed October 20, 2022. https://www.cdc.gov/niosh/topics/hea tstress/heatrelillness.html NIOSH, 2016. Criteria for a recommended standard: occupational exposure to heat
and hot environments - revised criteria 2016. Published online July 15, 2020. doi: 10.26616/NIOSHPUB2016106. OSHA Heat Standard (2023). Heat - Standards | Occupational Safety and Health Administration. Accessed April 25, 2023. https://www.osha.gov/heat-exposure/s tandards Parsons (2006). Parsons K. Heat Stress Standard ISO 7243 and its Global Applica-
tion. Ind Health. 2006;44(3): 368–379. doi: 10.2486/indhealth.44.368. Patel (2022). Patel V, Chesmore A, Legner CM, Pandey S. Trends in Workplace Wearable Technologies and Connected-Worker Solutions for Next-Generation Occu- pational Safety, Health, and Productivity. Adv Intell Syst. 2022;4(1):2100099. doi: 10.1002/aisy.202100099. Pryor (2018). Pryor JL, Johnson EC, Roberts WO, Pryor RR. Application of evidence-based recommendations for heat acclimation: Individual and team sport perspectives. Temp Multidiscip Biomed J. 2018;6(1): 37–49. doi: 10.1080/23328940.2018.1516537. Rosner (2007). Rosner MH, Kirven J. Exercise-Associated Hyponatremia. Clin J Am
Soc Nephrol. 2007;2(1):151. doi: 10.2215/CJN.02730806. Rothfusz (1990). Rothfusz LP. The Heat Index “Equation” (or, More Than You Ever Wanted to Know About Heat Index). Published online July 1, 1990. Sawka (1998). Sawka MN, Latzka WA, Matott RP, Montain SJ. Hydration Effects
on Temperature Regulation. Int J Sports Med. 1998;19(S 2): S108-S110. doi: 10.1055/s-2007-971971. Seshadri (2019). Seshadri DR, Li RT, Voos JE, et al. Wearable sensors for monitoring the physiological and biochemical profile of the athlete. Npj Digit Med. 2019;2(1): 1–16. doi: 10.1038/s41746-019-0150-9. Sharma (2022). Sharma M, Suri NM, Kant S. Analyzing occupational heat stress using sensor-based monitoring: a wearable approach with environmental ergonomics perspective. Int J Environ Sci Technol. 2022;19(11): 11421–11434. doi: 10.1007/s13762-021-03862-6. Smith (2021). Smith JW, Bello ML, Price FG. A Case-Series Observation of Sweat
Rate Variability in Endurance-Trained Athletes. Nutrients. 2021;13(6):1807. doi: 10.3390/nu13061807. Tord Kjellstrom (2019). Tord Kjellstrom NM. Working on a Warmer Planet: The Effect of Heat Stress on Productivity and Decent Work.; 2019. Accessed May 3, 2022. https://www.ilo.org/global/publications/books/WCMS_711919/lang-\/-en /index.htm
US BLS (2021). 43 work-related deaths due to environmental heat exposure in 2019 : The Economics Daily: U. S. Bureau of Labor Statistics. Accessed Octo- ber 20, 2022. https://www.bls.gov/opub/ted/2021/43-work-related-deaths-due-to -environmental-heat-exposure-in-2019.htm US Department of Commerce N. (2022). What is the heat index? Accessed May 3,
2022. https://www.weather.gov/ama/heatindex
LISTED IN THE AHFE DIGITAL BOOKSTORE CATALOGUE
Explore the complete digital volume
Artificial Intelligence, Social Computing and Wearable Technologies
Read this individual research paper free through the original publisher, or explore the full digital proceedings book.
ISBN 978-1-958651-89-6
Explore this ISBN in the AHFE Bookstore ↗Listed in the July 2026 bookstore catalogue; search by ISBN to confirm current availability · Digital book purchase optional