Inge Pieterse (2023). Improving cost modelling of residential property replacement costs for short-term insurance purposes: A South African Perspective. In: Sustainable Construction in the Era of the Fourth Industrial Revolution. AHFE Open Access, vol. 107, pp. 17–25. https://doi.org/10.54941/ahfe1003088
The residential property market in South Africa has an extraordinarily high number of first-time homeowners. Cost information assistance available to the South African public consists of crude cost models to be found on individual short-term insurers’ websites. The financial cost to obtain an accurate replacement cost estimate from a professional built environment cost advisor outweighs the perceived risk of insuring a residential property for an accurate replacement cost. The need for an alternative cost model that could deliver more accurate replacement costs without employing the onerous cost-estimating techniques as employed in the quantity surveying practice within a short time is apparent. This research aims to develop an alternative approach to building cost modelling for insurance purposes. The building cost model developed, other than that commonly used in the marketplace, is premised on the case-based reasoning (CBR) technique. The four stages of retrieving, reusing, revising and retaining cases are performed. The retrieving incorporates the k-nearest neighbour (kNN) machine learning algorithm to retrieve comparable cost data from a database of residential properties. The database employs the most accurate cost model used in quantity surveying practice and is structured according to recognised building elements. The reusing and revising of the cases are based on specific building features to suit a particular residential property and are performed by applying a mathematical model.The outcome suggests that 75% of predicted replacement costs fall within the acceptable 5% accuracy level of the actual replacement costs, indicating significantly improved replacement cost estimates as the dataset represents costs based on the most accurate cost model used in practice. The study’s findings are important for the South African insurance industry and the built environment as it implies the possibility of providing more accurate insurance values that could curb underinsurance and possible financial setbacks to insureds in future. The findings will also add to the existing generic knowledge on building cost modelling for purposes other than insurance.
unforeseen events through short-term or non-life insurance becomes neces- sary. Ideally, homes should be insured for their full replacement cost; however, unintended under-insurance is a global reality that is partially caused by the estimating systems used by insurers (Klein, 2018). This situation is particu- larly relevant in South Africa due to the extraordinary number of first-time homeowners caused by urbanisation and the changed political dispensation (Baffi et al. 2018).
South Africa has a well-developed insurance industry judging by the mar- ket penetration, insurance premium spending expressed as a percentage of GDP, and density, insurance premium spending expressed as a monetary value relative to the population, performance measures compared to G7, BRICS, and other African countries. It outperforms BRICS and other Afri- can countries and resembles a developed county’s performance rather than a developing county (Pieterse, 2022). Regardless, the existing cost models used to inform sums insured in South Africa lack the sophistication of models used in countries such as the United States of America, Canada, Australia, and New Zealand.
The techniques applied in the cost models used in the insurance industry are adopted from built environment cost models.
Built Environment Cost Modelling Two approaches to built environment cost modelling are often debated. The first is product-based modelling which represents the complete building, and the second is process-based modelling which represents the production pro- cess (Lawther and Edwards, 2001, Jagger et al., 2002, Kirkham, 2007 and 2014). The criticism of product-based modelling is its lack of a relationship between the cost modelling technique and the construction process and the possible distortion of cost data used in the cost modelling techniques (Law- ther and Edwards, 2001). Process-based models are problematic because they are project-specific and thus unavailable for general use. Product-based cost modelling techniques are widely adopted in the built environment and have been developed for use relative to different design development project sta- ges. Kirkham (2007 and 2014) and Jaggar et al. (2002) depict cost modelling as a triangle with the apex as the early design stage cost method and the base as the construction stage with detailed cost methods. The triangle’s height depicts the design development stages ranging from the construction stage, where the most cost data is available, to the feasibility stage, where the least cost information is available. The cost estimating models developed for use at different design development stages are the unit or function cost estima- ting method for use at a briefing or feasibility stage, which is expressed as a cost per bed for a hospital, cost per seat for a theatre, cost per parking bay for a parking garage; the space estimating model also to be used at fea- sibility stage which is expressed as a cost per area; the elemental estimating model at the design proposal stage, and is refined as the design is developed, which expresses the costs in functional elements of a building and the detai- led design stage which is expressed in detailed quantities in the form of a bill of quantities based on standardised measurement rules.
Improving Cost Modelling of Residential Property Replacement Costs 19
Bespoke software such as Verisk Analytics Incorporated’s 360Value® and CoreLogic Incorporated’s Risk Evaluation Solutions used in the USA and Canada, Cordell Information (Pty) Ltd’s Cordell Sum Sure used in Austra- lia and New Zealand, and the Royal Institute of Chartered Surveyor’s BCIS Rebuild Online are all examples of systems that have adapted some of the techniques alluded to above to produce replacement costs for buildings. Apart from Rebuild Online, supported by extensive in-house building cost data, the systems utilise third-party databases to populate pre-filled forms to generate replacement costs employing algorithms and machine learning processes.
No similar bespoke insurance software exists in South Africa. Only three of the larger South African insurance companies host replacement cost calcu- lators on their websites. The calculators extract basic property information from the users but ultimately base their estimates on rates per area. From the design development stage estimating methods, it is apparent that this method is the most inaccurate as it is intended to be used in an early development stage of a building project when little information about the design is available.
The first prize in determining the most accurate replacement cost for a residence would be to employ the services of a professional quantity surveyor. However, this is costly; for most homeowners, the cost exceeds the risk of not being insured appropriately. Most quantity surveying practices in South Africa are small enterprises that do not have extended databases from which cost data can be obtained for different types of building projects, and few quantity surveyors are involved in housing projects. Hence the replacement costs would have to be determined by creating and costing detailed quantities.
PROPOSED CASE-BASED REASONING METHODOLOGY Case-based reasoning (CBR) is a methodology comprising four stages: retrie- ving, reusing, revising and retaining cases. Cases are individual projects in the dataset used in performing the method (Aamodt and Plaza, 1994). The most important aspect of CBR is the structure and content of the dataset, as the success of CBR is heavily reliant upon it. The development of CBR systems ranges from fully automated systems for a specific solution to retrieval- automated systems with person interactivity to reach a solution (Kolonder, 2014). This research supports automatic retrieval with mathematical revision and retainment.
Dataset The dataset for this research was created from base principles, first appl- ying the detailed quantities estimating cost model based on the South African Standard System for Measuring Building Work, 7th Edition, published by the Association of South African Quantity Surveyors. The replacement costs were then converted into the seven elements (or cost groups) of substructure; exter- nal elevations; roof; internal divisions; furniture, fixtures and equipment, plumbing services and electrical and mechanical services as set out in the Internal Cost Management System. After that, fourteen building features were compiled. These features are the construction area; structure area; roof
20 Pieterse
area (on the slope); roof pitch; external elevation area; wall heights; area of doors and windows; length of external walls, corners in external walls, length of internal walls; the number of rooms; the number of bedrooms; the num- ber of sanitary points; and length of built-in cupboards. The predominant typology of residential properties in South Africa are standalone dwellings comprising brick structures, timber roof structures with concrete roof tiling, and finished externally and internally with plaster and paint. The choice of features thus becomes apparent relative to the typology. Much attention was given to accuracy and consistency while creating the data for the cases.
Retrieval Cases to be retrieved serve two purposes. Firstly, they provide context to understand and assess the new case because they provide concrete evidence for or against a solution, and secondly, they suggest solutions for the new case. The purpose of retrieval is thus to select cases that are as similar as possible to the new case to be solved so that relevant predictions about new cases can be made (Kolonder, 2014).
The k-Nearest Neighbours (kNN) machine learning algorithm was cho- sen to retrieve cases. This algorithm is classified as supervised and non- parametric, meaning that all the data in the dataset is labelled and that the form of the mapping function is not assumed. Predictions are therefore made solely based on the k most similar patterns to the case to be solved (Bro- wnlee, 2019). kNN is also called a lazy learner, which refers to the fact that no actual learning takes place with this algorithm as it simply uses the entire dataset to search for the nearest neighbours (NN). kNN employs a distance measure to determine the NN. The most popular measure for deter- mining real-valued inputs, as presented in this research, is the Euclidean distance. Euclidean distance is calculated as the square root of the sum of the squared differences (Brownlee, 2019). There is much debate about the appropriateness of the Euclidean distance, as several other distance measures could be employed. To this end, Ahn et al. (2017) compared four distance measures used in CBR research; ultimately, the Euclidean distance was the most appropriate measure. Cases are addressed as a whole, not deconstru- cted to choose components’ nearest neighbours, and then reconstructed again (Kolonder, 2014).
Without an extensive dataset and appropriate measures to assist in retrie- ving similar cases, reasoners could blindly use previous cases they are aware of without validating the case. Reasoners could also use an inappropriate case because it is all that is available (Kolonder, 2014).
Reuse and Revision The reuse process assesses how similar the retrieved cases are to the new case and whether the whole or only part of the retrieved cases can be used to predict the new case. The revision process involves two actions. Firstly, to evaluate if the retrieved case solves the new case as retrieved, which hardly ever is the situation, or secondly, to figure out what needs to be adjusted and
Improving Cost Modelling of Residential Property Replacement Costs 21
to fix the retrieved case to solve the new case by applying domain-specific knowledge (Aamodt and Plaza, 1994, Kolonder, 2014).
Retaining Retaining involves preparing the acceptable predicted case for inclusion in the dataset by indexing and integrating the case into the dataset so that it is then available to be retrieved in future.
OUTCOME Four scenarios were prepared to illustrate the technique of choosing the NN, evaluating how similar the neighbours are to the case being predicted and deciding which cases could be retained and which not.
Usually, it is recommended that data be divided into training and testing sets to run the kNN on. The entire training set is used when presenting a new case for a solution. In this research, both the split and whole datasets were considered to assess the impact of the test set or holdout data.
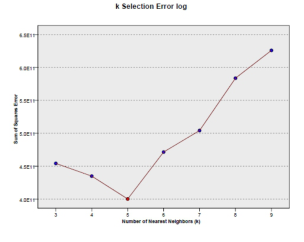
The dataset comprised 45 cases and contained the replacement and costs for the seven elements. The four scenarios prepared were (1) an unweighted kNN based on an 80% training set and 20% testing set, which allowed 34 training cases and 11 holdout cases, (2) a weighted kNN based on an 80% training set and 20% testing set which allowed 40 training cases and five hol- dout cases, (3) an unweighted kNN based on a 100% training set thus using all 45 cases in the dataset and (4) a weighted kNN based on a 100% training set using all 45 cases in the dataset. 5-Fold cross-validation was performed to determine the best value for k. The outcome of the validation processes was k = 5 for scenario 1, k = 3 for scenario 2, k = 5 for scenario three and k = 5 for scenario 4. Figure 1 depicts the validation performed to select k for scenario 1. The horizontal axis shows that k was tested between 3 and 9, and the vertical axis shows the sum of square errors for k.
Figure 1: 5-Fold cross-validation for scenario 1.
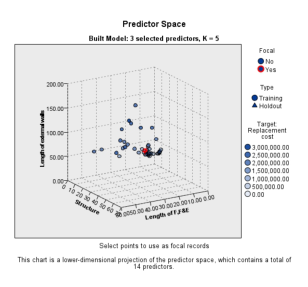
In all four scenarios, case 18 was selected as the focus record so that the choice of the NN could be compared. Figure 2 illustrates the scatter plot of the data based on three of the fourteen predictors and shows the focal case 18 in red. Note that the form of the data is non-linear and thus suited for the kNN application.
22 Pieterse
Figure 2: Predictor space for scenario 4.
The NN selected for each of the scenarios are as follows:
Table 1. k Nearest neighbours (NN) and distances for all scenarios.
Table available in the original PDF paper.
The target prediction is the replacement cost. The kNN module generated predictions for each of the NN of every scenario. The absolute errors were calculated using the actual replacement costs known in the dataset and the predicted replacement costs. The absolute errors are used to determine which NN is the most similar to the focal record. The result hereof was that cases 27 and 28 were the most similar to case 18 for scenario 1, cases 31 and 35 were the most similar to case 18 for scenario 2, cases 31 and 35 were also the most similar to case 18 for scenario three and cases 28 and 31 were the most similar to case 18 for scenario 4.
Based on the similarity test, the two most similar cases for each scenario were chosen for reuse. They were revised based on ratios created for each feature expressing the NN cases relative to the focal case and applying the ratios to the total elemental costs. The revised replacement costs compared to the actual replacement cost of the focal case are illustrated in Table 2. The
Improving Cost Modelling of Residential Property Replacement Costs 23
reasoner would need to set criteria for retaining a case. Assume that only cases predicted within 5% of the actual replacement cost are to be retained. Therefore, the new cases based on 27 (1, 89%), 28 (4, 52%), and 35 (2, 36%) will be retained, and the new case based on 31 (6, 14%) that exceeds 5% will not be retained. It is important to note from this analysis that case 17 was the closest neighbour in all four scenarios based on the Euclidean distance but failed the similarity test in each of the scenarios as it turned out to be the least similar to the focal case. As shown in Table 2, case 17 exceeds the replacement cost by 13, 52% and would thus not be retained.
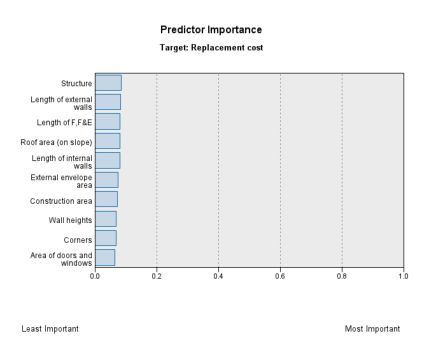
Scenarios 1 and 3 are based on the traditional kNN, and scenarios 2 and 4 are on a weighted kNN where the features are weighted by importance when computing the distance. Figure 3 illustrates the predictor importance for scenario 4. Ten of the 14 features or predictors as shown. Five predi- ctors (structure length of external walls; length of F, F &E; roof area and length of internal walls) are rated at 0.08. Four of the predictors (external elevation, construction area, wall height and corners) are rated at 0.07, and one predictor (area of doors and windows) is rated at 0.06. The predictors not included in the figure and thus of lesser importance in predicting the replacement cost are the roof pitch, number of rooms, number of bedro- oms and number of sanitary points. The total of the rated predictors scored
Table 2. Accuracy of replacement costs after revision.
0.74 or 74%. The balance not scored is thus 26%. The predictor importance indicates the features that would have a larger effect on the model.
The predictor importance for scenario 2, which is based on 80% of the training dataset, differs slightly from the predictor importance for scenario 4, which is based on 100% of the training dataset, indicating that holdout or training sets for small datasets could impact the predictions.
CONCLUSION
The CBR methodology employed in this research returned three (1, 89%, 4, 52% and 2, 36%) of the four NN predicted replacement costs within the acceptance level of 5% of the actual replacement costs that they were com- pared to. The fourth case (6, 14%) exceeded the acceptance level and is thus not retained in the dataset for further use. The importance of conducting a similarity test is illustrated by case 17, which was indicated as the closest NN based only on the distance measure but failed the similarity test. This resea- rch aims to create better predictions of residential property replacement costs in South Africa. Indemnity, the most essential principle of insurance, requires the insurer to place the insured in the same position they were before damage was incurred. The more accurate a prediction is, the better this principle is adhered to.
The replacement costs in the dataset are based on the most accurate cost models, usually associated with the final stages of a building project, used in quantity surveying practice. Thus, the results of predictions within 5% of these models indicate a much-improved replacement cost model as proposed in this research.
RECOMMENDATIONS The CBR methodology can potentially be applied to many more cost predi- ctions than just replacement costs for short-term insurance purposes.
It is recommended that the research be expanded to include other types of cost predictions. Specific datasets need to be developed to support such research, as no built environment cost datasets exist in the public domain in South Africa.
REFERENCES
Aamodt, A and Plaza, E. 1994. Case-Based Reasoning: Foundational Issues, Methodological Variations, and System Approaches. AI Communications, Vol. 7 no. 1, March 1994, pp. 39–59. Ahn, J., Park M., Lee, H., Ahn, S. N., Ji, S., Song, K. and Sone, B. (2017). Cova-
riance effect analysis of similarity measurement methods for early construction cost estimation using case-based reasoning. Automation in Construction, No. 81, pp. 254–266. Baffi, S., Turok, I., Vacchiani-Marcuzzo, C. (2018). The South African Urban System.
In: Rozenblat, C., Pumain, D., Velasquez, E. (eds) International and Transnatio- nal Perspectives on Urban Systems. Advances in Geographical and Environmental Sciences. Springer, Singapore. https://doi.org/10.1007/978-981-10-7799-9_13
Improving Cost Modelling of Residential Property Replacement Costs 25
Brownlee, J. (2019). Master Machine Learning Algorithms. Machine Learning Mastery. Jaggar, D; Ross, A; Smith, J and Love, P. (2002). Building Design Cost Management.
Blackwell Science. Kirkham, R. (2007). Ferry and Brandon’s Cost Planning of Buildings (Eighth Edition). Blackwell Publishing Ltd, London. Kirkham, R. (2014). Ferry and Brandon’s Cost Planning of Buildings (Ninth Edition).
Blackwell Publishing Ltd, London. Klein, K. S. (2018). Minding the Protection Gap: Resolving Unintended, Pervasive, Profound Homeowner Underinsurance. Connecticut Insurance Law Journal, vol. 25, no. 1, Fall 2018, pp. 34–111. HeinOnline. Kolodner, J. L. (2014). Case-Based Reasoning. Morgan Kaufmann Publishers Inc. Lawther, P. J. and Edwards P. J. (2001). Design Cost Modelling – A Way Forward.
The Australian Journal of Construction Economics and Building, vol. 1, no. 1, pp. 32–42. Pieterse, E. I. (2022). Developing a cost model to improve short-term underinsurance of residential buildings in South Africa. The University of Pretoria.
LISTED IN THE AHFE DIGITAL BOOKSTORE CATALOGUE
Explore the complete digital volume
Sustainable Construction in the Era of the Fourth Industrial Revolution
Read this individual research paper free through the original publisher, or explore the full digital proceedings book.
ISBN 978-1-958651-83-4
Explore this ISBN in the AHFE Bookstore ↗Listed in the July 2026 bookstore catalogue; search by ISBN to confirm current availability · Digital book purchase optional