Brandon Dreslin, Molly C Mersinger, Shivani Patel, Alex Chaparro (2023). Flying blind: Exploring the visual cues used by helicopter pilots in degraded visual environments. In: Human Factors in Transportation. AHFE Open Access, vol. 95, pp. 656–664. https://doi.org/10.54941/ahfe1003851
Helicopter pilots rely on visual cues from the environment and instrument displays during critical phases of flight – particularly final approach and landing – to safely land. However, the specific visual cues pilots rely on and how they integrate those cues to make anticipatory inceptor inputs or corrections are not well understood. Importantly, those cues may be degraded under nighttime and brownout/whiteout conditions where the downwash of a helicopter’s rotors cause loose dirt/snow to be projected into the air, resulting in the obfuscation of the pilot’s vision outside the aircraft. The lack of visual cues in these conditions means that pilots are often ‘flying blind’ and must transition from using visual scene-based cues and motion-based cues to alphanumeric or pictographic information on displays. This transition of in-flight rules involves changes in perceptual and cognitive processing during a time of increased cognitive and physical workload. Pilots must shift their visual and attentional focus from the external scene to head-down displays. Additionally, cognitive processing shifts from natural visual cues to detection and response. This shift is not instantaneous. Delays in recognizing and understanding the alphanumeric information increases the risk of spatial disorientation. Therefore, it becomes imperative to identify what cues pilots may rely on to inform the design of displays that may be more effective under degraded viewing conditions. To address this issue, we reviewed the literature on the visual cues used to process forward motion (i.e., speed, heading), altitude, position in space, and collision detection (specifically during the landing flare). Analyses conclude that (a) optical flow supports awareness of linear motion, (b) lines of splay and depression promote altitude regulation, (c) accretion and deletion of environmental features outside the aircraft allow for roll, yaw, and heave detection, (d) motion parallax is crucial for motion detection when an aircraft is hovering, and (e) a successful landing flare may rely on a combination of time-to-contact and time-to-passage cues. These results suggest that visual cues can be incorporated in an artificial visual environment. Providing information on the visual cues processed during landing can assist designers and developers alike to design a synthetic display that facilitates spatial awareness.
Flying Blind: Exploring the Visual Cues Used by Helicopter Pilots 657
INTRODUCTION
On March 19, 2022, an Airbus Helicopters Eurocopter AS322L1 operated by the Los Angeles County Sheriff’s Department collided with a tree on the road selected for landing, rolled over on its left side, and struck the ground. Of the six crewmembers onboard, four were seriously injured. Two sustained minor injuries. According to the pilot, the helicopter entered brownout conditions on approach to the designated landing site, a dirt turnout alongside a road in Azusa, California. The pilot’s visual references of the outside environment were obscured by the dirt. At 5 ft above ground level, a crewmember told the pilot that the aircraft was drifting forward towards a tree and to hold their position. Announcing that visual contact was lost, the pilot began to climb. The helicopter continued its drift toward the tree, subsequently striking it and causing the aircraft to roll over on its left side where it hit the ground. The National Transportation Safety Board’s (2022) final report determined the probable cause of the accident to be the pilot’s failure to maintain a safe distance from the tree after losing visual references of the environment due to brownout conditions.
Helicopter pilots encounter degraded visual environments (DVE; e.g., bro- wnout or whiteout conditions) when dirt, sand, snow, or debris is kicked up during takeoff, landing, or other flight operations that occur at low altitu- des due to rotor downwash. The oscillation of debris in the air can reduce the visibility of the outside environment. Helicopter crashes due to DVE encounters pose a serious safety problem for military aviation. The value of military aircraft losses across all military branches due to DVE-related mishaps was estimated to be approximately $533 million between 2000 and 2013 (Schwartz and Greer, 2015). Additionally, the Air Force has reported that one-third of their severe aircraft accidents occur in brownout conditions (Sabbagh, 2006).
Currently, pilots experiencing DVE conditions rely upon alphanumeric and pictographic displays to land safely. However, this increases cognitive proces- sing and therefore exacerbates the risk of spatial disorientation. This paper aims to provide an understanding of the visual cues used to maintain spatial orientation during critical phases of flight such as takeoff and landing. The comprehension of such cues may contribute a modern human factors per- spective to extended reality (XR) designers and developers by informing the design of visual cues for new synthetic displays to aid pilots while landing in DVE conditions.
VISUAL CUES FOR SPATIAL AWARENESS Rotary-wing and tiltrotor pilots use two visual strategies for spatial aware- ness (Department of Defense, 2022). Primary strategies to detect the motion of the aircraft include the distant horizon and motion relative to fixed landmarks on the ground. Perception of the horizon conveys information about roll and pitch. Motion relative to nearby landmarks conveys informa- tion about forward motion, translational drift, and yaw. Pilots also employ secondary visual strategies to evaluate self-motion such as movement of the airframe relative to the external scene. The position of fixed scene features
across time and the movement relative to the edges of the aircraft airframe aid in the detection of altitude, speed, and heading (Patterson et al., 1997). The following visual cues are identified as the basis for both visual strategies.
Optical Flow Optical flow is the relative velocity (i.e., speed and direction) of objects or environmental features (e.g., edges and contours) in a pilot’s visual field as they move through the environment (Gibson, 1950). Global optical flow (GOF) refers to the total rate of flow of environmental features passing the pilot (Larish and Flach, 1990). This rate is determined by a pilot’s absolute velocity and altitude. GOF is proportional to speed and inversely proporti- onal to altitude. As speed increases and altitude decreases, GOF increases. Conversely, as speed decreases and altitude increases, GOF decreases. The direction of optical flow is obtained from two sources. First, velocity vectors diffuse outward from a central locust (Dyre and Anderson, 1997). Second, the expansion point is the location where there is no flow but the point from which all flow diffuses (Wickens and Hollands, 2000). Optical expansion rate is the perceived speed of an approaching object. Expansion rate is deter- mined by the time it takes for objects or environmental features to completely fill the retinal field. Thus, a low expansion rate indicates a slow approaching object and a high expansion rate suggests a fast-approaching object (DeLucia and Tharanathan, 2009).
Warren (1982) argued that pilots use flow rate (FR) and edge rate (ER) cues when flying at a constant altitude over a ground surface to perceive speed. Both components are measured using, and are proportional to, the observer’s ground speed and altitude. FR is expressed in eye-heights per second and can provide a reliable cue for ground speed. Altitude loss corresponds to higher FR whereas altitude gain corresponds to lower FR. Consequently, changes in FR are a reliable cue to changes in altitude when flying at a constant velocity. ER is the frequency at which the edges of texture elements or objects pass across a specified optical region (expressed in degrees of visual angle). Since ER is proportional to ground speed and altitude, the value increases as texture density increases and decreases as density decreases. A constant ER means that the number of edges passing the optical region is constant.
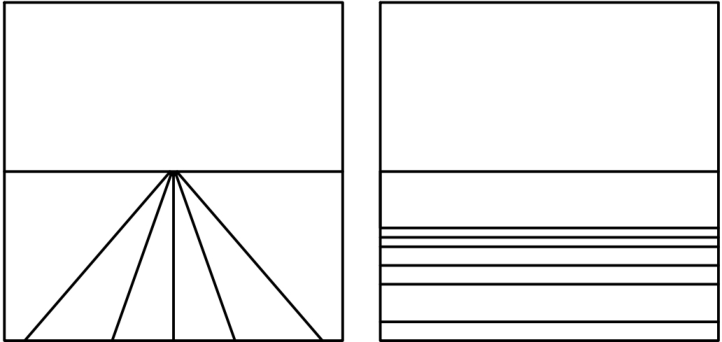
Splay and Depression Detection of altitude changes are aided by changes in perspective splay and perspective depression (Figure 1) (Warren, 1982). Defined as “the angle subtended by a line drawn from any environmental point through the vani- shing point, and the line demarcating the horizon,” perspective splay occurs when lines are drawn parallel to an observer’s current movement (Kleiss and Hubbard, 1993, p. 669).
Perspective depression assists pilots with tracking a constant altitude. Lines of depression are drawn perpendicular to an observer’s current movement and can vary in distance from one another. This is compression and is defined as “the gradient of separation between the horizontal lines” from the front to the back of the scene (Wickens and Hollands, 2000, p. 161). Research implies
Flying Blind: Exploring the Visual Cues Used by Helicopter Pilots 659
Figure 1: Lines of splay and depression. (Adapted from Garness et al., 1994.)
that lines of depression support altitude regulation when hovering over the ground (Garness et al., 1994; Flach et al., 1997).
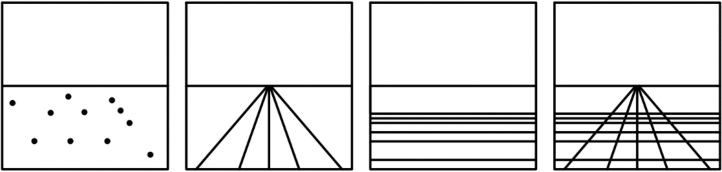
Flach et al. (1992) evaluated participants’ ability to maintain a constant altitude given random wind disturbances when presented with four different texture type displays (Figure 2): dot patterns, depression lines, splay lines, and a combination of depression and splay lines (creating a grid texture). The first experiment found that isolating depression from splay produced less precise control of both maintaining and correcting altitude changes due to wind drift during forward motion. Splay produced nominally superior per- formance across every performance measure. Duplicating the methodology for the second experiment but doubling the participants’ eye-heights yielded similar results to experiment one. Interestingly, experiment two discovered that splay was more conducive for creating an accurate mental model of the altitude participants were tasked with maintaining. This is evidenced by the fact that they were less susceptible to mental drift – the tendency to forget what altitude they are at and/or should be at – when splay was isolated from depression.
Garness et al. (1994) and Flach et al. (1997) performed similar studies. The former altered the GOF rates to 0 and 3 eye-heights per second. Results indicate that the effectiveness of each texture type display as a visual cue
Figure 2: Four texture type displays: dots, splay lines, depression lines, grid. (Adapted from Garness et al., 1994.)
to maintain altitude depends on the level of GOF. When hovering, depres- sion lines yielded the best performance. However, as GOF increases, splay supported better altitude maintenance (1994).
The latter study revealed an interaction between texture type and forward speed. At slow speeds, there was little difference between performance with depression versus splay. However, performance with depression alone degra- ded with increasing forward speeds. Performance with splay isolated from depression was independent of forward speed (Flach et al., 1997).
Pilots observe environmental features accrete (appear) or delete (disap- pear) with aircraft movement (Tanrıkulu et al., 2022). The accretion and deletion of cues such as splay and depression provides them with a greater spatial awareness because boundary edges shift even with small movements in all axes. This is especially useful during low-speed flight when FR and ER are reduced, or when splay and depression have low compression (i.e., boundary lines are spaced farther apart from each other).
Texture Density Object texture density is an important cue for spatial awareness and depth perception (Gibson, 1950). Buckland (1980) investigated the effects of texture on landing performance. The experiment consisted of four computer- generated scenes, each containing a superimposed grid texture with grid sizes of 4, 8, 16, and 25 ft. Measuring pilots’ vertical speed upon landing a simu- lated flight, it was found that the scenes containing the most detailed grids yielded the best landing performance (i.e., lower vertical speed). However, increased density did not positively impact actual flying performance.
Warren et al. (1981) tested pilots’ and nonpilots’ simulator landing success rates when presented with a runway surrounded by low- and high-density texture surfaces. Optical flow rate, flow acceleration, and fractional loss in altitude were measured. A successful landing was comprised of landing near the touchdown marker, flaring the nose on time, and descending at the speci- fied descent rate. Results found that even nonpilots could detect a fractional loss in altitude of 12.5% on 96% of the trials with high texture density. Addi- tionally, a low texture density surrounding the runway made it more difficult to detect an imminent collision with the ground.
Kleiss and Hubbard (1993) investigated the effects of three flight simula- tor scenes with increasing levels of object texture on the ability of pilots to perceive changes in altitude. Particularly important was the presentation of differing densities of vertical objects as well as the effects of texture mapping to surfaces. Inverted tetrahedrons with the base facing upwards appeared on the surface and were 5, 15, or 35 ft tall. Results suggest that pilots’ speed and accuracy of detecting changes in altitude improved as the density of vertical tetrahedrons increased up to 5 tetrahedrons per square kilometer. Additi- onally, textured terrain added to the ground surface also improved ascent detection.
Texture density within a specified region becomes finer and appears den- ser as the observer approaches the region. Conversely, the region becomes coarse and appears less dense as the observer moves further away from the
Flying Blind: Exploring the Visual Cues Used by Helicopter Pilots 661
region. This is known as nested texture (Regal and Whittington, 1994). Reardon (1988) studied the effects of nested texture on aim point performa- nce. Using a wireframe runway with different texture type displays (unfilled, dot pattern, grid pattern, or a pattern of X’s), participants were shown a computer-generated approach and estimated the simulated aircraft aim point when the image was stopped at an altitude of 50 ft. There was no difference in participant performance when viewing scenes with and without nested tex- ture. Nonetheless, Reardon concludes that dynamic texture density changes as an observer approaches an object may be a useful visual cue.
Time-to-Contact and Time-to-Passage Helicopter pilots estimate the time remaining before a collision using time- to-contact (TTC), measured using the optic variable tau. Tau is defined as the inverse of the optical expansion rate of an object on the retina (Smeets et al., 1996). Vincent and Regan (1997) discovered that lines of splay and depression positively influence TTC accuracy. However, texture density must match the object’s expansion rate or pilots might misjudge TTC. Time-to- passage (TTP) also relies on tau and provides pilots with an estimation of the time remaining before an object passes their visual field (Mouta et al., 2012). Because tau depends on optical flow and texture density to produce TTC and TTP, these cues are interconnected. That is, one cue cannot exist without the other. Pilots use these cues to estimate their distance from the ground in terms of time. This is especially helpful during the landing flare, where pilots can supplement alphanumeric display information with TTC cues for a more accurate judgment of altitude.
Motion Parallax Motion parallax helps pilots identify position relative to other landmarks through depth perception. As pilots move through the environment, obje- cts that are closer to them appear to move more than objects farther away (Mertens, 1978). This cue is generated by translation (left-right, aft-forward movement) or yaw of the aircraft, aiding pilots in their ability to detect move- ment in these axes. Rogers and Graham (1978) studied motion parallax as an independent cue for depth perception. They found that motion parallax produced a compelling perception of the relative depth of scene layout.
REPRODUCING VISUAL CUES USING EXTENDED REALITY Recent efforts have sought to mitigate brownout spatial disorientation by using XR to reproduce visual cues in a virtual environment. Münsterer et al. (2014) developed a synthetic vision system that displays three-dimensional cues and symbols in a head-tracked head-mounted display (HMD). Using sensors to scan environmental features, a conformal landing symbology that provides visual cues is drawn into the HMDs in real time as pilots appro- ach the desired landing zone. The symbology creates augmented reality (AR) guidance markers such as a demarcated landing zone (DLZ) with the shape of a doghouse, a grid created using lines of splay and depression within the DLZ, and posts of differing heights situated around the perimeter. These AR
objects create visual cues: (1) the grid creates lines of splay and depression to provide optical flow, TTC, and TTP; (2) the posts serve as a method to perceive motion parallax. Because the objects are drawn and shown in real time, pilots can detect small changes in the environment as they maneuver the aircraft. However, several trials highlighted that pilots must be able to distinguish between the real-world environment and the AR markers being drawn into the HMD to avoid confusion.
Ernst et al. (2019) evaluated the grid concept. Recreating the grid over a synthetic ocean surface (a surface that normally lacks lines of splay and depression, and therefore optical flow) and measuring whether pilots could perceive motion as well as the wind direction and speed, it was found that pilots were more successful with the grid than without it. Further, the grid allowed pilots to gauge the velocity of a drift. Although the grid was not sufficient for pilots to judge ground speed, it could be because the lines of splay and depression were low in compression, thus not providing enough local cueing for motion perception. Higher compression may yield a greater visual stimulus to the pilot due to a higher edge rate and flow rate.
Szoboszlay et al. (2021) produced a degraded visual environment miti- gation (DVE-M) system for rotorcraft. Many concepts mimic features of Münsterer et al. (2014). However, the doghouse is now a rectangular stru- cture with four posts facing the pilot and chevrons for directional guidance. Usability testing indicates a high level of successful landings during brow- nouts. The authors conclude that the DVE-M system is ready for large-scale product development.
New AR approaches to spatial disorientation mitigation are also being developed. Ernst et al. (2019) proposed exocentric views to the existing AR display design. An exocentric perspective allows pilots to view their position from outside the helicopter. This approach may afford more precise control of their movements because vision is not blocked by the airframe. Initial testing supported this theory. However, technological limitations such as restricted field of view present obstacles to overcome before exocentric perspectives are implemented.
CONCLUSION
This review summarizes some of the visual cues helicopter pilots rely on to judge a helicopter’s orientation and movement, and may serve as the basis for developing new display concepts to aid landing in DVE without the need for reliance on alphanumeric and pictographic displays.
REFERENCES
DeLucia, P. R. and Tharanathan, A. (2009). Responses to deceleration during car following: Roles of optic flow, warnings, expectations, and interruptions. Journal of Experimental Psychology: Applied, 15(4), pp. 334–350. doi: 10.1037/a0017877. Department of Defense (2022). Visual display design for mitigation of helicopter and
tiltrotor brownout spatial disorientation. (Report No. N22A-T001). Available at: https://www.sbir.gov/node/2101559.
Flying Blind: Exploring the Visual Cues Used by Helicopter Pilots 663
Dyre, B. P. and Andersen, G. J. (1997). Image velocity magnitudes and perception of heading. Journal of Experimental Psychology: Human Perception and Performance, 23(2), pp. 546–565. doi: 10.1037//0096-1523.23.2.546. Ernst, J. M., Peinecke, N., Ebrecht, L., Schmerwitz, S. and Doehler, H. (2019). Virtual cockpit: An immersive head-worn display as human-machine interface for helicopter operations. Optical Engineering, 58(5), pp. 1–15. doi: 10.1117/1. OE.58.5.051807. Flach, J. M., Hagen, B. A. and Larish, J. F. (1992). Active regulation of altitude as
a function of optical texture. Perception & Psychophysics, 51(6), pp. 557–568. doi: 10.3758/BF03211653. Flach, J. M., Warren, R., Garness, S. A., Kelly, L. and Stanard, T. (1997). Perception and control of altitude: Splay and depression angles. Journal of Experi- mental Psychology: Human Perception and Performance, 23(6) pp. 1764–1782. doi: 10.1037/0096-1523.23.6.1764. Garness, S. A., Flach, J. M., Stanard, T. and Warren, R. (1994). The basis for the
perception and control of altitude: Splay & depression angle components of opti- cal flow. Proceedings of the Human Factors and Ergonomics Society Annual Meeting, 38(19), pp. 1275–1279. doi: 10.1177/154193129403801906. Gibson, J. J. (1950). The perception of the visual world. Boston, MA: Houghton Mifflin. Kleiss, J. A. and Hubbard, D. C. (1993). Effects of three types of flight simu-
lator visual scene detail on detection of altitude change. Human Factors: The Journal of the Human Factors and Ergonomics Society, 35(4), pp. 653–671. doi: 10.1177/001872089303500406. Larish, J. F. and Flach, J. M. (1990). Sources of optical information useful for perception of speed of rectilinear self-motion. Journal of Experimental Psychology: Human Perception and Performance, 16(2), pp. 295–302. doi: 10.1037/0096- 1523.16.2.295. Mertens, H. W. (1978). Comparison of the visual perception of a runway model
in pilots and nonpilots during simulated night landing approaches. Washington, DC: Federal Aviation Administration Office of Aviation Medicine. Available at: https://apps.dtic.mil/sti/pdfs/ADA054450.pdf Mouta, S., Santos, J. A. and Lopez-Moliner, J. (2012). The time to passage of biological and complex motion. Journal of Vision, 12(2):21, pp. 1–14. doi: 10.1167/12.2.21. Münsterer, T., Schafhitzel, T., Strobel, M., Völschow, P., Klasen, S. and Eisenkeil, F.
(2014). Sensor-enhanced 3D conformal cueing for safe and reliable HC operation in DVE in all flight phases. SPIE Proceedings. doi: 10.1117/12.2050377. National Transportation Safety Board (2022). Aviation investigation final report. (Report No. WPR22LA125). Washington, DC: National Transportation Safety Board. Available at: https://data.ntsb.gov/carol- repgen/api/Aviation/ReportMain/GenerateNewestReport/104802/pdf Owen, D. H., Warren, R., Jensen, R. S., Mangold, S. J. and Hettinger, L. J.
(1981). Optical information for detecting loss in one’s own forward speed. Acta Psychologica, 48(1-3), pp. 203–213. doi: 10.1016/0001-6918(81)90062-7. Owen, D. H. (1982). Optical flow and texture variables useful in simu- lating self-motion. Defense Technical Information Center. Available at: https://apps.dtic.mil/sti/citations/ADA117016. Patterson, F. R., Cacioppo, A. J., Gallimore, J. J., Hinman, G. E. and Nalepka, J. P.
(1997). Aviation spatial orientation in relationship to head position and altitude
interpretation. Aviation, Space, and Environmental Medicine, 68(6), pp. 463–471. Available at: https://pubmed.ncbi.nlm.nih.gov/9184732/. Regal, D. M. and Whittington, D. H. (1994). Synthetic vision display evaluation studies. NTRS – NASA Technical Reports Server. Available at: https://ntrs.nasa.gov/citations/19940033147. Reardon, K. A. (1988). The effects of nested texture on a landing-judgment task.
Proceedings of the Human Factors Society Annual Meeting, 32(2), pp. 10–14. doi: 10.1177/154193128803200201. Rogers, B. and Graham, M. (1978). Motion parallax as an independent cue for depth perception. Perception, 8(2), pp. 125–134. doi: 10.1068/p080125. Sabagh, L. (2006). Flying blind in Iraq: US helicopters navigate real desert storms. Popular Mechanics, 3, pp. 1–4. Available at: https://www.popularmechanics.com/military/a5540/4199189/ Schwartz, J. A. and Greer, W. L. (2015). Assessment of brownout mishaps in military
rotorcraft. Defense Technical Information Center. Available at: https://apps.dtic. mil/sti/pdfs/AD1123124.pdf Smeets, J. B. J., Brenner, E., Trébuchet, S. and Mestre, D. R. (1996). Is judging timeto-contact based on ‘tau’? Perception, 25(5), 583–590. doi: 10.1068/p250583. Smith, M. R. H., Flach, J. M., Dittman, S. M. and Stanard, T. (2001). Monocu-
lar optical constraints on collision control. Journal of Experimental Psychology: Human Perception and Performance, 27(2), pp. 395–410. doi: 10.1037/0096- 1523.27.2.395. Szoboszlay, Z., Miller, J., Godfroy-Cooper, M., Davis, B., Feltman, K., Hartnett, G., Durbin, D., Hicks, J., Plitsch, J., & Ott, C., Leatherbury, E., Carr, J., Wal- dman, D., Fujizawa, B., Whalley, M., Takahashi, M., Goerzen, C., Schulein, G., Harrington, W., Mielcarek, N. and Subr, R. (2021). The design of pilot cueing for the degraded visual environment mitigation (DVE-M) system for roto- rcraft. Vertical Flight Society’s 77th Annual Forum and Technology Display. doi: 10.4050/F-0077-2021-16746. Tanrıkulu, Ö. D., Froyen, V., Feldman, J. and Singh, M. (2022). The interpreta-
tion of dynamic occlusion: Combining contour geometry and accretion/deletion of texture. Vision Research, 199, 108075. doi: 10.1016/j.visres.2022.108075. Vincent, A. and Regan, D. (1997). Judging the time to collision with a simulated textured object: Effect of mismatching rate of expansion object size and texture element size. Perception & Psychophysics, 59(1). doi: 10.3758/bf03206845. Warren, R., Owen, D. H. and Hettinger, L. J. (1981). Effects of exponen-
tial texture spacing and speed on perceived egospeed. Paper presented at the Meeting of the Psychonomic Society, Philadelphia, PA. Available at: https://apps.dtic.mil/sti/pdfs/ADA117016.pdf. Wickens, C. D. and Hollands, J. G. (2000). Engineering psychology and human performance. 3rd edn. Upper Saddle River, NJ: Prentice Hall.
LISTED IN THE AHFE DIGITAL BOOKSTORE CATALOGUE
Explore the complete digital volume
Human Factors in Transportation
Read this individual research paper free through the original publisher, or explore the full digital proceedings book.
ISBN 978-1-958651-71-1
Explore this ISBN in the AHFE Bookstore ↗Listed in the July 2026 bookstore catalogue; search by ISBN to confirm current availability · Digital book purchase optional