Felix Teifer, Ivan Sikora, Alexandros Paraskevas (2023). Black Hole Illusion In Aviation – A Simulator Experiment to examine Predominant Criteria in a Real–Life Environment. In: Human Factors in Transportation. AHFE Open Access, vol. 95, pp. 636–644. https://doi.org/10.54941/ahfe1003849
Black Hole Illusion (BHI) is the cause of a significant number of fatal aviation accidents, Controlled Flight Into Terrain (CFIT) events due to “lack of vertical and/or horizontal position awareness in relation to terrain” [1] and is listed as an “environmental threat”, owning a specific section in annual worldwide safety reports [2] [3]. To date, relevant studies focused on whether and how much a single factor affects the pilot’s disorientation, whereas this study considers all the known factors plus runway illumination levels in the same simulation. The simulations conducted in these studies involved one pilot each time and were conducted with a single computer screen and a joystick or in a non-movable fixed-base simulator whereas this study aims to explore BHI in the realistic environment of a movable airline-approved A-320 full-flight simulator with a real-life aircraft cockpit operated by two pilots (captain and first officer). We examine all the factors that have been thus far explored as – causes of BHI and we added light illumination levels [4] and lateral deviation of the flight path that have never been examined before. We followed an exploratory approach with active airline pilots in a simulation where conditions causing BHI were replicated. To measure deviations from the standard approach path, all crews were asked to attempt visual starless night approaches to a predetermined set of airports. While one participant was performing the approaches, the other silently observed, taking notes to assess agreement or disagreement with the flown approach path. In each scenario, landing approaches were attempted by both captain and first officer to establish whether the pilot’s position also affects BIH. We used mix-ed methods to record the outcomes [5]. Quantitative data were generated by specific measurements from deviations of the standard flight path generated by the participants attempting the landing. Qualitative data were collected from the co-pilots’ observations and post-simulation interviews. The initial analysis indicates that the occurrence of BHI in general can be confirmed at a certain distance in the final approach sector (~ 2,5nm – 0,3nm before the runway). Light intensities and the shape of the runway could be confirmed as contributing factors due to significant variations in altitude deviations. The pilot flying the aircraft and the pilot monitoring the approach seem to not have suffered from the illusion to the same extent. Significant lateral deviations could not be observed.It is anticipated that the final findings will affect both flight situational awareness training standards and flight operational policies, contributing towards reducing human error in aviation and increasing flight safety.This study is expected to contribute to the minimisation of human errors and will consequently help increase flight safety. Originality factors are:-common commercial aviation standard full-flight simulator to generate real-life pilot environment and landing conditions-two-subject-participation to represent a complete cockpit crew to assess differences in landing the aircraft from the captain´s or first officer´s perspective-different runway lighting illumination levels in combination with varying lengths of runway and widths References[1] Kelly, D. and Efthymiou, M. (2019). An analysis of human factors in fifty controlled flight into terrain aviation accidents from 2007 to 2017. Journal of Safety Research, 69, pp. 155–165.[2] IATA (2020). Safety Report: 2019 Edition, Montreal (CA): International Air Transport Association, p.234. [3] IATA (2021). Safety Report: 2020 Edition, Montreal (CA): International Air Transport Association, p.222[4] Socha, V. et al. (2020). Black Hole Approach: A Systematic Review, Proceedings of the 22nd International Conference on New Trends in Civil Aviation 2020, pp. 117–121.[5] Almalki, S. (2016). Integrating Quantitative and Qualitative Data in Mixed Methods Research—Challenges and Benefits. Journal of Education and Learning, 5(3), p. 288.
Aviation technology is continuously evolving and aircraft and aircraft systems become increasingly reliable. However, the human factor (HF) remains the primary contributing cause for accidents, incidents, and near-misses in com- mercial aviation (Rankin, 2007; IATA, 2021). Considerable research (c.f. Caldwell, 2005; Harris, 2011) has been undertaken on the different HFs causes in aviation accidents and incidents such as fatigue, situation awa- reness, distraction in the cockpit, etc. Most of the studies have shown that the most significant human factor causing accidents is situational awareness (SA).
There are five general situational awareness requirements in aviation, i.e., elements that are necessary for the flight crew to have full situational awareness: Geographical SA; Spatial/Temporal SA; System SA; Environmen- tal SA; and Tactical SA (Endsley, 1997). Spatial/Temporal SA is becoming
Black Hole Illusion in Aviation – A Simulator Experiment 637
especially important in the approach and landing phase of a flight. This phase, although it covers only 16% of total flight time, accounts for 44% of all fatal accidents and it is three times more likely to be the cause of an acci- dent at night than during the daytime. Flight Safety Foundation discovered in a study that 21% out of 76 accidents and incidents during approach and landing, were caused by flight crew disorientation or visual illusions (Khatwa and Helmreich, 1999). A visual illusion may occur during a final approach over an upsloping terrain with a flat runway, or to an unusually narrow or long runway where the pilot may wrongly feel that the aircraft flies too high and increases their rate of descent, positioning the aircraft in an unusually low approach path. One particular type of visual illusion is the Black Hole Illusion (BHI), which combines all the essential components of aviation acci- dents’ causes in this context. This illusion can happen during a final approach to a lighted runway (ECCAIRS Aviation, 2013) at a lightless night (with no stars or moonlight) over water or unlit terrain (featureless terrain). In such conditions, the horizon is not visible and, therefore, the illuminated runway is the only visual cue (Nicholson and Stewart, 2013) for the pilot. The ‘black hole’ is not the runway but the runway’s environment, the featureless terrain surrounding the airstrip (Gibb, Gray, and Scharff, 2010, p. 159).
BHI is the cause of a significant number of fatal aviation accidents, Controlled Flight Into Terrain (CFIT) events due to “lack of vertical and/or horizontal position awareness in relation to terrain” (Kelly and Efthymiou, 2019) and is listed as an “environmental threat”, owning a specific section in annual worldwide safety reports (IATA, 2020, 2021).
To date, relevant studies focused on whether and how much a single factor affects the pilot’s disorientation, whereas this study considers all the known factors plus runway illumination levels in the same simulation. The simu- lations conducted in these studies involved one pilot each time and were conducted with a single computer screen and a joystick or in a non-movable fixed-base simulator. This study aimed explored BHI in the realistic envi- ronment of a movable airline-approved A-320 full-flight simulator with a real-life aircraft cockpit operated by two pilots (captain and first officer). It examined all different runway shapes that may cause BHI to aircraft pilots including light illumination levels and lateral deviation of the flight path that have never been examined before (Socha et al., 2020). Previous research extracted altitude data each 0.5 nautical mile (nm) from the runway (Robin- son et al., 2020) whereas this study collected measurements each 0.1 nm in order to generate a more precise analysis of at what distance the occurre- nce of BHI can be located. A qualitative survey was used to confirm if the pilot, who was actively controlling the aircraft (PF) and the co-pilot, who was silently monitoring the flown flightpath (PM), suffered from the exact same illusion.
The main objectives are to determine, at what distance from the runway BHI can be confirmed in real-world conditions and if the optical illusion theory, telling ‘the brighter the lights are set, the steeper the approaches are performed‘ can be verified by comparison of the extracted altitude errors. Also, the shape of the runways in correlation to the experience of BHI will be examined. If PF and PM are exposed to BHI to the same extent, is verified
by the above-mentioned qualitative survey. Already established knowledge in this area will be immersed and this modified approach will offer new food for thought for professional aviators as well as for optical illusion theorists.
In the following sections, recruitment, experimental setup, and data col- lection will be discussed in detail as well as the way of analysis and the consequential findings.
MATERIAL AND METHODS Participants
Six Airbus-rated commercial pilots were recruited for this study (mean age = 46.8 years, SD = 8.2). The participants were told that the simula- tion was for a study related to the ‘retention of manual flying skills‘ in order to avoid any biased behaviour towards BIH which would ‘contaminate the data’. Although five of them were active airline pilots with experience of con- trolling an actual aircraft of the airplane-family which was being used in the simulation (average flight hours: 10.710), one participant was found at the end of the simulation as not fully meeting the criteria and all data collected from him had to be discarded due to significant problems with the handling of the simulation device and unsteady, overcompensating inputs on the flight controls.
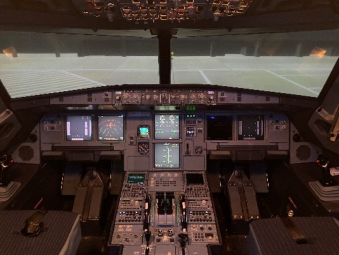
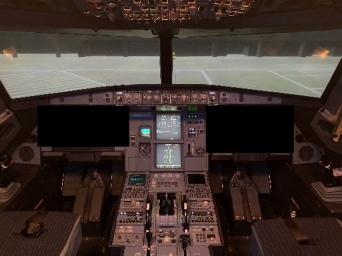
Apparatus An Airbus A-320 full-flight simulator was used for this study. The simu- lator is an exact replica of an actual aircraft cockpit: it generates real-life motion and is controlled by realistic flight instruments. Fig. 1 shows the cock- pit layout of the flight simulator. During the experiment, a handheld video recording device was mounted in front of both primary flight displays (PFD’s) to record the flight parameters, covered by black fabric (Fig. 2): the standby horizon was kept visible to initially assess the vertical and horizontal position of the aircraft.
Design and Experimental Procedure and Test Conditions The study followed an exploratory approach to assess all factors leading to BHI. Real-life runways with different lengths and widths were selected to
Figure 1: Airbus A-320 cockpit-layout.
Black Hole Illusion in Aviation – A Simulator Experiment 639
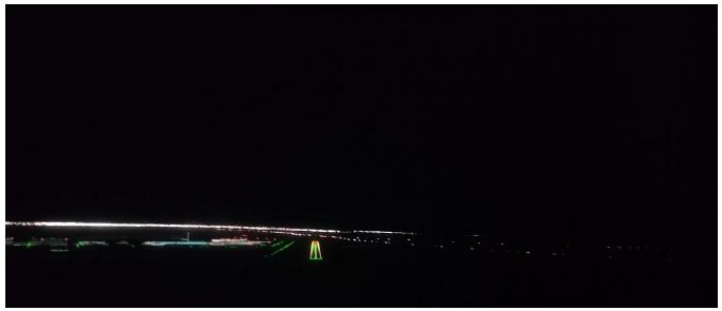
Figure 2: Airbus A-320 cockpit-layout in the conditions of the experiment: flight instruments covered.Figure 3: Cockpit - view of a landing approach towards a runway in conditions conducive to BHI.
cover all possible combinations: One airport has a runway that is short and narrow, one that is short and wide. One airport has a runway that is long and narrow, one airport will have a runway that is long and wide. A pre- experimental test run took place ∼two months prior to the actual experiment to ensure all selected airports were available in the simulator database, the mountings and coverings of the recording devices were applicable and the planned scenarios accomplishable.
Conditions causing BHI were replicated: the light in the simulation device was dimmed at all times as prevailing during night operation flights, all exte- rior lights were turned off to make the visible runway the only illuminated visual cue (Fig. 3). Exterior conditions causing BHI were replicated, such as featureless terrain before the runway and ‘night-time scenario’ was selected in the simulator setup. Standard temperature of 15
C at mean sea level (MSL), standard barometer setting (1013hPa) and zero wind conditions were sele- cted for all scenarios. The simulated aircraft had a standard medium weight of 60t. Airports at MSL without significant inclination criteria were selected to generate comparable results. All instrument approach guiding systems inside the aircraft and at the airport were deselected at all times.
To measure deviations from the standard approach path, all crews were asked to attempt visual starless night approaches to a predetermined set of 4 real-life airports: long & wide, long & narrow – short & wide, short & narrow. One hour prior to the simulation, a briefing was held to outline all expected tasks and to allow answers to any arisen questions.
The participants were assigned as captain respectively first officer and asked to take their dedicated seating position. Before the scenarios were con- ducted, each participant performed a visual approach to London Heathrow Airport under daylight conditions to familiarise themselves with the aircraft.
In each scenario, the aircraft was in level flight with the autopilot-function active, final flaps configuration, on final approach speed (140kts) with active auto-thrust and below the desired glide path. The participants were asked to disconnect the autopilot when they felt at the correct position to intercept the desired standard 3-degree-approach path towards the runway ahead. While the captain was performing the approaches, the first officer silently observed and took notes to assess agreement or disagreement with the flown approach path. In each scenario, landing approaches were attempted by both captain and first officer. All scenarios were ended ∼100 ft above the runway threshold in order to avoid any unsuccessful landings. After completion of all scenarios, the seating positions were switched (i.e., the first officer of the first round became the captain in the second round) and the same scenarios were flown from the respective other seating position but in random order. A total of 80 comparable approaches were accomplished.
RESULTS
The actual altitude measurements were extracted from the video recordings each 0.1 nm, starting from 6.0 nm until 0.3 nm from the desired touchdown point. 58 measurements from each attempted landing were generated. The target altitude of the desired standard approach path was subtracted from this measurement in order to calculate the altitude error: the bias located the position relatively to the standard 3-degree approach path.
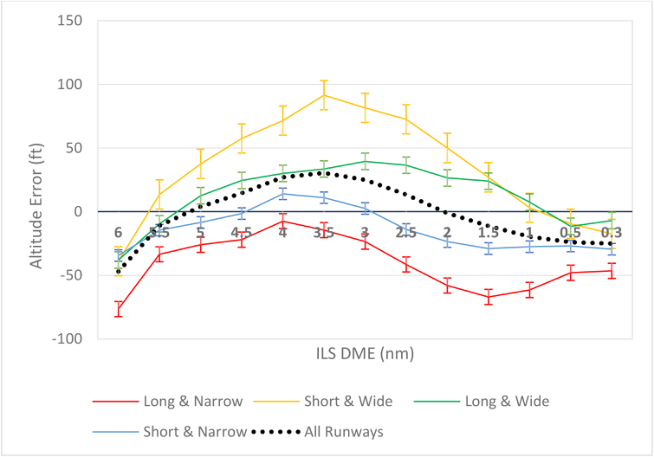
Altitude Error = Actual Altitude −Target Altitude The mean altitude deviation for each runway approached was calculated using the formula above (Fig. 4). The total mean altitude error shows the average altitude error through all of the commenced approaches, visualizing standard errors for all scenarios.
The short & wide – runway identified the greatest deflection above the desired glide path with an altitude error of +80ft. Approaches towards the long & narrow runway contain the greatest deflection below the desired glide path of ∼-60ft. The mean altitude error confirms the occurrence of BHI between 2.0 nm and 0.3 nm from the desired optimum touchdown point.
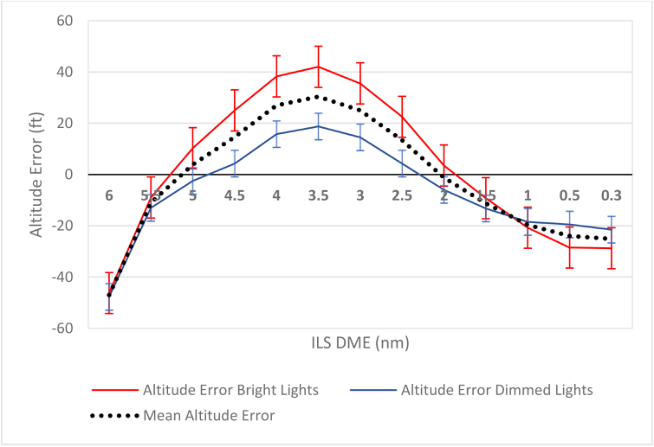
Fig. 5 contains data from all flown approaches with focus on the runway illumination levels. Both lighting levels show an altitude error of ∼-50ft below the desired standard flight path at the start of each approach.
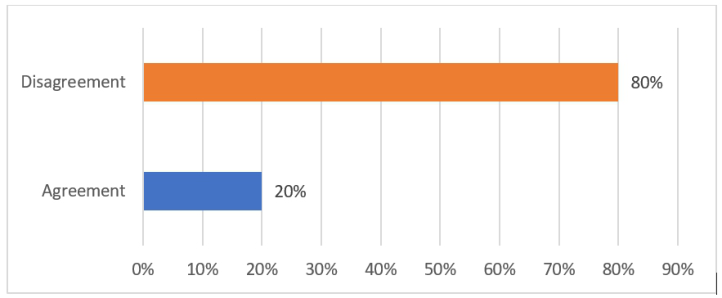
The qualitative survey showed a significant disagreement between PM and PF (Fig. 6).
Black Hole Illusion in Aviation – A Simulator Experiment 641
Figure 4: Mean altitude errors of approaches to all runways.Figure 5: Mean altitude errors of all approaches with focus on the light intensity levels.
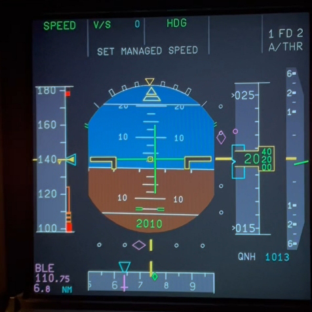
Fig. 7 shows a sample picture of the Primary Flight Display (PFD) during an actual approach in the study. The here visible deflection of the localizer of half a scale is the maximum deflection that has been observed by any of the conducted flight scenarios. One dot represents a deviation of ±0.8
on the localizer scale. This deflection is within all limits for instru- ment approaches (ICAO, 2020) which are even more limiting than visual approaches.
Figure 6: Pilot monitoring’s evaluation on the observed flight path as standard-3- degree-approach.Figure 7: Primary flight display (PFD).
DISCUSSION
The results show, the BHI criteria in a real-life environment could be repli- cated successfully. The findings from this simulation not only confirmed the findings of Mertens and Lewis (1982) and Nicholson (2013), but even narro- wed down the occurrence of BHI to a distance from 2.0 nm to 0.3 nm from the optimum desired touchdown point. It is assumed, the data collection from each 0.1 nm distance could be made mandatory accountable for this result.
The findings presented in Fig. 4 show a significant lower approach profile to the narrow runways which indicates, approaches to runways with narro- wer width are more subject to lead to an overestimation of the actual altitude in a BHI environment and consequently to an accident.
The altitude errors (Fig. 5) of both graphs confirm the existence of a ‘concave approach path’ which is typical for attempted landings in BHI conditions (Gibb, Schvaneveldt and Gray, 2008).
The optical illusion theory says, the brighter the lights are set, the lower the flown approach paths will be (Schiff, 1990). This theory could not be
Black Hole Illusion in Aviation – A Simulator Experiment 643
fully confirmed since the dimmed light setting generated lower approaches in the middle sector of the approach path which means that there might be the opposite effect at a certain distance. In the final sector before the runway, where the occurrence of BHI could be located, the brighter light setting led to lower approaches, proving the optical illusion theory right. In essence, bright lighting seems to intensify BHI. The distance from ∼1 nm until the com- pletion of the approach, the brighter light setting generated an even double negative altitude error than the dimmed light setting which means as closer the aircraft gets to the runway, the higher the effect of the illusion becomes.
From the qualitative note’s extracted data (Fig. 6) showed a significant disagreement between PM and PF, indicating that both pilots did not suffer from the exact same illusion.
As shown in Fig. 7, the maximum lateral deviation from the desired opti- mal flight path observed was 0.4
on the localizer scale. This deviation is even within the limit for automated instrument approaches at low visibility operation which means that for experienced airline pilots even under BHI conditions, there is no effect on the lateral control of the aircraft, therefore the risk for an accident is low.
Due to the small number of participants, this study can only be considered as ‘exploratory’ and its findings cannot be generalised. Nevertheless, they can be considered as a foundation for further and larger studies in the field of pilot visual disorientation.
CONCLUSION
BHI conditions have been replicated effectively in the intended scenarios. The initial analysis indicates that the occurrence of BHI in general can be confir- med at a certain distance in the final approach sector (∼2.0 nm – 0.3 nm from the optimum touchdown point). Light intensities and the length and width of the runway could be confirmed as factors due to significant vari- ations in the altitude deviations for the approaches during this simulation. The pilot flying the aircraft and the pilot monitoring the approach seem not to have experienced the same type of disorientation. Under BHI conditions, there were no significant lateral deviations.
ACKNOWLEDGMENT
This research was funded by University of West London. The authors would like to thank all participants for their voluntary participation.
REFERENCES
Almalki, S. (2016). Integrating Quantitative and Qualitative Data in Mixed Methods Research—Challenges and Benefits. Journal of Education and Learning, 5(3), p. 288. Caldwell, J. A. (2005). Fatigue in aviation. Travel Medicine and Infectious Disease,
3(2), pp. 85–96. ECCAIRS (2013) Attribute Values. Available at: https://www.icao.int/safety/airnav igation/AIG/Documents/ADREP%20Taxonomy/ECCAIRS%20Aviation%201. 3.0.12%20(VL%20for%20AttrID%20%20430%20-%20Occurrence%20categ ory).pdf (Accessed: 7 Jul 2021).
Endsley, M. R. (1997). Supporting Situation Awareness in Aviation Systems. IEEE International Conference on Systems, Man and Cybernetics, 5, pp. 4177–4181. Gibb, R., Gray, R. and Scharff, L. (2010). Aviation Visual Perception - Research,
Misperception and Mishaps, Farnham (UK): Ashgate Publishing Ltd. Gibb, R., Schvaneveldt, R. and Gray, R. (2008). Visual Misperception in Aviation: Glide Path Performance in a Black Hole Environment. The Journal of the Human Factors and Ergonomics Society, 50(4), pp. 699–711. Harris, D. (2011). Human Performance on the Flight Deck, London (UK): CRC Press. IATA (2020). Safety Report: 2019 Edition, Montreal (CA): International Air
Transport Association. Available at: https://www.skybrary.aero/bookshelf/book s/5640.pdf (Accessed: 21 April 2021). IATA (2021). Safety Report: 2020 Edition, Montreal (CA): International Air Transport Association. Available at: https://www.iata.org/en/publications/safety-repo rt/ (Accessed 9 April 2021). ICAO (2020). Safety Report: 2020 Edition, Montreal (CA): International Civil Avia-
tion Organization. Available at: https://www.icao.int/safety/Documents/ICAO_S R_2020_final_web.pdf (Accessed 29 January 2023). Kelly, D. and Efthymiou, M. (2019). An analysis of human factors in fifty controlled flight into terrain aviation accidents from 2007 to 2017. Journal of Safety Research, 69, pp. 155–165. Khatwa, R. and Helmreich, R. L. (1999). Analysis of Critical Factors During Appro-
ach and Landing in Accidents and Normal Flight: Data Acquisition and Analysis Working Group Final Report. SAE Technical Papers, 108, pp. 1173–1266. Mertens, H. W. and Lewis, M. F. (1982) Effects of Approach Lighting and Variation in Visible Runway Length on Perception of Approach Angle in Simulated Night Landings. Aviation Space and Environmental Medicine, 54(6), pp. 500–506. Nicholson, C. M. and Stewart, P. C. (2013). Effects of Lighting and Distraction on
the Black Hole Illusion in Visual Approaches. International Journal of Aviation Psychology, 23(4), pp. 319–334. Rankin, W. (2007). MEDA Investigation Process, Boeing Aeromagazine, 26 (Quarter 2), pp. 15–21. Available at: https://www.boeing.com/commercial/aeromagazine/a rticles/qtr_2_07/AERO_Q207_article3.pdf. (Accessed 9 April 2021). Robinson, F. E. et all. (2020). A Comparative Evaluation of Hypotheses to Explain
the Black Hole Illusion, International Journal of Aerospace Psychology, 30(1–2), pp. 54–68. Schiff, B. (1990). Accident Prevention For Everyone Concerned with the Safety of Flight, Flight Safety Foundation, 47(3), pp. 1–4. Socha, V. et al. (2020). Black Hole Approach: A Systematic Review, Proceedings
of the 22nd International Conference on New Trends in Civil Aviation 2020, pp. 117–121.
LISTED IN THE AHFE DIGITAL BOOKSTORE CATALOGUE
Explore the complete digital volume
Human Factors in Transportation
Read this individual research paper free through the original publisher, or explore the full digital proceedings book.
ISBN 978-1-958651-71-1
Explore this ISBN in the AHFE Bookstore ↗Listed in the July 2026 bookstore catalogue; search by ISBN to confirm current availability · Digital book purchase optional