Eli Alston-Stepnitz, Angela Sanguinetti, Emily Searl (2023). Use and usability of shared micromobility among underserved youth in California. In: Human Factors in Transportation. AHFE Open Access, vol. 95, pp. 478–488. https://doi.org/10.54941/ahfe1003833
The aim of this research was to document user experience with shared micromobility as part of a program that provided at-risk youth (age 18-27) with free shared micromobility services for a year. The study found that the young participants readily embraced shared micromobility services, which were used to access jobs, health and social services, and for social and recreational purposes. Users were often effusive about their enjoyment of e-bikes and e-scooters compared to other modes of transportation. The study also identified usability challenges that highlighted needs for more education on proper use and protected street infrastructure for micromobility, as well as opportunities for increased utility through vehicle design features. Findings can inform service providers, equipment manufacturers, and mobility program designers to improve micromobility user experience for a segment of the population who can reap great benefits from these services.
The increasing popularity of shared micromobility has led to growing inte- rest in understanding user experience with these modes, which include on-demand docked and dockless bikes, e-bikes and e-scooters. Micromobility has advantages including convenience and health benefits (Fishman, 2016; Shaheen and Cohen, 2019; Gössling, 2020), but also challenges, such as safety and equity (Shaheen and Cohen, 2019; Bai and Jiao, 2020; Gössling, 2020). Due to costs and accessibility, low-income and rural communities often miss out on these technologies and their benefits (Lucas et al., 2016; Mooney et al., 2019). Pilot programs have begun to test the idea of Universal Basic Mobility (UBM)— that the government should provide transportation services to ensure access to basic needs. UBM programs typically provide free- or reduced-fare public transit and shared mobility services to underse- rved communities. This paper draws on an evaluation of a UBM-inspired pilot to document micromobility user experience.
BACKGROUND
Located in California’s San Joaquin Valley, Bakersfield is a productive agri- cultural center and California’s 9th largest city (U.S. Census Bureau, 2022).
Use and Usability of Shared Micromobility Among Underserved Youth in California 479
Median household income is $69,104 and the poverty rate is 16%. One-third of Bakersfield’s population of 407,615 is under 18. The rate of disconne- cted youth (those neither working nor in school) is the second highest in the country at 20% (Lewis, 2022).
Spin, an operator of shared dockless electric scooters and bikes, spearhea- ded a UBM-inspired pilot in Bakersfield in partnership with Kern County Network for Children (KCNC), a resource center for current and former foster youth. The original plan included providing 100 participants with free Spin services and bus passes for one year, but the final design inclu- ded only Spin services. Spin launched e-scooters in January 2022, when the pilot began, and the plan was to add e-bikes, but the city decided to exclude e-scooters in the subsequent agreement to launch 125 e-bikes in April 2022. For both e-scooters then e-bikes, participants were given a daily allotment of up to 5 free rides of 30 minutes or less. Given a $1 unlocking fee and $0.39 cent per-minute cost to ride for typical Spin users in Bakersfield, the estimated value of this offering was $63.50 per day and $23,177.50 for the year for each pilot participant. This value is exceptional compared to other (government-funded) pilots, even when compared to the total value of a broader set of service offerings (Rodier, et al., n.d.; Tan et al., 2021).
Participants needed access to a smart phone with the Spin app, but were not required to provide credit card information. Dream Center staff and par- ticipants were provided with training videos and a map of operating zones. Spin visited the Dream Center to train staff and donate helmets. Staff orien- ted pilot participants to the vehicles upon enrollment. Accounts could be shut down due to ride overages, but there was no limit to the number of account reinstatements for participants if they or Dream Center staff communicated about a problem or need.
Dream Center staff recruited clients they believed would be a good fit (e.g., newly located in supportive housing, seeking employment, emotionally stable). They also reached out to other organizations providing youth social services to invite them to refer their clients. Spin enrolled 125 participants and planned to run the program through March 2023, but unprecedented levels of vandalism to the e-bikes effectively resulted in the program ending in the fall of 2022 because virtually all vehicles were either missing or held up in maintenance.
LITERATURE REVIEW
Shared micromobility can benefit various users, for example, improving mobility for those without cars (Smith and Schwieterman, 2018; Mooney et al., 2019). Popular on university campuses (Jiao and Bai, 2020), shared micromobility is more commonly used by young adults, 18 and 34 years old (Caspi et al., 2020; Shaheen et al., 2020; Wang et al., 2021; Mohammadian et al., 2022), and those with high levels of income and education (Jiao and Bai, 2020; Shaheen et al., 2020). Recreation and leisure are often highlighted as primary use cases for shared micromobility, but these modes can also be used for commuting, errand running, and filling in last-mile public transit gaps (McNeil et al., 2017; Gössling, 2020; Tan et al., 2021; Mohammadian
et al., 2022). Particularly dockless micromobility services can provide conve- nient and flexible options for short trips, especially in areas where public transportation is not readily available.
While still generally less prevalent, recent studies show an uptick in shared micromobility usage among low-income populations (Jiao and Bai, 2020; Mohammadian et al., 2022). These users face unique logistical and tech- nological barriers. They may lack credit cards, smartphones, data plans, or “digital literacy” required to use services (Borade et al., 2020; Dill and McNeil, 2021; Tan et al., 2021), and operating zones often exclude low- income areas (Pan and Shaheen, 2021). Lack of familiarity with the services is also a barrier (Tan et al., 2021).
Usability challenges for all micromobility users include lack of sufficient vehicle availability, particularly for dockless services due to low fleet density, inaccurate mapping of vehicles in service mobile apps, and misuse of vehicles such as hiding scooters or taking them onto private property (Tuncer and Brown, 2020). The intersection of dockless vehicles and user behavior can also create hazardous situations via riding on sidewalks and parking in pede- strian paths (Borade et al., 2020). Insufficient safe street facilities for riding is also a major safety concern and barrier to use (e.g., Tan et al., 2021).
METHODOLOGY
The pilot evaluation consisted of three data collection efforts. Two online surveys were conducted–one when participants signed up for the pilot (T1 Survey) and another toward the end of the pilot (T2 Survey). Researchers also conducted interviews with participants during the pilot. The surveys aimed to capture travel behavior and experiences before and during the pilot, respectively. The T2 Survey also asked participants to assess their experiences with the pilot. The interviews focused on in-depth descriptions and expla- nations of how participants utilized micromobility services, usability topics, and program impacts. This paper focuses on analysis of T2 Survey and inte- rview data regarding user experience. T1 Survey data are used to describe the participants and baseline travel behavior.
Dream Center staff provided a T1 Survey link to participants at the time of enrollment, inviting them to complete the survey on a computer at the center. Survey participants received a $10 fast food gift card. The final, clea- ned data set included 80 participants. The T2 Survey was more challenging to administer. Dream Center staff called and/or texted participants several times in December 2022–January 2023 to invite them and provide the link. Participants received a $50 Walmart e-gift card. The final, cleaned data set included 14 participants.
Interviews were semi-structured and conducted via videoconference with nine participants between September and December 2022. Dream Center staff recruited participants when they visited the center, signing them up for an interview time and providing rides to the center to join the interview from a computer there. A $20 fast food gift card was provided. Researchers used an iterative process to create a code book for analyzing the interview tran- scripts, which were generated by Zoom and manually cleaned. A team of
Use and Usability of Shared Micromobility Among Underserved Youth in California 481
three researchers coded the transcripts (two independently coded each) and an interrater reliability was calculated to make sure a kappa agreement of above .75 was met. The team also met to discuss and reconcile any coding discrepancies.
Program Participants Based on T1 Survey data, participants’ average age was 21 (SD = 2; Min = 18, Max = 27), including 47 identifying as male, 29 as female, 3 non- binary, and 1 transgender. Forty-three percent identified as Black or African American, 39% White, and 6% American Indian. One-third identified as Hispanic/Latino.
Median household income was less than $10,000, reported by 56% of respondents; 25% declined to answer, 14% said $10-24,999, and 4% said $25-39,999. None had a college degree yet, but 30% had some college; 53% had a high school diploma or equivalent, and 16% had less than a high school education. Just over half (53%) reported they were currently unem- ployed; 20% and 15% were employed part time and full time, respectively. Eighteen percent were students, including 13% full time and 5% part time. Nearly half (46%) were neither working nor in school, meeting the definition of disconnected youth.
Participants’ most frequently used modes prior to the program were wal- king and car—typically ridehailing (Uber or Lyft), or getting a ride from someone they know. Seventy-one percent of pilot participants reported having zero cars owned or leased by households. Indicative of transporta- tion poverty (Lucas et al., 2016), participants typically disagreed with each of the following statements: I can afford the transportation options I want to use; It’s easy to get to places I need to go; I can get places quickly; I feel safe when traveling; The transportation I use is pleasant. Further, 69% of those who found each of the questions applicable said that transportation problems had caused them to miss work or school in the past six months. Also of particular relevance to this age group, 53% and 50% said it was hard or very hard to find transportation to visit family or friends and get to hobbies, sports, or other recreational activities, respectively.
RESULTS & DISCUSSION The following sections discuss the experiences of the 9 interviewees and the 14 T2 Survey participants, as well as some analysis of a subset of 12 who completed both surveys (3 participated in both surveys and an interview). Most of these participants were enrolled while e-scooters were still available, so they experienced both e-scooters and e-bikes. The small sample sizes are this study’s main limitation. Many of the youth are infrequent or sporadic in their visits to the Dream Center and the population’s general lack of stable housing and employment circumstances make it difficult for staff to contact them and inhibit their ability to focus on participating in research. Another limitation is that the data presented herein were part of a broader evaluation
of multiple UBM-inspired pilot programs that was not predominantly focu- sed on user experience. Future research should delve more deeply into the issues highlighted in this paper.
Use Cases Participants’ most common travel destinations during the pilot were (in order): Hobbies, sports, and recreation; Visiting family or friends; Work, Grocery store; and School or college. The majority of participants who repor- ted making each trip type reported using Spin for that trip type. Moreover, there was no mode that more participants reported using for each trip type. The use of micromobility for recreation and leisure is in line with prior fin- dings (McNeil et al., 2017; Tan et al., 2021), and the high rates of use for other trip types demonstrates the versatility of these services for this particu- lar population. Bus use and walking remained relatively prevalent for most trip types, whereas fewer participants reported using ridehailing and getting a ride from someone else while they had free access to Spin vehicles, although the small sample sizes precluded statistical tests to determine significance. Participants used the services to travel directly to destinations and for multi- modal trips, e.g., last-mile connection with the bus, although sometimes the other trip leg was finding a ride to locate an e-bike.
Interviewees described the benefits of these various use cases, including recreation and social life, and highlighted mobility barriers that the pilot addressed, such as lack of access and affordable options, in line with prior fin- dings (McNeil et al., 2017; Tan et al., 2021). One shared, “I go to the park and play basketball every Tuesday now. I couldn’t before because I didn’t didn’t really have a way to get over there.” Another explained, “Instead of worrying about [things] like ‘oh I only have this much money to get there, I’d rather use it to get to work,’ [now] I see relatives more instead of just worrying about how much money I would have and how that impacts me going to work.”
Interviewees spoke about using the services to travel to work, job inte- rviews, or school and how micromobility compared favorably to their other options. With regard to school, one participant described, “Mostly I was using them [e-bikes] for school as well because you know if I have to go to class, I got to go to class real quick. So I would just get on the e-bike and just head on to class with it.” With regard to work, another participant noted, “It [the e-bike] made work a little bit better, because I had something to rely on. I didn’t have to worry about either calling a ride or anything. I would just be like, okay, I have Wi-fi, I have internet, I have my e-bike account… Actually, I was able to pick up more shifts.”
In addition, more than one participant described that using e-bikes rather than walking allowed them to feel more comfortable and confident in their appearance upon arrival to school and work, something Tuncer and Brown (2020) also noted as a benefit. One participant explained, “[Before the e-bikes] I was pretty late [to work] sometimes. Sometimes the lights would take forever, and you know, especially if I have stuff, or if I have a backpack on, I would have to run, and I would have to get sweaty... It just feels nasty,
Use and Usability of Shared Micromobility Among Underserved Youth in California 483
and I have to work like this, and customers are just looking at me crazy like, ‘Why is this man sweaty?”’
In line with Borade et al.’s (2020), findings that e-bikes and scooters help to fill “temporal service gaps,” several participants who worked graveyard shifts and needed to travel home during the late night and early morning hours depended on the micromobility vehicles and explained that prior to the program they were often stranded. One such participant explained, “Usually my work– I work til’ twelve or one o’clock, so I’m there probably all day til’ morning, and then I have no transportation to take me back home.” In some cases walking was the only available option, which would take exces- sive amounts of time and expose them to danger, e.g., one youth described, “I work in security… I’m working in areas that are very dangerous, and prone to be very violent.”
Regarding grocery shopping and other errands, some users find micromo- bility vehicles limited in terms of cargo capacity (McNeil et al., 2017), but these participants found they met most of their needs. One described, “[The e-scooters helped me] get groceries faster and home faster.” Another explai- ned, “[The e-bikes] made getting food easier. I have that basket, so I don’t have to worry about getting [only] a little bit of groceries because I can’t carry them all.”
User Experience Similar to other studies (Tuncer and Brown, 2020; Pan and Shaheen, 2021; Mohammadian et al., 2022), users were often effusive about the pleasant experience of micromobility relative to other modes. One participant stated, “[Riding the e-bike] was so fun, that’s all I wanted to do.” Another described, “My first time riding, it was pretty fun. I was laughing… It’s just a more fun experience, you get to see more nature. You get to be more enthusiastic, and it’s a lot of good exercise, and it kind of takes the mind off bad thoughts.”
As was the case in other studies of micromobility (Pan and Shaheen, 2021; Tan et al., 2021), most Bakersfield users found that the e-scooters and e-bikes saved them a significant amount of travel time compared with walking or taking the bus. One reason for this was that micromobility modes were not subject to the same kinds of slow-downs that traditional public transit is subject to including delays, service gaps, or even just making frequent stops for passenger loading and unloading. One participant explained, “[E-bikes] helped us get from across town to [my daughter’s] school. Normally if we take the bus, it takes one to two hours. On the bikes, it takes us like twenty minutes.” Another shared, “I’m able to go way faster. I’m usually able to get anywhere within fifteen minutes.”
Some users were able to save time by taking more direct routes (e.g., door to door instead of bus stop to bus stop). One participant shared that they were able to travel more efficiently because of the e-bikes, stating that “Normally, we have to go up to the college, which is completely out of the direction that we’re going to catch another bus to go downtown. And now, with the bikes, we kind of just go down a street, turn a corner and go down ano- ther street, go all the way to downtown, so on the bikes like I said, it takes
like, maybe today here, it takes like maybe fifteen, twenty minutes.” A few shared that they were able to avoid higher traffic areas on the e-bikes and e-scooters. Echoing Tuncer and Brown’s (2020) findings regarding users abi- lity to “hack the city,” one participant mentioned being able to save time with shortcuts that were possible on micromobility vehicles, saying “Some- times I’ll take alleyways… It’s faster. It gets me there more on time to my destination [rather] than just walking. If I get on the e-bike it’ll take half of the time.” Further, the user reflected on how this time saving strategy was unique to micromobility because cars cannot use alleyways, and the alle- yways served little benefit when walking because taking these shortcuts at walking pace was equivalent to the travel time of a longer route in a car or bus.
The overall convenience and reliability associated with the on-demand nature of micromobility services was also described as a time-saver, consistent with past research (Wang et al., 2021; McNeil et al., 2017; Mohammadian et al., 2022). Participants could pick up an e-scooter or e-bike when run- ning late or if another option fell through, e.g., “Sometimes I’ll wake up late or something, and then just have the Spin bike, it’s easier to make up time. When you miss the bus you have to wait another thirty minutes.” Some participants noted the greater reliability of micromobility compared to public transit and even ridehailing (one explained how their late-night rides home from work were often canceled). Social disruptions were also cited as contributing to lack of bus reliability, e.g., “I have to keep waiting on the bus just to come because somebody’s going off, or if I get on the bus, someone’s already going crazy, or they won’t get off the bus… I don’t have to rely on that [those modes] now. I could just get on the bike and just go.”
The flexibility of micromobility services afforded participants greater con- trol over how they spent their time. They described feeling more independent, not having to rely on others for rides, in line with the findings of Tan et al. (2021). One participant reflected, “Usually it was just me walking or just asking for a ride. But if you constantly ask for a ride, people say, ‘You always ask me for a ride’, and some people get mad. So most of the time I’d just walk to the store.”
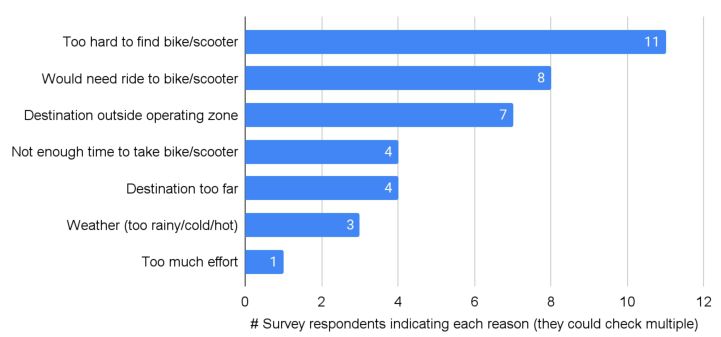
Usability Challenges Vehicle density/availability and operating zones were the main reasons parti- cipants opted to use a car or bus during the pilot rather than micromobility (Figure 1), barriers also found in other studies (Fishman, 2016; McNeil et al., 2017). Some parts of the main city as well as suburbs where many partici- pants lived were outside Spin’s operating zone. In some cases it would be inefficient for them to add another trip leg, e.g., walking or bussing to find a shared micromobility vehicle to complete their trip. As one participant descri- bed, “Since I have moved from downtown Bakersfield, which is the only place where I could really find Spin anything, I’ve been having to walk and walk and walk, and it’s extremely hot here…” He also expressed confusion about why his residence was outside the operating zone: “I currently live by a major
Use and Usability of Shared Micromobility Among Underserved Youth in California 485
Figure 1: Reasons participants traveled by car or bus during the pilot, per T2 survey data (N = 14).
high school and California State University Bakersfield is not too far. It’s like a major city point.”
Though vandalism is a recognized problem for dockless micromobility services (Fishman, 2016; Gössling, 2020; Tuncer and Brown, 2020), Spin experienced unprecedented high rates of vandalism to their e-bikes in Baker- sfield. Bikes were being damaged and stolen at such high rates that the fleet size shrunk significantly about 10 months into the program. Maintenance and other service elements could not keep up with the situation. As a result, pilot participants experienced a variety of problems. Several interviewees reported that upon arriving at a location where the app showed an avai- lable bike, the vehicle had either been vandalized (required maintenance to be rideable) or was not actually there at all, e.g., “The app will tell you where there’s an available bike or scooter, but it could be a ghost bike or scooter, because [people] dismantled and ruined them.” Another interviewee noted, “I can’t find bikes anymore, and the last time I did, I found one pedal missing… so then I had to run and use my skateboard.” The diminishing availability and equipment failures of the e-bikes were perplexing and disruptive to par- ticipants. One summarized, “When they work, it makes it much easier to get around and get around quickly. But when they don’t work, I either have to walk or just hunt down a different bike, which now, with the sparsity of the bikes, makes it much more difficult to get around.”
Sometimes when users did locate intact bikes, there were latent equipment issues that caused problems during their ride. One user recalled an e-bike shutting off without warning: “[The bikes] have bars where it shows the battery percentage– and the battery was on its second bar… and I’m like, probably 5 min or a mile away from my destination, and it just completely shut off, even though it still had bars.” Another recounted a failure of the bike brakes: “I almost got hit by a car. I kept squeezing the brakes and it wouldn’t stop.” Though not all equipment failures were dangerous, they caused anxi- ety, e.g., “At least with the bus they notify you when something’s going on.
But with the bikes it’s like Russian roulette. You never know what’s going to happen.”
The T2 Survey sought to quantify the prevalence of these issues that sur- faced during the interviews. Confusion about operating zones and a bike dying during a ride were each experienced by half or more respondents. Just over one-third experienced each: confusion about where to park and bikes failing to lock. Most respondents indicated that more vehicles (10 out of 14 respondents), expanded operating zones (11), and docking stations (9) would improve the program.
In contrast to other studies that found low helmet use with micromobi- lity (Shaheen and Cohen, 2019; Pan and Shaheen, 2021; Wang et al., 2021), most pilot participants reported that they always wore a helmet. Interview participants described having been instructed to wear helmets and not ride on sidewalks by both Spin and the Dream Center upon signing up for the program. One participant described feeling more pressure to wear a helmet when riding the e-scooters: “I’ve noticed that not very many people pay atten- tion to bikes, but with the scooters [lots of people say], ‘Oh, you should be wearing a helmet.’ So I wear a helmet when I use scooters but I don’t really wear it on bikes.”
Very few participants reported that they always rode e-bikes and/or e-scooters in the street; most alternated between the street and sidewalks. Echoing findings from other studies (McNeil et al., 2017; Shaheen and Cohen, 2019; Jiao and Bai, 2020; Pan and Shaheen, 2021), the most com- monly reported reason for this was a lack of bike lanes or unsafe bike lanes, e.g., “There aren’t many bike lanes so I have to ride on the sidewalk, and I always make sure there’s no pedestrians on the sidewalk before I ride on there.” In addition to traffic safety, crime was a factor in some participants’ chosen routes and paths, “There’s a lot less traffic in the back streets, [it’s] safer from cars. But, not safe from other people.”
Other user behavior issues related to safety included using e-bikes while under the influence of alcohol. One interview participant described, “I’ve gone to the club a couple of times, and I took it [e-bike] so I don’t have to worry about having, like a drunk driver. I mean having a designated driver, I mean. I don’t know a lot of people, so it helps to have a Spin bike. Before that I just honestly, I really just walked. Because, yeah, it’s easier just to walk because when you’re like, drunk or whatever, you get on the bus, it’s like, they’re gonna kick you out.”
Participants found the e-bike basket sufficiently sized for most of their cargo needs, but several reported a design flaw, e.g: “The basket [spacing] is too wide, stuff will easily fall out… You have to try to readjust it as you ride, and sometimes stuff starts falling out. I wish more bars were added to the corners, or a liner for the corner, specifically, because those are where the biggest holes are.”
Two interviewees (a couple) described picking up their child from pre- school, placing her in the e-bike basket, and riding on the sidewalk. They assumed it was an improper use, but noted that the child did not exceed the weight limit printed on the basket. The T2 Survey sought to quan- tify the prevalence of some of these experiences with e-bike features. Most
Use and Usability of Shared Micromobility Among Underserved Youth in California 487
(10 of 14) indicated they would like a larger basket, half wanted a more secure basket, and 5 wanted a child trailer”.
CONCLUSION
This study highlighted the experiences of disconnected and at-risk young adults using shared micromobility in a free-fare program in Bakersfield, California. More participants reported using micromobility compared to any other mode for each common trip purpose (hobbies, work, groceries, and socializing). Participants hailed the convenience, enjoyment, and time-saving benefits of micromobility, and reported increased independence and control over their schedules and whereabouts. Usability challenges included insuffici- ent operating zone coverage across the city and suburbs, vehicle performance and reliability (due to vandalism), education about proper use, traffic safety, and e-bike basket design. Despite challenges, pilot participants benefited gre- atly from the program. The pilot demonstrated that free-fare micromobility programs can provide an extremely valuable and surprisingly versatile solu- tion for disconnected and at-risk youth in a community underserved by public transportation.
ACKNOWLEDGMENT
The authors thank Leslie Nelson, Ashley DePew, and Shuxin Mao for their contributions to the research. This study was made possible through funding received by the University of California Institute of Transportation Studies from the State of California through the Public Transportation Account and the Road Repair and Accountability Act of 2017 (Senate Bill 1) and from Spin.
REFERENCES
Bai, S. and Jiao, J. (2020). Dockless E-scooter usage patterns and urban built Environments: A comparison study of Austin, TX, and Minneapolis, MN. Travel behaviour and society, 20, pp. 264–272. Borade, S., Cohen, K., Davis, C. and Stockman, J. (2020). Sustainable Mobility in
the United States. Caspi, O., Smart, M. J. and Noland, R. B. (2020). Spatial associations of dockless shared e-scooter usage. Transportation Research Part D: Transport and Environment, 86, p. 102396. Fishman, E. (2016). Bikeshare: A review of recent literature. Transport Reviews,
36(1), pp. 92–113. Gössling, S. (2020). Integrating e-scooters in urban transportation: Problems, policies, and the prospect of system change. Transportation Research Part D: Transport and Environment, 79, p. 102230. Jiao, J. and Bai, S. (2020). Understanding the shared e-scooter travels in Austin, TX.
ISPRS International Journal of Geo-Information, 9(2), p. 135. Kelly, M. J., Dunstan, F. D., Lloyd, K. and Fone, D. L. (2008). Evaluating cutpoints for the MHI-5 and MCS using the GHQ-12: a comparison of five different methods. BMC psychiatry, 8(1), pp. 1–9.
Lewis, K., 2022. A disrupted year: how the arrival of covid-19 affected youth disconnection. Measure of America: Youth Disconnection Series.wang. Lucas, K., Mattioli, G., Verlinghieri, E. and Guzman, A. (2016). December. Transport
poverty and its adverse social consequences. In Proceedings of the institution of civil engineers-transport (Vol. 169, No. 6, pp. 353–365). Thomas Telford Ltd. McNeil, N., Dill, J., MacArthur, J., Broach, J., and Howland, S. (2017). Breaking Barriers to Bike Share: Insights from Residents of Traditionally Underserved Neighborhoods. NITC-RR-884b. Portland, OR: Transportation Research and Education Center (TREC), https://doi.org/10.15760/trec.176. Mohammadian, A., Rahimi, E., Javadinasr, M., Shamshiripour, A., Davatgari,
A., Allahyari, A. and Brown, T. (2022). Analyzing the Impacts of a Successful Diffusion of Shared E-Scooters and Other Micromobility Devices and Efficient Management Strategies for Successful Operations in Illinois. FHWA-ICT-22-006. Mooney, S. J., Hosford, K., Howe, B., Yan, A., Winters, M., Bassok, A., and Hirsch, J. A. (2019). Freedom from the station: Spatial equity in access to dockless bike share. Journal of transport geography, 74, 91–96. Pan, A. and Shaheen, S. (2021). Strategies to Overcome Transportation Barriers for
Rent Burdened Oakland Residents. Rodier, C., Tovar, A. J., Harold, B. S., Fuller, S., and D’Agostino, M. n.d. A Survey of Universal Basic Mobility Wallet Programs in the U. S. [Manuscript in preparation]. Shaheen, S. and Cohen, A. (2019). Shared micromobility policy toolkit: Docked and
dockless bike and scooter sharing. Smith, C. S. and Schwieterman, J. P. (2018). E-scooter scenarios: evaluating the potential mobility benefits of shared dockless scooters in Chicago. Tan, H., McNeil, N., MacArthur, J. and Rodgers, K., 2021. Evaluation of a Tran-
sportation Incentive Program for Affordable Housing Residents. Transportation Research Record, 2675(8), pp. 240–253. U. S. Census Bureau (2022). Retrieved from: https://www.census.gov/quickfacts/fact /table/bakersfieldcitycalifornia/AGE295221https://www.census.gov/quickfacts/ fact/table/bakersfieldcitycalifornia/AGE295221. Wang, K., Qian, X., Fitch, D. T., Lee, Y., Malik, J. and Circella, G. (2021). What
travel modes do shared e-scooters displace? A review of recent research findings. Transport Reviews, 43(1), pp. 5–31.
LISTED IN THE AHFE DIGITAL BOOKSTORE CATALOGUE
Explore the complete digital volume
Human Factors in Transportation
Read this individual research paper free through the original publisher, or explore the full digital proceedings book.
ISBN 978-1-958651-71-1
Explore this ISBN in the AHFE Bookstore ↗Listed in the July 2026 bookstore catalogue; search by ISBN to confirm current availability · Digital book purchase optional