Waldemar Titov, Carl Gerlach, Thomas Schlegel (2023). Information Provision on Interactive Smart Public Displays in Public Transport in Events of Disruptions. In: Human Factors in Transportation. AHFE Open Access, vol. 95, pp. 315–325. https://doi.org/10.54941/ahfe1003816
1 Institute for Intelligent Interactive Ubiquitous System (IIUS), Hochschule Furtwangen University, Robert-Gerwig-Platz 1, Furtwangen im Schwarzwald, Germany ↗
2 Institute of Ubiquitous Mobility Systems (IUMS), Karlsruhe University of Applied Sciences, Moltkestrasse 30, Karlsruhe, Germany ↗
The communication of information is an important component of public transport. New designs for interactive displays integrated into public transport vehicles, called SmartWindow1, are being developed and implemented. In this paper, we conduct a laboratory user study evaluating the information communication in cases of disruptions. The user study focuses the kind of information and the timing of the information being displayed as well as determines what improvements in the disruption communication can be made. The two scenarios selected for the user study are based in real live scenarios from the local public transport network of Karlsruhe, Germany. The user study is being conducted in combination with a study on notifications on smartphones, resulting in three test groups. Similar to a prior proven approach group A tests only the notifications on the smartphone, group B tests only those on the SmartWindow and group C tests both media outputs.
How are passenger information and information on disruptions in local public transport trains currently communicated and how can they be impro- ved. This is an important question for public transport agencies around the globe. The aim of this work is to develop a possible design for displays in the train, which communicate the most important information about the jour- ney to the passenger in a comprehensible way, both in regular operation and in the event of a disruption. The most important information usually inclu- des the line number, the destination of the train, the next stations and the interchanges at each stop. In the event of a disruption, the most important information relates to a short disruption info with a local indication and the affected lines as well as an overview of possible detours.
1SmartWindows are intelligent, transparent and interactive displays integrated into a public transport vehicle in our research project SmartMMI: https://smartmmi.de/project/
CURRENT STATUS AND RELATED WORK Public transport is an important part of many people’s mobility. Usable pas- senger information systems and public transport systems in general are a core interest of public transport providers. Camacho et al. for example, argue for passenger-centric innovation and advocate continuous evaluation of passenger-related systems for future public transport (Camacho et al. 2016). Systems that are relevant for passengers in public transport are, among others, fare systems, seat booking systems and passenger information systems that inform about schedules, but also about incidents, delays and other real- time information. User studies can give valuable insight into usability and user experience of public transport systems. Habermann et al. 2016 describe, for example, a usability study evaluating a mobile application for public tran- sport. De Amorim et al. 2018 performed a field test in Porto, Portugal, to evaluate a mobile ticketing application. Mayas et al. 2018 evaluating public displays for passenger information at stations, for example, describe another field study.
We argue that in public transport systems, usability and user experience is highly affected by the user’s situation and therefore, by their context. The examples above show, that public transport system is becoming ubiquitous, which also means that the usage context is gaining importance while evalua- ting and assessing these systems. The user’s experience of planning a trip using a smartphone application probably changes whether they use it at home, in a lab, or on the road, under time pressure to reach the next bus. To consider this context in user studies is complex. Field studies can provide the neces- sary context but are hard to control and very costly. We therefore propose an evaluation environment that replicates a compartment of a public transport vehicle and can be used to create a public transport experience in user studies. We will describe the challenges we address with our mockup, its development and some of its possibilities, including some exemplary studies we performed using it, in the following sections.
Most streetcars and light rail vehicles operated by the local public transport provider in Karlsruhe Germany already have displays in the form of a screen on the ceiling in the trains. In addition to the line number and destination, these displays show the upcoming station. In some cases, an overview of the next departures is displayed shortly before a station is reached. There are also streetcars that do not have a screen, but an LED bar. This shows either the line and destination or the next station. In some streetcars there are no screens or LED bars. In all trains, there are announcements about the next station and the information that it is possible to change to another direction. In the event of a disruption in the line network, there is an announcement from the control center about the location and expected duration of the disruption. In the case of short-term disruptions, the screens and LED strips continue to display the regular route; in the case of longer-term planned the modified route in the case of longer-term planned detour.
In the event of a disruption along the route, the displays continue to show the railroad’s regular route. The announcement from the control center pro- vides brief information, but is not permanently available to all passengers.
Information Provision on Interactive Smart Public Displays in Public Transport 317
In the event of a detour, passengers are dependent on finding out about the disruption and its alternatives elsewhere, for example via their smartphone. However, since not all passengers can obtain information by other means, for example because they do not have a smartphone, it is important that the displays on the train provide as much information as possible about alter- natives. However, currently in the investigated trams there are no current times displayed for the upcoming stations, consequently no real-time data on delays is provided.
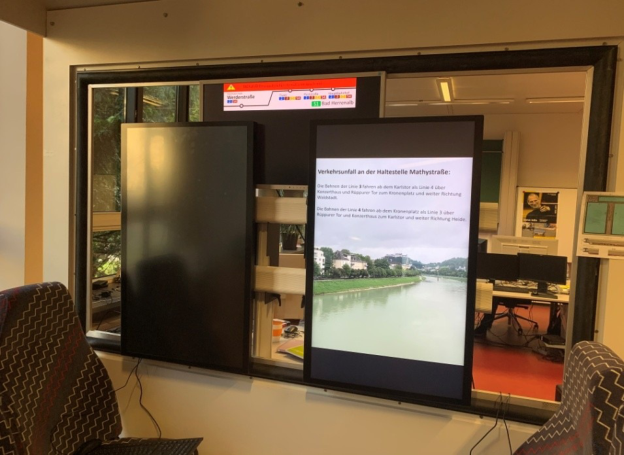
METHODOLOGY OF THE EVALUATION STUDY A laboratory study will be conducted to evaluate the new information displays. This keeps the study within a manageable scope and allows it to focus on the essentials of the study, namely the information flow of the incident reports. Another important point of the study is that the test per- sons test the respective scenarios individually one after the other, so that no group dynamics arise and everyone reacts individually to the new informa- tion. Figure 1 shows a section of the passenger cabin in which the study is conducted.
As a field study, it can only be carried out with a great deal of effort, since a real ride on the train takes place there instead of the simulated ride in the laboratory. Testing during operation is also not advantageous for the study, since it is not possible to control the detours and the displays must already be set up for all eventualities. However, the study is primarily concerned with testing the feasibility of the newly developed displays. Another point in favor of a laboratory study is that the SmartWindow, on which the new displays are being tested are present on a prototype that can be found in the laboratory.
Figure 1: Laboratory passenger cabin with interactive displays [5].
STUDY PROCEDURE The twelve subjects are divided into three groups of four. The participants in each group play through both scenarios in turn, with each subject always sit- ting individually in the passenger cabin, prior introduced in Keller et al. 2020 and playing through the scenario. To prevent learning effects from distorting the results, half of the subjects in each group are given scenario 1 first and the other half are given scenario 2 first. The number of participants in the study is twelve. Subjects are assigned a personal ID. The division is chrono- logical by time of appearance, meaning the first subject is given ID A1, and the twelfth subject is given ID C4. One hour is allocated for each test person, so that there is sufficient time buffer to avoid overlaps to avoid overlaps. The participants of group A each receive a smartphone as an information tool, on which the journey information as well as the disruption messages are displayed. The scheduled route of the train is displayed on the SmartW- indow during the entire run. The results from the test runs of this group are not relevant for this work, which is about the information displays on the SmartWindow.
For the subjects in the second test group (Group B), a malfunction is displayed on the SmartWindow during the simulated trip as described in the scenarios. In the runs of the third group (group C), the malfunction messages are then displayed on both the smartphone and the SmartWindow. The respe- ctive information about the disturbance and about reaching the destination should appear synchronously on both devices. Thus, it can be determined which of the two media is most likely to be responded to. The study design was based on a similar user study determining what output public transport passenger prefer conducted by Titov et al. 2020.
Prior to the study, the subjects are asked a few general questions about their experiences with public transportation. These include the frequency of use, the purpose of use, as well as knowledge of the local route network in Karlsruhe and the most frequently used means of obtaining information. Before running through a scenario, the respondent is given a brief informa- tion about where they are currently located and which line user’s wants to use to get to a certain predefined station. Finally, there is again a question- naire that asks specific questions about the information means smartphone and SmartWindow, depending on which of the two media is used in the study. Here, questions are asked about how helpful the individual pieces of infor- mation given are and whether there are any comments or suggestions for improvement. In addition, the local knowledge in the area of the respective scenario is queried so that possible tendencies can be filtered out during the evaluation.
INFORMATIONAL DISPLAYS The purpose of the informational bar at the top of the SmartWindow is to provide the passenger with the most important information about the jour- ney. In Keller et al. 2019 we presented the iterative evaluation approach for a smart public display prototype in public transport. This includes the line and destination of the train, in which the information points provide information
Information Provision on Interactive Smart Public Displays in Public Transport 319
about the current location of the passenger, the other stations along the route, and the possibilities for changing trains at these stations. This information is the most important information that the passenger needs during the journey.
In case of a disruption along the route, the detour route is not displayed due to the very limited space, but only the passenger is informed which stations along the regular route are unscheduled not served. In addition to crossing out some of the stations names, a message pops up informing the passenger that a disruption has occurred along side with further information. This additional information is displayed on the large screen below the info bar. As shown in figure 2 and 3, in this case lines 2 and S1 are still running to the station called Entenfang in addition to lines 5, 6 and S5. This is a direct consequence of the detour, but is not further emphasized here, since these lines are again specifically pointed out on the large display below.
Figure 2: Information bar in normal state.
Figure available in the original PDF paper.
Figure 3: Information bar in case of a disruption.
Figure available in the original PDF paper.
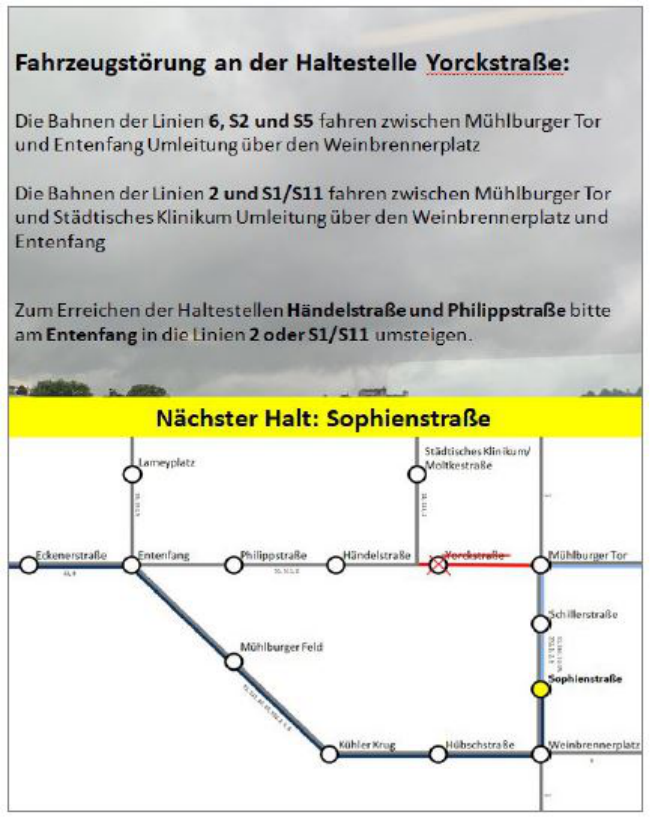
On the large screen shown in figure 4 at eye level of the passengers, the other important information is displayed. At the top of the screen is general information about the current incident. By linking to the lettering in the upper bar, the next station is also displayed on the lower screen. The reason for this is that the info bar does not show the new route in case of detours. For better orientation and as information about the detour, a schematic map with the highlighted route is also displayed. The last information on the screen shows where to get off or change trains to reach the omitted stations. The display of a footpath as an alternative is deliberately omitted, as it is particularly dif- ficult for people who are not familiar with the area to remember it, and after getting off the bus, they no longer receive this information and have to find their way around themselves. In the case of a personalized disruption mes- sage, for example on the smartphone, the footpath alternative makes sense, as this is still with the passenger after alighting.
USER SCENARIOS Two scenarios were designed so that in the study the respective test subjects are to travel from one station in the network to another. The destination station and line are communicated verbally beforehand. This allows the test subject to focus on the displays on the train and the smartphone, respectively.
Figure 4: Information bar in case of a disruption.
The displays on the SmartWindow, unlike the smartphone app notifications, do not specifically show the passenger’s destination in the study, but generally cover all destinations to be reached along the line. If a subject forgot or got confuses with the destination, they were reminded verbally, however this case never occurred.
In the first scenario, a passenger wants to take a line 4 train from the Europaplatz/Postgalerie station to the main train station to board a conne- cting long distance train bound for Basel. When boarding, the SmartWindow already shows that there was a disruption at the station Mathystrasse, with further information to follow. At the station Karlstor, the SmartWindow indicates the detour meaning that the train is detoured in the direction of Waldstadt via the stations Konzerthaus and Rüppurer Tor. The stations
Information Provision on Interactive Smart Public Displays in Public Transport 321
Mathystrasse, Kolpingsplatz, Ebertstrasse, Hauptbahnhof, Poststrasse and Tivoli will not be served. For these stations, the possible new routes with the respective changes are displayed on the SmartWindow. This scenario was chosen so that the subjects could decide during the study whether they wan- ted to travel to the main station by changing at the station Rüppurer Tor or whether they wanted to walk from station Konzerthaus.
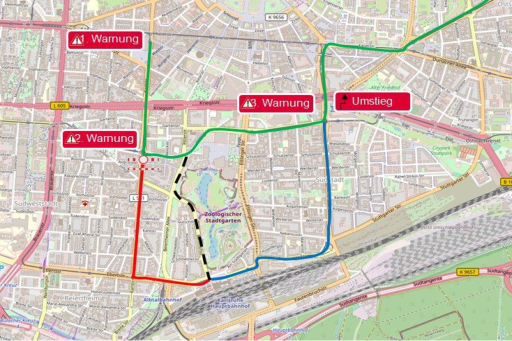
Figure 5 shows in green the route of the streetcar of line 4 from Euro- paplatz. The part of the route that the passenger cannot take as originally planned is shown in red. The blue line represents the route of the lines S1/S11 between Rüppurer Tor and the main station, which is one of the possibilities for the passenger to reach his destination. Between the stations Konzerthaus and Hauptbahnhof the possible footpath is drawn in black, which is usually faster than the detour with change at Rüppurer Tor. This scenario is mainly intended to answer the question of whether a walk or a transfer to another train is more likely to be chosen in order to reach the destination. For the test persons, the aspect that they are under time pressure plays a role, since an ICE train is to be reached at the main station.
The second scenario a user wants to take the S2 line from Europaplatz to Händelstrasse. During the journey, a disruption occurs between the stations Mühlburger Tor and Yorckstrasse. Before reaching the station Mühlburger Tor, the smart window in the train displays the disruption information as well as the route changed by the detour. At the station Sophienstrasse, the alternatives for reaching the Philippstrasse, Händelstrasse and Yorckstrasse stations are displayed. At the station, Kühler Krug it is pointed out that, the lines 2 and S1/S11 arrive at Entenfang at a different platform than the line S2. Therefore, a change at the station Mühlburger Tor is recommended to reach the stations Philippstrasse and Händelstrasse. This scenario was chosen to test whether the user notices the changes in the journey. For this purpose, it was important to keep the example as simple as possible, so that one can concentrate on the important information of the disruption.
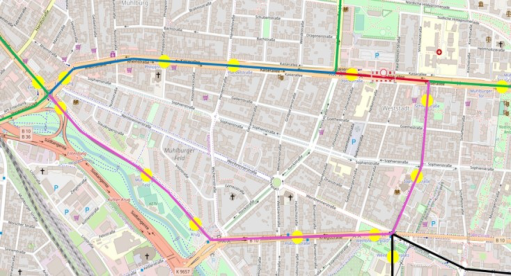
Figure 5: Visualization of scenario 1.Figure 6: Visualization of scenario 2.
Figure 6 shows in green the regular routes of the lines affected by the detour, namely lines 2, 6, S1, S11, S2, S5 and S51. At the station Yorckstrasse, the closed section of the route is shown in red, the detour route affecting all lines is shown in pink, and the detour route for only the trains of lines 2, S1 and S11 is shown in blue. The aim here is to answer the question of how the test subjects perceive the disruption message and deal with the fact that the detour route is considerably longer than the regular route.
The two scenarios are selected in such a way that the most meaningful results possible can be obtained in the study. Scenario 1 is written in such a way that it boils down to a decision for the test subjects between getting off earlier and walking or changing trains and arriving at the main station a little later. The convenience factor plays a very large role. There is also a certain recognition effect, since some of the test person’s travel the route almost every day and thus it is also tested how they react to the disruptions there. Due to the detour that the train takes in the scenario, a change of trains is required to get to the main station. This puts the test person under time pressure because the user wants to catch a connecting long distance train at the main station. In contrast, in scenario 2, there is no time pressure for the subject to concentrate on the new information and not make the decision under time pressure. Since the detour route in this case is much longer than the regular route, a walking route is also an option, even though it is not explicitly offered as an alternative, in contrast to scenario 1.
RESULTS
Since four subjects received their information via the smartphone, four via the SmartWindow and four via both media, those who only had the smart- phone available are not considered further in the evaluation. This results in a total number of eight test subjects. After running through both scenarios, two subjects indicated very good route knowledge for scenario 1, five indicated good route knowledge, and one indicated poor route knowledge. For sce- nario 2, three subjects possessed very good route knowledge, four possessed good route knowledge, and one possessed poor route knowledge. Six of the subjects found the display of the route line as shown in figure 2 and 3 to be
Information Provision on Interactive Smart Public Displays in Public Transport 323
helpful, one subject did not find it helpful, and another subject did not notice it. All eight subjects considered the reroute map displayed on the SmartWin- dow, shown in figure 4, helpful. The red-highlighted notice about the detour, here an example from scenario 2, was considered helpful five times and very helpful three times.
Different insights were gained through different behaviors of the individual subjects. The most missed item on the displays was the lack of a footpath alternative, specifically in scenario 2. In just this scenario, there were two people familiar with the location who preferred the footpath from the station Schillerstrasse, even though it was not displayed as an alternative. Another person would have preferred the footpath due to the length of the detour. In scenario 1, half of the test subjects had a smartphone to help them, on which the footpath alternative is displayed. In this case, two subjects also chose the footpath based on the information provided by the smartphone, and another who did not have a smartphone available chose the footpath based on the very good knowledge of the location.
Overall, three of the eight subjects missed the travel time information in at least one of the two scenarios. Especially in scenario 2 with the relatively long detour, the indication of the travel time and the delay would have been beneficial for the three subjects. Further comments on the design and the way in which the information was conveyed related to the fact that the amount of information given was sufficient to get a good overview of the new situa- tion. The schematic map presentation provided a good overview for people who were not very familiar with the route network. This made the decision whether to walk or remain seated somewhat easier for the four test subje- cts without smartphones. However, the travel time should still be included in further designs and studies. One person additionally noted the lack of a loudspeaker announcement about the disruption.
CONCLUSION AND FUTURE WORK Thanks to the modern technology of the SmartWindow, information can reach the passenger much faster in the event of a disruption. The map display of the detour helps people who are not familiar with the area to find their way around the route network. They can also estimate the approxi- mate travel time of the train through the detour, although the travel times are not displayed at all. This is a disadvantage for both network-unknown and network-knowledgeable passengers, since the exact time component is missing. The suggestions for reaching the omitted stations are also advan- tageous for passengers who are not familiar with the area, since they get a better orientation for reaching their destinations. However, the description of the disruption in scenario 2 causes confusion, since a train of line 4 is diverted differently than actually described.
Summarizing we can state that the displays designed for the SmartWin- dow are a good start on which to build further. However, the study showed room for improvements. On the one hand, the travel times to the respective stations should be displayed in the future in order to give the passenger a better time orientation, especially in the case of a detour. This would make it
easier for passengers to decide whether a walk is worthwhile, especially if they are under time pressure, as in scenario 2. Regarding footpaths, displaying footpath alternatives would have make sense although hard to implement. As already mentioned in the description of the scenarios, the display of the SmartWindow is only in the train and the passenger would no longer have the possibility to view the footpath to the destination after getting off. At this point, a solution for the display of the footpath must be found inde- pendently of other aids such as the smartphone, so that passengers can also find their way around if they only use the SmartWindow as a source of information.
During the study, we noticed that all four participants who had a smartph- one in addition to the SmartWindow available for transmitting information concentrated mainly on the smartphone and paid only marginal attention to the displays of the SmartWindow. Since the information on both devices was congruent with each other, it did not matter in the study based on which information source the decision was ultimately made. It is important to note, however, that the tendency for all four subjects in Group C was toward the smartphone. When asked, the subjects in the other groups also mostly answe- red that they would have mainly used the smartphone if they had information from both sources.
Based on the conducted study, further investigation is needed, but for which a few adjustments should be made. In terms of content, adding the temporal component as - well as improving displays of alternatives such as walking play the biggest role to further improve the SmartWindow. For further implementations, it should also be noted that the scenarios become somewhat longer, so that the test subjects have a few stations to make before the detour route is traveled. In addition, the time sequence during the simu- lated trip must be adjusted so that the stations do not leave too quickly one after the other.
ACKNOWLEDGMENT
This work was conducted within the scope of the research project SmartMMI funded by the German Federal Ministry of Transport and Digital Infrastru- cture as part of the mFund initiative (Funding ID: 19F2042A). The authors wish to thank Fabian Boschert-Hennrich and all study participants for their valuable input.
REFERENCES
Amorim, D. M. D., Dias, T. G., & Ferreira, M. C. (2018, October). Usability evaluation of a public transport mobile ticketing solution. In International Conference on Human Systems Engineering and Design: Future Trends and Applications (pp. 345–351). Springer, Cham. Camacho, T., Foth, M., Rakotonirainy, A., Rittenbruch, M., & Bunker, J. (2016).
The role of passenger-centric innovation in the future of public transport. Public Transport, 8(3), 453–475.
Information Provision on Interactive Smart Public Displays in Public Transport 325
Habermann, A. L., Kasugai, K., & Ziefle, M. (2015, October). Mobile app for public transport: a usability and user experience perspective. In International Internet of Things Summit (pp. 168–174). Springer, Cham. Keller, C., Titov, W., Sawilla, S., & Schlegel, T. (2019). Evaluation of a smart public
display in public transport. Mensch und Computer 2019-Workshopband. Keller, C., Titov, W., Trefzger, M., Kuspiel, J., Gerst, N., & Schlegel, T. (2020, July). An evaluation environment for user studies in the public transport domain. In International Conference on Human-Computer Interaction (pp. 249–266). Springer, Cham. Mayas, C., Steinert, T., & Krömker, H. (2018, July). Interactive public displays
for paperless mobility stations. In International Conference on Human-Computer Interaction (pp. 542–551). Springer, Cham. Titov, W., Tran, H., Keller, C., & Schlegel, T. (2020, July). A Multi-device Evaluation Approach of Passenger Information Systems in Smart Public Transport. In Inter- national Conference on Human-Computer Interaction (pp. 340–358). Springer, Cham.
LISTED IN THE AHFE DIGITAL BOOKSTORE CATALOGUE
Explore the complete digital volume
Human Factors in Transportation
Read this individual research paper free through the original publisher, or explore the full digital proceedings book.
ISBN 978-1-958651-71-1
Explore this ISBN in the AHFE Bookstore ↗Listed in the July 2026 bookstore catalogue; search by ISBN to confirm current availability · Digital book purchase optional