Waldemar Titov, Thomas Schlegel (2026). Making Delays Glanceable: Color-Coded Status and Autogenerated Tickers for LED-Matrix Passenger Information Displays. In: Advances in Human Factors of Transportation. AHFE Open Access, vol. 224, pp. 223–233. https://doi.org/10.54941/ahfe1007849
Institute for Intelligent Interactive Ubiquitous System (IIIUS), Furtwangen University, Robert-Gerwig-Platz 1, 78120 Furtwangen im Schwarzwald, Germany ↗
Compared with departure monitors in other dynamic passenger information media, classic LED‑matrix displays at stops typically provide less information. This is largely due to their limited resolution and, in many legacy deployments, monochrome presentation. This paper describes selected extensions that can be implemented even within the constraints of LED‑matrix technology and examines them in more detail by means of an online survey. The extensions focus on (1) distinguishing between on‑time operation, delays, and missing real‑time data, and (2) automatically generating short information messages when a departure is no longer shown on the display because a delay has pushed it out of the fixed, chronologically sorted list of visible rows. Survey results indicate that both functionalities can be perceived as helpful and may increase users’ confidence in data quality. Additional information can reduce the need to consult apps on personal devices and can support decision‑making during irregular operations, potentially shortening perceived or actual travel times. In particular, automatic messages about ‘missing’ departures may reduce misunderstandings (e.g., confusing a delayed trip with a cancellation) and therefore appear especially relevant for legacy systems with a limited number of display lines.
LED-matrix displays are widely used as dynamic passenger information systems (DPIS) at stops in local public transport. Information on upcoming departures is presented line by line, and additional information is often provided as a scrolling ticker in the bottom row.
When compared with departure monitors in other dynamic information media, classic LED-matrix DPIS usually contain less information. This can be attributed to the frequent use of monochrome matrices. In screen-based applications, colors and detailed symbols can be used to highlight special conditions such as delays. A second major factor is the limited resolution of LED matrices, which constrains both text and symbol design.
224 Titov and Schlegel In practice, LED matrices have advantages such as good readability in daylight and robust outdoor suitability. Therefore, replacing LED technology entirely may not be an optimal solution. Instead, this project assumes that even with LED-matrix technology there are opportunities to extend the information content, provide more helpful information to passengers, and increase transparency about the current state of the network. The results are intended to inform future LED-matrix DPIS design and requirement specifications, and may also support upgrades of legacy systems.
Specifically, an online survey was conducted to examine whether selected novel information elements for LED-matrix DPIS are intuitively understood and how relevant and useful they are perceived by public-transport users. The novel elements are conveyed through additional use of colors, symbols, and/or text. Based on a preliminary comparison with other information media, multiple potential extensions were identified; due to the limited scope of a single survey, the study focuses on two selected aspects described in the following sections.
RELATED WORK
Only a limited number of studies and publications specifically address LED-matrix passenger information at stops, particularly with a focus on content design and information scope. Many publications address the general impact of stop-based real-time information on public-transport perception. Other work on dynamic passenger information tends to focus more on journey planners and mobile devices than on stop displays. Moreover, cultural and system differences to German public transport may affect transferability of findings. Selected relevant publications are summarized below.
Dziekan, 2004 and Dziekan and Vermeulen, 2006 investigated in a before-and-after study the effects of new real-time departure display at stops in the Netherlands. They note that many effects of DPIS are psychological: reducing uncertainty, increasing trust in the public-transport system, and improving image. Investigated factors included cognitive aspects (e.g., ease of using public transport) and affective aspects (e.g., safety and uncertainty), as well as placement and orientation of displays. The main finding was a reduction in perceived waiting time; long-term effects on safety, cognitive effort, or willingness to recommend public transport were not observed. Over time, participants looked at the displays more frequently and trust in data quality increased.
Viergutz, 2015 analyzed investigated in a master’s thesis the strategy for real-time passenger information for a transit operator describes different DPIS types and derives user needs through interviews and surveys. Relevant needs include passive provision (no active request), reliability, real-time data, current operational status, and cost-effectiveness. For display quality, clear presentation, easily understandable information, consistency, and an appropriate amount of data are emphasized. The work also discusses which functions are considered important by passengers on stop displays and in apps, and provides recommendations for DPIS implementation, including the importance of keeping disruption information current.
Making Delays Glanceable: Color-Coded Passenger Information Displays 225 Harmony and Gayah, 2017 examined user needs during DPIS implementation using an online survey (primarily USA). The most valued information concerned vehicle positions. The study also identified gaps in information availability across media, such as crowding information to be displayed both in apps and on displays, planned deviations to be shown more frequently on displays, and short-term disruptions not being sufficiently available in smartphone apps. Proposed strategies include stronger passenger involvement in system design and better feedback channels between passengers and operators, for example regarding data quality and reliability.
In addition to the academic literature, requirements and recommendations in publications by the German Association of German Transport Companies (VDV) are relevant. VDV 735 specifies technical requirements and information presentation for collective dynamic passenger information, while VDV 720 provides broader guidance on information management during disruptions.
PROPOSED LED-MATRIX EXTENSIONS In the following, a proposed LED-matrix DPIS that incorporates several potential extensions is referred to as the enhanced system. It comprises multiple enhancements, although only a subset is examined in depth within the present survey.
Two core concepts underpin the enhanced system: the use of colors and the automatic generation of information texts. With colors, for example, line numbers can be shown in the official route color (if available) or by mode. The remaining time to departure (countdown) can be color-coded based on punctuality or delay data (selected for the survey). Symbols used in various parts of the display can be rendered more clearly and with meaningful gradations when colors are available. However, for accessibility, important information should not rely on color alone; text and shape should remain informative so that no essential meaning is lost if all colors were rendered identically.
Automatically generated ticker messages can be used to convey certain situations inferred from departure data using rule-based detection. Examples include informing users that there are currently no upcoming departures (to avoid an empty display), that no real-time data are currently being provided, or that a trip terminates earlier than planned. The survey focuses on a specific type of automatic message: notifying users about departures that are no longer visible on the display due to a delay altering the chronological order.
Countdown Color-Coding The study examines color-coding of the countdown element (scheduled time or minutes remaining to departure) based on real-time data. The system distinguishes between (a) the absence vs. presence of real-time data and (b) in the presence of real-time data, on-time operation vs. delays. Common practice in other information systems is to use green for on-time, grey tones for missing real-time data (here referred to as white due to RGB LED appearance), and red for deviations from the schedule. However, a purely red indication can
226 Titov and Schlegel be misinterpreted as a cancellation if no additional marker (e.g., explicit ‘cancelled’ text) is shown. Therefore, threshold values are proposed: nearly on-time departures remain green; above a first threshold, delays are shown in yellow; and only at larger delays should red be used.
To explore user preferences, several implementation variants are considered: a full variant (green/yellow/red/white), a variant with a single delay color (all delays in yellow), a variant without delay distinction (real-time present: green or standard text color; real-time missing: white), and a variant without any distinction (all in the standard color).
In many legacy systems, missing real-time data are expressed by showing the absolute clock time instead of a relative countdown. This practice is questionable: if the current time is not shown on or near the display, passengers must consult their own devices, and it is unclear whether the absolute time is intuitively understood as ‘no real-time data’. Moreover, absolute times are also used for other meanings (e.g., cancellations), and in some systems absolute times are shown simply when the departure is 10 minutes or more away-making it easy to confuse ordinary cases with missing real-time data. These issues motivate reconsidering how missing real-time data are communicated.
Importantly, the color-coding is not intended to change the semantic meaning of the time value itself. The countdown always represents the expected waiting time; the color is an additional cue that supports transparency and decision-making.
Message for Delays That Are Not Visible on the Display The second examined functionality concerns ticker messages shown when a departure is no longer visible on the display due to a delay, even though it would have been visible without the delay. This problem arises from the chronological sorting of departures combined with a fixed number of visible rows: when a departure is delayed and many other trips now depart earlier, the delayed trip can ‘slip off’ the screen.
Removing chronological sorting would prevent this, but could result in only delayed trips being shown, while the actually next departures disappear what is an undesirable outcome for stop displays with limited lines. Apps can keep non-chronological lists because users can scroll, but scrolling or alternating rows on a stop display may be confusing. A straightforward solution is to install displays with sufficiently many lines (e.g., at least as many as there are routes serving the stop). However, this is not feasible for legacy systems where replacement is not an option in the short term, or where network changes later create a shortage of lines.
In some systems, cancellations are effectively indicated by the departure disappearing from the display. In such contexts, a delayed trip that has slipped off the screen can be mistaken for a cancellation. To preserve information about these ‘missing’ delayed departures, the proposed approach automatically detects such situations from the data and outputs a short ticker message, for example: “S1 → Neureut Kirchfeld (19:28) today 5 min later”. The absolute time refers to the scheduled departure time. To highlight these messages, a clock icon can be used (optionally
Making Delays Glanceable: Color-Coded Passenger Information Displays 227 color-accented). The text avoids unnecessary phrases to keep it short and to avoid the impression that it was manually entered.
The algorithm considers the number of available rows (accounting for any existing ticker row), identifies the last displayed departure and its expected time, and then searches for departures that are expected to depart after this last displayed trip but were scheduled earlier. Additional control parameters such as a minimum delay threshold can be applied.
METHODOLOGY
An online survey was conducted with two main parts, countdown color-coding and delay-message functionality and a short final part on the general use of colors.
Within each part, questions build on one another and are presented using scenarios. At selected points the functionalities are explained so that all participants share the same information base for later relevance questions. For this reason, changing answers to previous pages was technically disabled.
Some items were intentionally designed like ‘test questions’ with distractor options and one intended ‘correct’ interpretation, because the study aims to capture participants’ perceptions and assumptions without prior explanation.
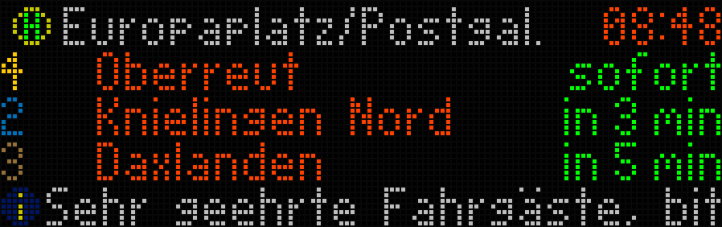
For the questions and scenarios, simulated images of RGB LED matrices were shown. The images were generated using an existing in-house departure-monitor software that was modified to manipulate departures, clock time, and ticker texts and to export screenshots. A 128 × 40 matrix was simulated throughout, including a header line with stop name and current time (not part of the investigated factors), followed by four departure lines (route number in official route color, destination text, and countdown). As shown in Figure 1 the bottom line could display one or more ticker messages with an icon. When a ticker text was relevant, it was also provided as plain text for accessibility.
Figure 1: Example illustration of an RGB LED-matrix passenger information display.
At the beginning of the questionnaire, participants were informed about the non-editable previous answers and the test-like questions. A first example image of an RGB LED-matrix DPIS was shown, and it was clarified that screen size and font size were kept constant and are not part of the study factors.
228 Titov and Schlegel Before the first content section, demographic data were collected (region, age group, gender, occupation) and information about participants’ public-transport context (usage frequency, most frequently used mode, departure frequency at their most used stop position). In addition, participants reported how often they use six information media (timetable book, printed stop timetable, website journey planner, operator app, external app such as Google Maps, and stop DPIS), from ‘never’ to ‘on every trip’.
For the countdown color-coding section, participants were first asked, before any explanation, what meaning they infer from each color (green, yellow, red, white), based on example screenshots. Colors were introduced in a fixed order so that participants would first see a situation with only green, reflecting the likely initial experience in real operation where most departures are on time. Subsequently, additional colors were shown together to support intuitive interpretation through contrast.
After this, the proposed color-coding concept was explained. Participants then indicated (independently of the screenshots) from how many minutes of delay a departure is perceived as no longer on time, and from how many minutes as no longer ‘slightly’ delayed. These responses can inform suitable software thresholds.
An evening scenario with a delay and possible alternatives was then presented, including a simplified network map (local knowledge of Karlsruhe was not required). Participants rated the likelihood of various actions (e.g., taking an earlier alternative line, checking a journey planner app, or waiting). Finally, they evaluated the concept via agreement statements and ranked five implementation variants.
For the delay-message section, participants were introduced to a scenario where a desired departure (route, destination, scheduled time) is not shown on the display even though later departures are visible. They selected the most likely reason for this. Then, the scenario was extended with multiple ticker messages (with icons), and participants selected which message was most relevant. After the concept was explained, participants evaluated it via agreement statements and rated the likelihood of behavioral responses both with and without the additional message. Further questions addressed a suitable minimum delay threshold for showing the message and whether similar messages should also be shown for visible delayed departures.
The survey ended with two subjective questions on color use: a semantic differential (e.g., ‘boring–interesting’, ‘unreliable–reliable’, ‘inaccurate–precise’) and a free-placement scale for deciding for which purposes additional colors should be used (e.g., punctuality/delay distinction, real-time data availability, route number coloring, more detailed message icons).
RESULTS
A total of 35 people completed the survey. Approximately 83% identified as male, about 77% were in the 19–24 age group, and about 77% were currently students. Around 43% reported using public transport daily or almost daily, about 29% on 1–3 days per week, and about 29% on 1–3 days per month or less.
Making Delays Glanceable: Color-Coded Passenger Information Displays 229 Regarding the primary mode used, 40% mainly used trams and 40% S-Bahn services, about 17% regional trains, and only one participant primarily used buses. For the most frequently used stop position, roughly 30% reported a 10-minute headway, another 30% reported service more frequent than every 10 minutes, and 40% reported less frequent service (mainly 20- or 30-minute headways).
On a five-level frequency scale from ‘never’ to ‘on every trip’, almost 50% reported using a website/journey planner on (almost) every trip, and 60% reported using an operator/association app on (almost) every trip. Traditional media were rarely used (no one used a timetable book regularly; printed stop timetables were used only occasionally). Stop DPIS stood out as the most routinely used medium: 77% used it on (almost) every trip (60% on every trip).
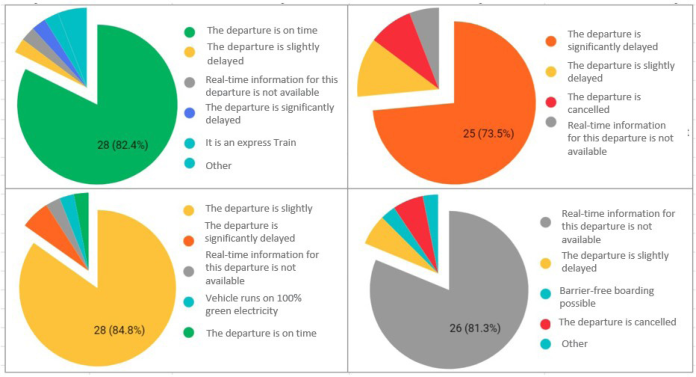
Countdown Color-Coding Without prior explanation, participants’ interpretations of the four colors were largely consistent with the intended meaning, as shown in Figure 2. For green (n = 34), about 82% inferred that the departure would be on time. For yellow (n = 33), about 85% inferred a slight delay; when both slight and larger delays are counted, 91% interpreted yellow as ‘delay’. Notably, for green and yellow no participant inferred a cancellation. For red (n = 34), 74% inferred a larger delay (85% for ‘delay’ overall), but three participants (9%) interpreted red as indicating a cancellation. For white (n = 32), 81% selected ‘no real-time information available for this departure’, while 6% interpreted it as a cancellation.
Figure 2: Assumptions about the meaning of countdown colors (green, yellow, red, white).
After the concept had been explained, participants indicated threshold values for perceived delay. For the transition from ‘on time’ to ‘(slightly) delayed’ (n = 34), responses ranged from 1 to 10 minutes (mean about 2.8 minutes; median 2.5 minutes). For the transition to ‘no longer slightly delayed’, responses ranged from 3 to 15 minutes (mean just under 7 minutes; median 5 minutes).
230 Titov and Schlegel In the evening scenario with a delay and possible alternatives, the most likely action on average was to consider an alternative line from the opposite side of the street (mean 2.8 on a 0–4 likelihood scale). The highest share of ‘very likely’ responses (41%) occurred for first checking a journey-planner app before boarding (mean 2.7). Taking the next available train to get closer to the destination and transferring later also scored highly (67% likely/very likely; mean 2.6). Leaving the stop area temporarily, continuing to wait without considering alternatives, or switching to a shared bike were rated as comparatively unlikely.
In the overall evaluation of the concept (n = 32), 82% agreed that highlighting delays is helpful, with 41% ‘strongly agreeing’. Sixty percent agreed that indicating missing real-time data is helpful. About half agreed that the color-coding would reduce their need to consult apps or printed timetables, and 69% agreed that it would make the information appear more reliable. Ratings regarding readability were overall neutral to slightly positive, and nearly 60% disagreed with the statement that the color-coding is unclear or confusing.
In the ranking of five implementation variants (n = 30), the full variant (green/yellow/red/white) achieved the best average rank (1.79) and was ranked first by 70% of participants, although almost one quarter placed it in ranks 4–5. A compromise variant with all delays highlighted in yellow was ranked second on average (2.18). Variants without delay highlighting but with white indicating missing real-time data received poorer average ranks, and the variant without any distinction was rated worst on average.
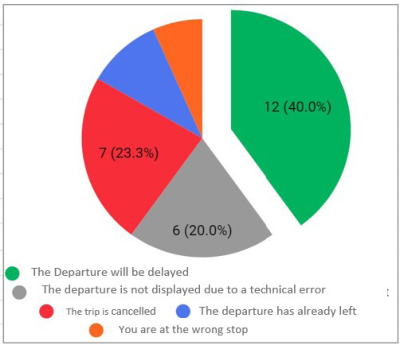
Message for Delays That Are Not Visible on the Display In the initial scenario without explanation (n = 30), only 40% selected the intended interpretation that the missing departure would still occur but with a delay. As indicated in Figure 3 twenty percent assumed a technical issue prevented display. Approximately 23% assumed the trip was cancelled; 10% thought they had missed it, and about 7% assumed they were at the wrong stop.
Figure 3: Assumptions about the most likely reason why a trip is missing from the display.
Making Delays Glanceable: Color-Coded Passenger Information Displays 231 After the scenario was extended with five ticker messages (including icons), almost two thirds selected the intended delay message as most relevant (n = 29). A distractor message concerning the same line but irrelevant to the scenario was chosen by about 17%. The remaining options were rarely selected.
After the concept was explained, evaluations were strongly positive (all n = 30). Ninety percent agreed that the information about the delayed but missing departure is helpful (47% strongly). Seventy-seven percent agreed that without the information they would wonder why the departure is missing. Sixty percent agreed that the information is noticeable; only 7% agreed that it is unclear or confusing, while two thirds disagreed with that statement.
Regarding likely behavioral responses, with the message present participants tended to prefer using an earlier alternative line to get closer to the destination (mean 2.7; 63% likely/very likely) over simply waiting for the originally planned departure (mean 2.5). Switching to a different transport mode was generally unlikely (mean 0.8), both with and without the message. When no message was available (legacy case), participants reported a high likelihood of consulting apps: using an in-app departure monitor (mean 3.3; 80% likely/very likely) and routing/journey planning (mean 3.0; 73% likely/very likely). Looking at a printed stop timetable was moderately likely (mean 2.3), while calling a hotline was very unlikely (mean 0.3).
For implementation detail, the suggested minimum delay for showing the message ranged from 0 to 10 minutes (n = 25), with a mean of 4.52 minutes and a median of 5 minutes. Regarding whether similar messages should also be shown for delayed trips that remain visible (n = 28), 43% preferred the proposed approach (messages only for missing trips), 21% agreed to show them also for visible delayed trips, and 36% supported showing them when color highlighting is not available, then only beyond larger delays (around 10 minutes on average for those respondents).
DISCUSSION
The results for initial, unexplained interpretation of colors suggest that green and yellow are robust cues: participants rarely inferred problematic meanings such as cancellations. Red, however, showed a small but notable risk of being interpreted as ‘cancelled’ when presented without an explicit cancellation marker. One practical implication is that a single delay color (e.g., yellow for any delay) may be preferable to a red/yellow distinction, especially in systems where cancellations are also signaled in red. This aligns with the variant ranking, where ‘all delays yellow’ emerged as a strong compromise.
The interpretation rate for white as ‘missing real-time data’ (about 81%) indicates room for improvement. The underlying concept of ‘real-time vs. scheduled data’ may not be salient for all users, and the multiple-choice format may have influenced responses. Future work could use open-ended questions or in-person interviews, and could test additional cues (e.g., a small symbol indicating real-time availability) while avoiding confusion with unrelated meanings such as Wi-Fi.
232 Titov and Schlegel Delay-perception thresholds were relatively low (around 3 minutes for ‘delayed’) which may reflect the sample’s strong representation of high-frequency rail systems. In networks with larger headways (e.g., bus services every 30 minutes), the same numerical delay could be perceived differently. Therefore, threshold settings should be tailored to local operating contexts; nevertheless, highlighting delays from about 3 minutes onward appears to be a reasonable general starting point.
In the scenario analysis, many participants reported they would consider alternative options when a delay is visible, suggesting that delay highlighting can support not only transparency but also effective decision-making. This may reduce perceived waiting time and, in some circumstances, actual travel time.
For the second functionality, the initial scenario demonstrated substantial ambiguity in the legacy display behavior: a missing departure was frequently interpreted as a cancellation or user error rather than as a delay. This highlights the need for better communication of ‘missing due to delay’. The proposed automatically generated message was rated as highly helpful and largely non-confusing. It can reduce the need for passengers to consult apps and provides the relevant information in an interaction-free way.
However, because the message is presented in the ticker line, its noticeability may be limited when many other messages are present. In the long term, ensuring a sufficient number of display lines remains important when procuring new hardware. Nevertheless, as a software-only enhancement, the proposed message can serve as an effective ‘workaround’ for legacy systems with limited display capacity and may reduce misunderstandings.
CONCLUSION
The study provides indications that selected extensions for LED-matrix stop displays can increase perceived usefulness and may improve users’ trust in data quality. Additional information supports decision-making during disruptions and can reduce the need to consult apps on personal devices.
Countdown color-coding appears particularly valuable for communicating delays, while careful design is needed to avoid confusing strong delay cues with cancellations. Automatically generated messages about delayed departures that are no longer visible due to chronological sorting can reduce misunderstandings, especially the risk of confusing such departures with cancellations and may be especially relevant for legacy systems with a small number of lines.
Given that stop-based DPIS was the most regularly used information medium among participants, maintaining and improving this channel is important. Future research could further test intuitive understanding of additional information types (e.g., crowding) with a more diverse participant group and using in-person methods that allow open responses.
ACKNOWLEDGMENT
The authors would like to thank Kevin Arutyunyan for the valuable contribution to the project. This work was partially supported by the European Regional Development Fund (ERDF) in Baden Wuerttemberg in the research project regioKArgoTramTrain (Funding ID: RegioInn-24577775) and by the German Federal Ministry of Transport and Digital Infrastructure as part of the mFund initiative (Funding ID: 19F2042A) in the research project “SmartMMI- model- and context-based mobility information on smart public displays and mobile devices in public transport”.
REFERENCES
Dziekan, K. (2004). Customer perceptions and behavioural responses to IT-based public transport information: literature review and what the experts say (No. 04-012). Dziekan, K., & Vermeulen, A. (2006). Psychological effects of and design preferences
for real-time information displays. Journal of Public Transportation, 9(1), 1–19. Harmony, X. J., & Gayah, V. V. (2017). Evaluation of real-time transit information systems: an information demand and supply approach. International Journal of Transportation Science and Technology, 6(1), 86–98. VDV (n.d.). VDV-Schrift 720: Kundeninformationen über Abweichungen vom
Regelfahrplan. Available at: knowhow.vdv.de. VDV (n.d.). VDV-Schrift 735: Kollektive dynamische Fahrgastinformation im öffentlichen Nahverkehr – Anforderungen an die dynamischen Informationssysteme. Available at: knowhow.vdv.de. Viergutz, K. (2015). Strategie für die Echtzeitdaten-Fahrgastinformation der
rnv Rhein-Neckar-Verkehr GmbH (Master’s thesis). Available at: fahrgast- information.de.
LISTED IN THE AHFE DIGITAL BOOKSTORE CATALOGUE
Explore the complete digital volume
Advances in Human Factors of Transportation
Read this individual research paper free through the original publisher, or explore the full digital proceedings book.
ISBN 979-8-950676-00-0
Explore this ISBN in the AHFE Bookstore ↗Listed in the July 2026 bookstore catalogue; search by ISBN to confirm current availability · Digital book purchase optional