Yusuke Hatano, Keiichi Watanuki, Kazunori Kaede, Akira Iwasaki, Shingo Takata, Toshihiro Ninokata, Kouki Arakawa, Yuuya Tsuzuki (2023). Quantification of Conspicuity Using Optical Properties and Evaluation of Impression of Pseudo-Fingerprints on Touch Panels. In: Affective and Pleasurable Design. AHFE Open Access, vol. 71, pp. 75–84. https://doi.org/10.54941/ahfe1003246
In recent years, the spread of electronic devices, such as smartphones, has increased the demand for touch panels, and the development of touch panels with excellent conspicuity has been promoted. In particular, it is important to ensure the conspicuity of touch panels in car navigation systems involved in driving, and conspicuity evaluations are conducted during development. However, currently, conspicuity evaluation is often performed using sensory evaluation, and conspicuity has not been quantified. In this study, to quantify the conspicuity of touch panels used in automobiles, we evaluated the relationship between the optical characteristics and impression evaluation by conducting evaluations of the impression and luminance of pseudo-fingerprints on a touch panel using a simulated in-vehicle environment and pseudo-sunlight. The experiment was conducted with 10 adult males, who evaluated their impressions of the panels with pseudo-fingerprints. The SD method was used to evaluate the impressions, and the Visual Analog Scale (VAS) was used as the evaluation scale. Eleven adjective pairs related to the conspicuity of pseudo-fingerprints were selected from previous studies. Eight samples were prepared for the panels-to-be-evaluated, including four for each of the lipophilic and oleophobic panels. A spin coater and pseudo-fingerprint solution were used to transfer the pseudo-fingerprints to the panels at 50 N force from the thin film by spinning the spin coater. For the position of the source of pseudo-sunlight, three conditions were selected by considering the lighting conditions that could be assumed where sunlight shines on the vehicle. These included a sunlight source directly above the sample panel, behind the left side from the viewpoint of the observer, and in an arrangement where the relationship between the pseudo-sunlight, reflective objects, and sample panel was positive reflection. In the impression evaluation experiment, the subject was asked to sit on a chair, and the position of the chinrest was adjusted after explaining the experiment. The subject was presented with the panel for 30 s while on the chinrest. Then, the tablet was handed to the subject, who evaluated the panel with the pseudo-fingerprints as observed from the chinrest position. The results of the impression evaluation were analyzed using factor analysis. Based on this analysis, the first factor, including factors such as likes/dislikes, hygiene, and prominence, was named as the conspicuity factor. The second factor related to artistry was named as the artistry factor, and the factor related to the material of the panel was named as the materiality factor. This study focused on the conspicuity factor. From the relationship between the evaluation of luminance and impression, a positive correlation of r=0.46 was achieved between the conspicuity factor score and the rate of change of luminance, and a positive correlation of r=0.56 was observed between the artistic factor score and the rate of change of luminance. In the future, we will evaluate the relationship between the factor scores and luminance change across lighting conditions and quantify the conspicuity through follow-up experiments on sensory evaluation based on luminance change.
In recent years, the demand for touch panels has increased considerably owing to the widespread use of electronic devices like smartphones. Con- sequently, the development of high-performance touch panels with superior conspicuity is needed. Specifically, the automotive industry is believed to be undergoing a once-in-a-century technological revolution owing to adva- ncements in information technology (IT). Consequently, the amount of information processed by users in cabin spaces has surged in recent years. To address this issue, the adoption rate of touch panels as user interfaces (UI)
for intuitive information control has progressively increased. Moreover, the design trend for in-vehicle spaces has shifted towards larger displays. How- ever, improvement in the visibility of these displays is necessary because the current visibility evaluation is often conducted using sensory evaluation and lacks quantification. To quantify the visibility of touchscreens used in auto- mobiles, we evaluated the relationship between optical characteristics and impression evaluation by assessing the impression and luminance of pseudo- fingerprints on touchscreens using a simulated in-vehicle environment and pseudo-sunlight.
EXPERIMENTAL METHOD Experiment Environment
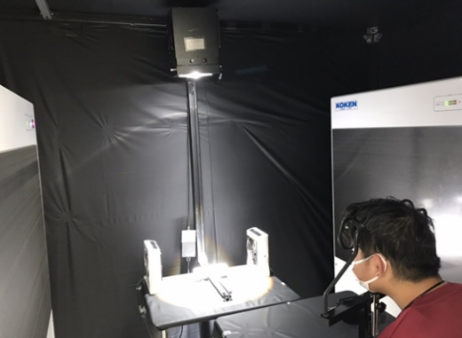
The experimental setting consisted of a dark room that simulated the envi- ronment inside a car. As depicted in Figure 1, the dark room was designed to mimic the actual in-vehicle environment by determining the positional rela- tionship between the participant and touch panel. Additionally, the position and angle of the touch panel were adjusted. Each participant’s gaze was fixed using a chin rest. The positions of the touch panel and chin rest were adjusted to correspond to an actual in-vehicle environment. The darkroom was equip- ped with a pseudo-sunlight illumination that could be affixed to an aluminum frame to modify the position of the illumination.
Evaluation Touch Panel We employed eight touchscreens featuring lipophilic and oleophobic pro- perties. Pseudo-fingerprints were uniformly applied to the surfaces of the touchscreens, and their appearance varied among the touchscreens.
Pseudo-Fingerprint
Table 1 lists the transfer conditions for the pseudo-fingerprints. Twenty drops of a pseudo-fingerprint liquid were carefully administered to form a
Figure 1: Experimental environment.
Quantification of Conspicuity Using Optical Properties Evaluation of Impression 77
Table 1. Transcription condition.
Table available in the original PDF paper.
Temperature 25
C Humidity 50% Drop Volume 0.8 ml RPM (Low Speed) 500 RPM RPM (High Speed) 1100 RPM Transcription Power 50 N
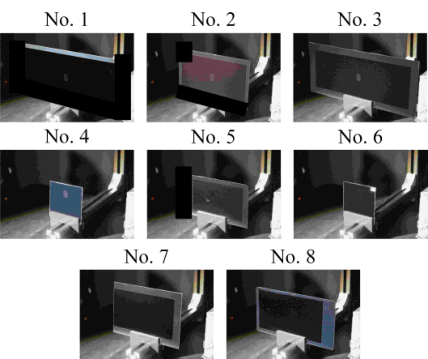
Figure 2: Sample panels.
consistent and uniform thin film on the spinning surface of a spin coater. A transfer force of 50 N was applied to prevent the crushing of the pseudo- fingerprints and enable a clear confirmation of the transfer. The sample numbers for the pseudo-fingerprints on the eight touchscreens are illustrated in Figure 2.
Lighting Condition
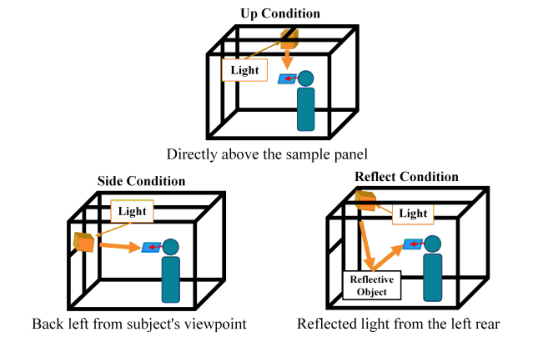
Figure 3 depicts the simulated positional relationship of each lighting condi- tion, namely the up, side, and reflected conditions. A pseudo-solar illumina- tion source (SOL-600-01D05, Tsubosaka Electric Co.) was used as the light source.
EVALUATION EXPERIMENT OF TOUCH PANEL IMPRESSION Experimental Procedures
The perception of touch panels coated with pseudo-fingerprints was assessed by ten adult males. The Semantic Differential method was used to appraise perceptions, and Visual Analog Scale (VAS) served as an assessment metric. Eleven pairs of adjectives, including terms related to filth, were generated based on previous studies (Muto, 1998). These are listed in Table 2. The above-mentioned lighting conditions were employed, and the illuminance of
Dislike Like Old New Mundane Unique Dirty Clean Jumble Clear Sober Flashy Frivolous Massive Hidden Visible Negligible Noticeable Cold Warm Sticky Smooth
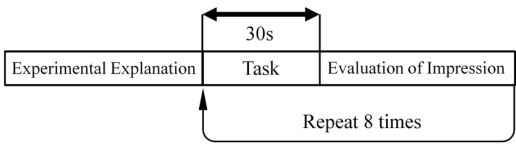
Figure 4: Experimental protocol.
both the touch panel and image was fixed at 20000 lx. The experimental procedure is illustrated in Figure 4. After the procedure was explained, the participants gazed at the touchscreens for 30 s, and then passed on the tablet to appraise their perception of the touchscreens using pseudo-fingerprints. The presentation order of the touchscreens was randomized, and impression evaluation was performed for each of the eight touchscreens under different lighting conditions. The luminance of touchscreens with pseudo-fingerprints was measured. The luminance meter gauged the luminance of each touch panel at two locations–one with fingerprints and the other without–from the
Quantification of Conspicuity Using Optical Properties Evaluation of Impression 79
gaze position of the participant. Luminance with fingerprints was measu- red at the center of the fingerprints, and luminance without fingerprints was measured 10 mm to the left of the center of the fingerprints.
RESULTS
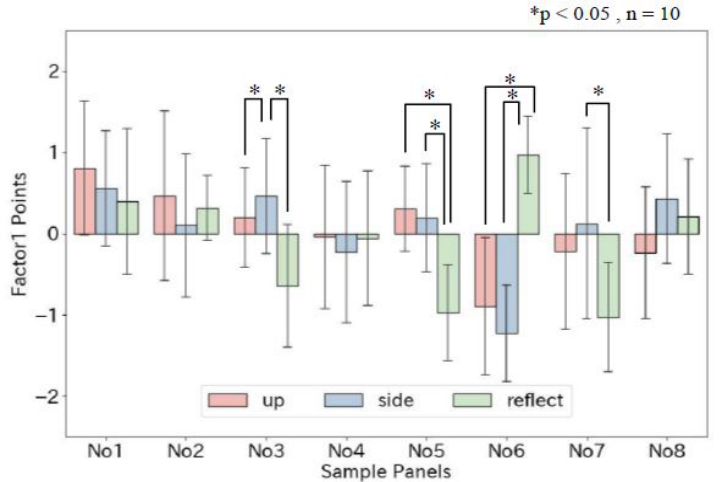
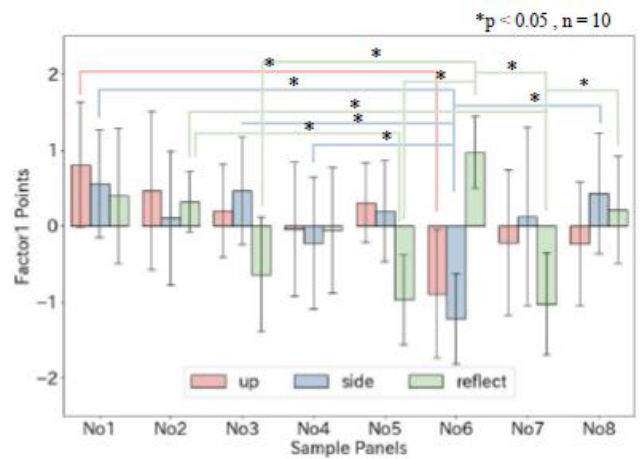
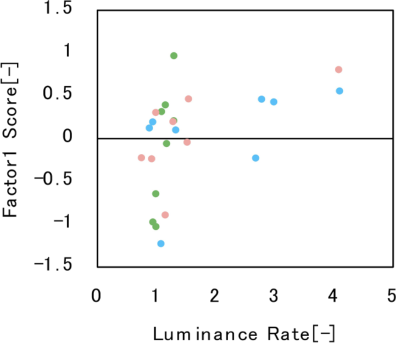
Factor analysis was performed on the data collected from 10 subjects. Based on the scree plot of eigenvalues, the number of factors was determined to be three. The results of the factor–matrix calculations are listed in Table 3. After careful consideration, the factors calculated from the results were named. Factor names were selected based on absolute values being 0.4 or higher. The first factor exhibited high values for various attributes, including pro- minence, hygiene, and likeability, as well as dichotomies like “Dirty-Clean,” “Old-New,” and “Dislike-Like.” It was named the “conspicuousness factor.” The second factor demonstrated high values for universality and artistry related to fingerprints, such as “Mundane-Unique” and “Sober-Flashy,” and was therefore named the “Artistic factor.” Factor 3 showed high values for terms related to the materiality of fingerprints, such as “Cold-Warm” and “Frivolous-Massive.” Consequently, the third factor is called the “materiality factor.” The outcomes of the first factor scores are shown in Figures 5 and 6. Steel-Dwass multiple comparison tests were conducted between the lighting conditions and each touch panel, revealing significant differences between the lighting conditions and touch panels for several items. The luminance ratio, which is the ratio of the fingerprint area to the touch panel area, was used in a previous study to obtain luminance measurement results (Naka- mura, 2000). Figure 7 demonstrates the correlation between the luminance ratio and Factor 1 scores. The correlation coefficient between the lumina- nce ratio and first factor score was 0.47. The correlation coefficients for the up, side, and reflected lighting condition were 0.65, 0.51, and 0.86, respectively.
Table 3 illustrates that factor 1 coefficient is negative, indicating that higher the factor 1 score, more salient the pseudo-fingerprints and smudges on the touch panel. As shown in Figure 5, significant differences were observed in
Quantification of Conspicuity Using Optical Properties Evaluation of Impression 81
Figure 7: Relationship between factor 1 point and luminance rate.
only one item in the Up condition. In the Side condition, significant differe- nces were observed in four items, while in the Reflect condition, significant differences were observed in six items. This discrepancy could be attributed to the way the illumination hit the touch panel, which is believed to have ampli- fied the distinction between the two conditions. Figure 7 shows a positive correlation between the luminance ratio and factor 1 score, indicating that the luminance ratio, which is an optical characteristic, can be used to quanti- tatively evaluate the salience of a touch panel. Additionally, the relationship with lighting condition exhibited a stronger correlation than the overall correlation, suggesting that lighting position impacts conspicuousness.
EXPERIMENT TO EVALUATE THE CONSPICUSITY OF PSEUDO-FINGERPRINT BY CHANGING ILLUMINANCE Experimental Procedures
To assess the connection between the optical properties of pseudo- fingerprints and the perceptual evaluation of fingerprint conspicuity, con- spicuousness assessment experiments were performed on eight adult males. VAS was used as the conspicuousness assessment scale, and five lighting con- ditions were employed: 4000, 8000, 12000, 16000, and 20000 lx. Following an explanation of the procedure, the participants were seated in a chair and the chinstrap was adjusted. They then evaluated the pseudo-fingerprints on the touch panel. The presentation order of the touchscreens was randomi- zed, and each illumination condition was assessed for eight touchscreens. The luminance of touchscreens with pseudo-fingerprints was measured. The luminance meter gauged the luminance at two spots on each touch panel— one with fingerprints and the other without fingerprints—from the gaze point of the participant. The luminance with fingerprints was measured at the cen- ter of the fingerprints, and the luminance without fingerprints was measured 10 mm to the left of the center of the fingerprints.
Result
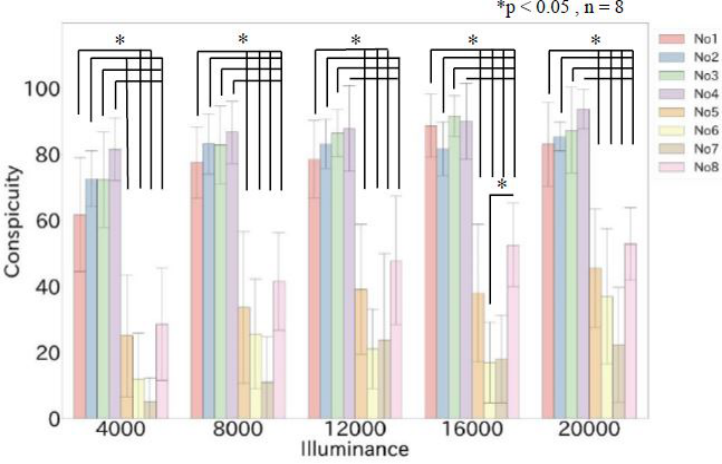
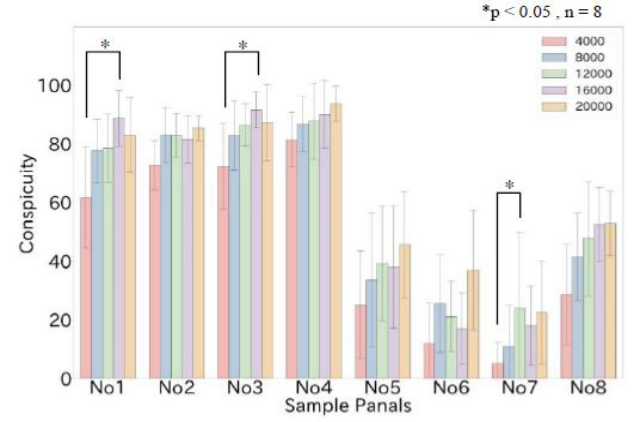
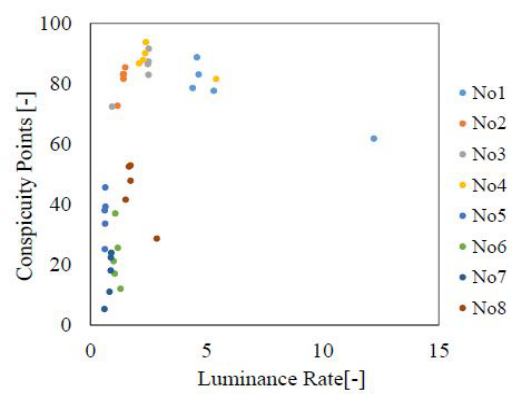
Figures 8 and 9 show the results of conspicuity evaluation. Steel-Dwass mul- tiple comparison tests were conducted for illuminance conditions and for each touch panel. The tests revealed significant differences between the illu- minance conditions for touch panels No. 1 and No. 3 between the 4000 and 16000 lx conditions and between the 4000 and 12000 lx conditions for touch panel No. 7. Additionally, significant differences were observed among tou- chscreens in terms of luminance ratio and conspicuity evaluation. Figure 10 depicts the relationship between the luminance ratio and conspicuity evalu- ation. The correlation coefficient between luminance ratio and conspicuity evaluation was 0.40, indicating a weak positive correlation. Multiple regres- sion analysis was performed to predict the objective variables using multiple explanatory variables. It was assumed that touch panel characteristics, such as oleophilic and oleophobic properties, play a significant role in the evalua- tion of luminance and conspicuity. The objective variable was the conspicuity evaluation, and explanatory variables were selected from HAZE (whiteness), reflective imaging, gloss, SCI (total reflectance), SCE (diffuse reflectance), oleic acid contact angle, fingerprint luminance, touch panel luminance, and luminance ratio, with the explanatory variable having the lowest AIC (Nino- miya, 1999). The explanatory variables with the lowest AIC were SCI_Y, SCI_b, SCE_a, SCE_b, oleic acid contact angle, touch screen luminance, and luminance ratio, with the coefficient of determination at 0.78.
Discussion
Figure 8 shows that, for all the different illumination conditions tested, there was a statistically significant contrast in the conspicuousness of the
Figure 8: Conspicuity score (Illuminance).
Quantification of Conspicuity Using Optical Properties Evaluation of Impression 83
Figure 9: Conspicuity score (sample panels).Figure 10: Relationship between conspicuity points and luminance rate.
fingerprints between touchscreens that were oleophobic (No. 1 to No. 4) and those that were oleophilic (No. 5 to No. 8), except for No. 1 and No. 5 and No. 1 and No. 8. However, Figure 9 shows that only three tou- chscreen illumination conditions demonstrated significant differences. This result indicates that the impact of touch-panel characteristics on conspicuity is more substantial than the change in conspicuity caused by alterations in illumination. Figure 10 demonstrates a positive correlation between the lumi- nance ratio and conspicuity for touchscreens No. 2, No. 3, and No. 7, and a negative correlation for touchscreens No. 1, No. 4, No. 6, and No. 8, suggesting that the properties of the touchscreens may have a noteworthy
influence on conspicuity. Table 4 indicates that the oleic acid contact angle had the highest absolute t-value. This indicates that differences in the oleo- philic and oleophobic characteristics of touch panels have a significant effect on conspicuity.
CONCLUSION
In this study, we aimed to quantify the conspicuousness of touchscreens employed in automobiles by examining the correlation between their opti- cal characteristics and impression evaluations. Specifically, we scrutinized the impressions and luminance of simulated fingerprints on touchscreens under simulated sunlight and in a simulated in-vehicle environment. Our findings revealed that dissimilarities in the oleophilic and oleophobic attributes of touch panels have a substantial impact on conspicuity. Multiple regression analysis showed that the conspicuousness of fingerprints can be quantified using touch-panel characteristics and optical attributes. In future, we intend to gather data to enhance the accuracy of the multiple regression model and establish a model that does not rely on the position of the light source, thereby enabling the quantification of visibility by optical attributes.
REFERENCES
Muto, H., Miki, K., Kojima, T., Matsubara, M. (1998). Psychologiea1 evaluation of stain on the impression of building exterior. Japan Society for Finishing Technology Volume 1998 No. 915. Nakamura, Y. (2000). A Technique for Quantitatively Examining Luminance Con-
trast in Lighting Environment. Journal of Science and Technology in Lighting Volume 84 No. 8. Ninomiya, S. (1999). AIC (Akaike Information Criterion). Nippon shokuhin kagaku kogaku kaishi Journal of the Japanese Society for Food Science and Technology Volume 46 No. 1.
LISTED IN THE AHFE DIGITAL BOOKSTORE CATALOGUE
Explore the complete digital volume
Affective and Pleasurable Design
Read this individual research paper free through the original publisher, or explore the full digital proceedings book.
ISBN 978-1-958651-47-6
Explore this ISBN in the AHFE Bookstore ↗Listed in the July 2026 bookstore catalogue; search by ISBN to confirm current availability · Digital book purchase optional