This paper proposes a simulation-based contact pressure (CP) prediction model for prototyping electronic textile (e-textile) wearable devices for health monitoring. This study uses a CLO 3D garment simulator, and knit fabrics are investigated in different weights and polyurethane contents. The first phase presents a comparative analysis of simulated and experimental stress. Based on the understanding of simulated stress, the CP model is developed by modifying Laplace’s law and using the simulated stress. The CP model is validated using a pressure sensor to compare the actual contact pressure. The developed CP model helps garment designers and engineers select the appropriate material and product size to achieve the target pressure required for ECG health monitoring in their decision-making.
Electronic textiles, which are electronics and textiles are integrated, have shown significant improvements over conventional rigid electronic com- ponents (Choudhry et al., 2021). Though much literature has focused on e-textile and the device itself, few research has focused on the material sele- ction, sizing, and fit of the garment impact on electrocardiogram (ECG) signal quality. Improving textile-based biosensing devices, such as the ECG armband, requires design precision including body size, fit, and material sele- ctions to meet optimal contact pressure to get a clear ECG signals and wear comfort (Li et al., 2021).
Digital technologies to evaluate pressure has been widely adopted in the apparel and textile industry (Brubacher et al., 2021). About 65 % of apparel and textile companies in the United States have used 3D garment simula- tions of more than one type in their manufacturing systems (‘Adoption of 3D Applications in the Apparel and Fashion Industry’, 2020). For example,
Simulation-Based Prediction Model to Optimize Contact Pressure of Knitted Fabrics 199
CLO 3D, a commercial 3D garment simulator, includes stress measurement features that allow garment designers or product developers to evaluate the garment fit (Lee et al., 2021). However, based on the literature review, none investigated how the stress measurement relates to engineering stress or the actual contact pressure measurement. Knowles et al. recently examined the potential of using the simulator to predict the desired contact pressure for prototyping wearable armbands (Knowles et al., 2022). Yet, it still needs clear contact pressure prediction for the specific target range by developing a contact pressure model.
This research aims to develop a contact pressure prediction model for pro- viding guidance on selecting the appropriate knit materials and the required pattern size for the target contact pressure.
CONTACT PRESSURE CONSIDERING ECG DATA QUALITY AND WEAR COMFORT Contact pressure is critical for designing textile-based biosignal devices as the contact pressure directly contributes to the ECG sensing quality and skin- electrode impedance (Li et al., 2021). The higher contact pressure increases ECG data quality by reducing skin impedance and noise (Takeshita et al., 2022). The research found that at least a minimum of 1 kPa is required for a suitable ECG signal without motion artifacts (Takeshita et al., 2022), (Li et al., 2021). However, too high contact pressure is not suitable to increase ECG signal quality due to wearing comfort. Kuzimicheve et al. introduced an acceptable contact pressure on different human body locations (Gupta, 2020). The location of pressure applied include bust, waist, hip, thigh, knee, and limbs (Gupta, 2020). The upper body is more accessible than the lower body regarding acceptable contact pressure, but it would vary for indivi- duals considering gender, cultural, and psychological perception difference. Still, the research guided that the approximate range of minimum accepta- ble contact pressure is 0.2 kPa, to the maximum allowable contact pressure of 4.8 kPa. For the bicep area, 0.8-1.2 kPa is an optimum range of contact pressure (Gupta, 2020).
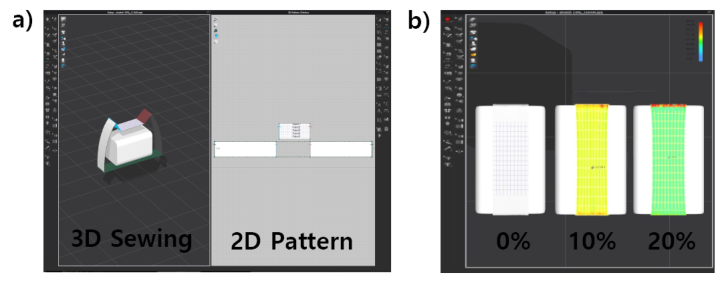
EXPERIMENTAL METHODS In the first phase, nine types of plain knits were strategically selected having different weight and polyurethane contents. They were examined for mech- anical property tests, including weight, thickness, bending properties, and tensile properties. A simple test kit (CLO Fabric testing Kit 2.0) was used for digitizing fabric properties and importing them into the 3D simulator. To compare simulated and experimental stress, the universal tensile tester (MTS Q-Test) was utilized for the tensile testing. A virtual tensile tester was devised in the 3D simulator, as shown in Figure 1. We loaded a specimen stabilized at both ends by the gripper, then constantly pulled it lengthwise uniaxially. Each sample was deformed in both wale and course directions. Engineering stress (kPa) is calculated using the force (N) divided by the cross-sectional area (m2) of the material. A non-linear curve fit was statistically used to determine the
Figure 1: The captured image of 3D simulator window: a) setup image of the devised stretch test, b) virtual stretch tests.
Residual Sum of Square (RSS) to compare simulated and measured tensile test results. For the standard bending property test, flexural rigidity is mea- sured using the Cantilever method according to standard D1388-14. Bending stiffness (flexural rigidity) is an important parameter related to the material’s inherent flexibility or stiffness. A cantilever tester was used to measure the flexural rigidity according to standard D1388-14.
The CP model is evaluated in the second phase by comparing it with actual measurements using a Kikuhime pressure sensor (TT Medi Trade). The measurements were repeated three times to ensure repeatable and consistent data.
RESULT AND DISCUSSION
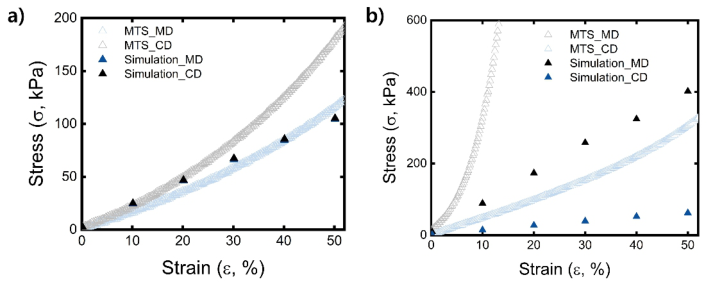
Simulated- and Experimental Stress Comparison To compare the results between simulation and physical testing, stress-strain curves were plotted as shown in Figure 2. We measured the simulated stress at the five points when the strain was applied by 10, 20, 30, 40, and 50%. For the standard testing using the MTS-Q test, the stress was continuously measured up to 50%. The stress-strain curve results shown in Figure 2 sho- wed two representative cases of well-fitted and unfitted between simulated and experimental stress. A higher modulus represents the steeper slope, which refers that the more resistant required to deform the fabric when stretching. In this study, Figure 2-a) showed relatively lower elastic modulus than 2-b) sample. This tensile behaviour is aligned with the fact that 2-a) is knit fabric consists of polyester 90 % and polyurethane 10%, whereases 2-b) consists of 100% polyester. We found that the specimen with a lower modulus better fits than those with a higher modulus. The simulated stress of the samples (Figure 2-a) with a lower flexural rigidity (below 15 µN) showed similar anisotropic tensile behaviour up to approximately 20 %. Yet, the simulated stress of the specimens (Figure 2-b) with higher modulus is different from the physical tensile test stress results.
Simulation-Based Prediction Model to Optimize Contact Pressure of Knitted Fabrics 201
Figure 2: Simulated and physical tensile test results. a) A case of the well-fitted curve sample with lower flexural rigidity, b) A case of the deviated curve of the sample with higher flexural rigidity.
Thus, the CLO 3D simulation stress should not be directly referred to the engineering stress but limited to a specific range of materials in a lower flexu- ral rigidity. The polygonal spring-mass system made it differently to evaluate simulation stress compared to the experimental value. The relatively higher modulus fabric led to less realistic results, which could not follow the non- linear anisotropic behaviour. This may be due to the lack of yarn simulation parameters such as yarn types, twists, construction, and density that were excluded in the simulator, which led to disregarding the knit fabrics’ three- dimensional structure. To validate the simulated data, the residual sum of squares was used to evaluate the simulation’s accuracy compared to experi- mental values for the non-linear curve fit. Then, an acceptable curve fit was determined and used for further study.
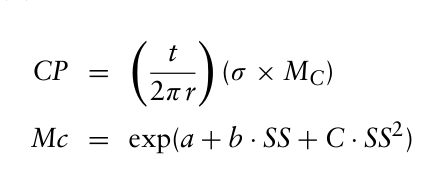
Contact Pressure Model and Demonstration Based on the understanding of the simulated stress mechanism, the contact pressure prediction (CP) model was developed by modifying Laplace’s law, shown in equation (1)
Equation reproduced from the original PDF.
Where t is the thickness of the specimen (m), and r is the radius of a cylin- der (m). σ is simulated stress (kPa), ε is simulated strain obtained from Clo 3d, SS is stretch stiffness (course), which is a digitized simulation parameter (g.mm2). MC is a material constant that can be calculated by plugging the constants (a, b, and c are 4.42549, -0.05652, and 3.93323e-4, respectively.). One can predict the contact pressure by plugging in the measured simulation stress value and digitized stretch stiffness in equation (1) to predict actual contact pressure.
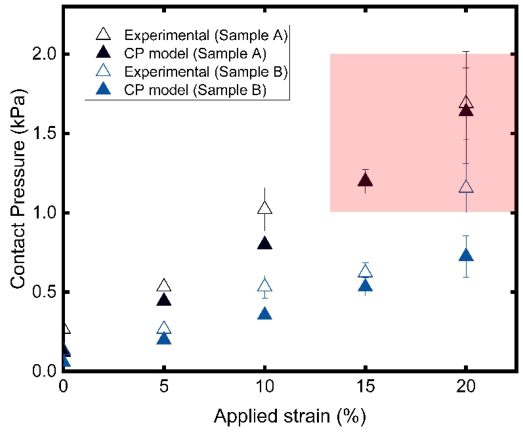
Figure 3: The developed CP model for the application of material selection for the target contact pressure required for a wearable device. (Sample A: knit fabric with the higher modulus, Sample B: knit fabric with the lower modulus.)
The results show that the developed CP model was fit to predict the acutal contact pressure (R-square 0.90). This result was higher than Laplace’s law prediction model (R-square 0.87). Theoretically, tension is predicted using the elastic modulus at the applied strains based on uniaxial stress-strain, but it is insufficient to characterize isotropic knit fabric properties (Moriarty, 1980). The simulated stress is based on the physics-based polygonal mass-spring model. The CP model using the simulated stress predicted better as it may be due to simulated stress’s multiaxial internal stress mechanism, including wale, course, and bias directions.
Figure 3 shows the result of experimental contact pressure and predicted contact pressure using the CP model as a function of applied strains. Our CP model was applied at different strains (0, 5, 10, 15, and 20 %) to select the optimal material for the targeted contact pressure. As strain increases, the contact pressure increases from 0 to 20 %. For example, wearable designers can design the ECG armband considering ECG signal quality and wearer’s comfort and set the optimal contact pressure range from at least 1.0 kPa to a maximum of 2.0 kPa.
Then sample B would not be appropriate as it won’t achieve the requi- red contact pressure of at least 1kPa. Instead, one can choose the sample A, which is expected to target the contact pressure above 1 kPa at 15% and 20% applied strain. The applied strain of 15 % means that the circumfere- nce of an ECG armband should be reduced by 15% of the original pattern size in the width direction. Considering the good signal acquisition within the pressure comfort level, one can select the 15% strain for working with sample A. The developed CP model shows great potential that wearable engi- neers or designers can strategically choose the appropriate material for their
Simulation-Based Prediction Model to Optimize Contact Pressure of Knitted Fabrics 203
product to meet the required target pressure and the specific reduction size of the armband pattern for the selected material.
CONCLUSION
In this work, we focused on the strategic digital design method of weara- ble garments considering the material selection, pattern size, fit and contact pressure between skin and e-textile. The developed CP model using simula- tion will aid wearable or functional garment designers in optimizing contact pressure by selecting the appropriate knit fabrics and pattern sizing to achieve a good ECG signal quality.
ACKNOWLEDGMENT
The authors would like to acknowledge Nano-extended Textiles Research Group (NEXT) members from North Carolina State University. The authors acknowledge the research funding from VF Corporation.
REFERENCES
‘Adoption of 3D Applications in the Apparel and Fashion Industry’ (2020).
Weave Services Limited. Available at: https://www.weavenow.com/wp- content/uploads/2021/03/Weave-Whitepaper-Adoption-of-3D-Applications- in-Apparel-and-Fashion-Industry.pdf (Accessed: 6 February 2023). Brubacher, K. et al. (2021) ‘Evaluation of the Accuracy and Practicability of Predicting Compression Garment Pressure Using Virtual Fit Technology’, Clo- thing and Textiles Research Journal, p. 0887302X2199931. Available at: https://doi.org/10.1177/0887302X21999314. Choudhry, N.A. et al. (2021) ‘Textronics—A Review of Textile-Based Wearable Ele-
ctronics’, Advanced Engineering Materials, 23(12), p. 2100469. Available at: https://doi.org/10.1002/adem.202100469. Gupta, D. (2020) ‘New directions in the field of anthropometry, sizing and clothing fit’, in Anthropometry, Apparel Sizing and Design. Elsevier, pp. 3–27. Available at: https://doi.org/10.1016/B978-0-08-102604-5. 00001–9. Knowles, C.G. et al. (2022) ‘E-Textile Garment Simulation to Improve ECG Data
Quality’, in 2022 IEEE 16th International Symposium on Medical Informa- tion and Communication Technology (ISMICT). 2022 IEEE 16th International Symposium on Medical Information and Communication Technology (ISMICT), Lincoln, NE, USA: IEEE, pp. 1–6. Available at: https://doi.org/10.1109/ISMICT 56646.2022.9828269. Lee, S., Yu, D., Shin, B., Youn, S., Shim, M., & Yun, C. (2021). Prediction of Fabric Drape Using Artificial Neural Networks. Journal of the Korean Society of Clothing and Textiles, 45(6), 978–985. Li, B.M. et al. (2021) ‘Influence of Armband Form Factors on Wearable ECG Moni-
toring Performance’, IEEE Sensors Journal, 21(9), pp. 11046–11060. Available at: https://doi.org/10.1109/JSEN.2021.3059997. Moriarty, T.F. (1980) ‘The law of Laplace. Its limitations as a relation for diastolic pressure, volume, or wall stress of the left ventricle.’, Circulation Research, 46(3), pp. 321–331. Available at: https://doi.org/10.1161/01.RES.46.3.321. Takeshita, T. et al. (2022) Development of Wearable Multi-Lead ECG Measure-
ment Device using Cubic Flocked Electrode. preprint. In Review. Available at: https://doi.org/10.21203/rs.3.rs-1810447/v1.
LISTED IN THE AHFE DIGITAL BOOKSTORE CATALOGUE
Explore the complete digital volume
Human Interaction and Emerging Technologies (IHIET-AI 2023): Artificial Intelligence and Future Applications
Read this individual research paper free through the original publisher, or explore the full digital proceedings book.
ISBN 978-1-958651-46-9
Explore this ISBN in the AHFE Bookstore ↗Listed in the July 2026 bookstore catalogue; search by ISBN to confirm current availability · Digital book purchase optional