Gregor Harih, Jasmin Kaljun, Bojan Dolšak (2020). Influence of Fingertip Anthropometry and Anatomy on Mechanical Loads During Grasping. In: Advances in Applied Digital Human Modeling. AHFE Open Access, vol. 11. https://doi.org/10.54941/ahfe100412
Many researchers have investigated the mechanical loads during hand tool use to increase the user performance, satisfaction, and lower the risk of acute and cumulative trauma disorders. While grasping, the mechanical loads are directly transferred to the hand. Rough guidelines of pressure discomfort (PDT) and also pressure-pain threshold (PPT) were provided by previous researchers, where values differ by the subject and the area of the hand. The difference in both limits is between subjects due to the different psychological and physiological factors. In order to understand the physiological aspect of the PDT and PPT difference between subjects, we investigated the influence of the fingertip anthropometry and anatomy on the grasping and the resulting mechanical loads on the fingertip using finite element analysis. Results from the numerical tests have shown significant difference between peak contact pressures as well as the contact pressure distribution between different fingertips. It has been shown that based only on anthropometry the peak contact pressure values and contact pressure distribution cannot be predicted, since geometry of the anatomical structures, especially the bone has significantly higher influence on the peak contact pressure and contact pressure distribution during grasping.
A significant part of manual work is still done using hand-tools, therefore a correct design is crucial for preventing upper extremity acute trauma disorders and cumulative trauma disorders, such as blisters, carpal tunnel syndrome, hand-arm vibration syndrome, tendonitis, etc. (Moore, et al. 1991). Many researchers have paid a lot of attention to hand tools in terms of perceived discomfort. Comfort is strongly correlated to user performance and injury frequency (Kinchington, et al. 2012, Kuijt-Evers, et al. 2007, Mundermann, et al. 2001). Comfort is affected by physical, physiological, and psychological factors, and is subjectively defined by feelings, which differs from subject to subject (De Looze, et al. 2003). Therefore designers have to optimize the human-product interaction in order to reduce the discomfort (Kuijt-Evers, et al. 2004). The feeling of discomfort whilst using a hand-tool can reduce the efficiency of the task, and user’s satisfaction. The reduction of discomfort is mainly possible by optimising the functionality of the hand-tool, and the physical interaction between the hand and the handle. It has been also shown that great correlation exists between physical and psychophysical properties of the materials which are in touch by the users (Wongsriruksa, et al. 2012).
The mechanical properties of the skin and subcutaneous tissue is very important during grasping tasks as they are in direct contact and the forces and moments are transferred from the tool to the whole hand-arm system. They have been extensively investigated by many researchers showing that skin and subcutaneous tissue have non-linear viscoelastic properties, where the skin is stiffer than the subcutaneous tissue (Clark, et al. 1996, Edwards and Marks 1995, Pan, et al. 1998, Wan Abas 1994, Wilhelmi, et al. 1998, Wu, John Z., et al. 2007, Zheng and Mak 1996). Both have low stiffness regions at small strains followed by a substantial increase in the stiffness when the strain increases. Brand and Hollisters’ (1999) rough guidelines are provided for the maximum suggested pressure versus time application over bony prominences. It has been shown that higher contact pressures than allowed for a specific time can result in discomfort, pain, and ischemia which can lead to ATD and CTD. It has been shown that hand- tools which require high grip, push, pull or torque exertion on the handle produce high contact pressures, which is known to be one of the primary factors for the development of ATD and also CTD (Eksioglu 2004, Radwin, et al. 1987, Rempel, et al. 1992, Riedel 1995). However some authors have argued that higher contact area can lower the subjective comfort rating, since higher contact area triggers more pressure sensors in the soft tissue (Goonetilleke and Eng 1994, Xiong, et al. 2011). Therefore the designer has to find the optimal contact area which can increase the subjective comfort rating and lower the risk of ATD and CTD which are contact pressure induced.
Aldien et al., (2005) provided rough guidelines of pressure discomfort (PDT) and also pressure-pain threshold (PPT), where PPT is higher than PDT and values differ by the area of the hand. Also different subjects reported different values due to subjective perception of the load on the hand. The PDT limit of 188kPa has been reported by Aldien et al. (2005), however Fransson-Hall and Kilbom (1993) estimated the value as 104kPa. In order to maintain the desired user performance, the designer has to design tool-handles, which distributes contact pressure more evenly and do not exceed the PDT limits (Aldien, et al. 2005).
As comfort ratings when using hand tools are subjectively defined, it is also preferable to use subjective measurement methods such as hand tool testing of targetted populations and questionnaires, when evaluating a hand tool (Kuijt-Evers, et al. 2007). However this method gives only the resulting comfort rating and does not provide any insight into the physiological aspect of comfort and the difference between the subjects. Subjective methods also have clear disadvantages such as time error and context effects (Annett 2002).
Therefore we utilized finite element analysis to investigate the influence of fingertip anthropometry and anatomy on mechanical loads during grasping using three different 3D fingertip models based on reconstructed medical images.
METHODS
In order to investigate the influence of fingertip anthropometry and anatomy on mechanical loads we used finite element simulation software Abaqus/CAE 6.10 from Dassault Systems (France). Previous authors have shown, that it is a reliable FEA software for simulating human tissue behaviour under mechanical stresses (Wu and Dong 2005, Wu, et al. 2002, Wu, J. Z., et al. 2007).
We modelled three different 3D fingertip models based on reconstructed. Tool-handle was modelled as flat block with corresponding material parameters. Body force was applied on the bones of the fingertip to simulate the finger force while grasping a tool-handle. Numerical tests using predefined forces were performed to produce characteristic contact pressures. For each numerical test we observed the contact pressure distribution at the contact area, continuous peak contact pressure value and vertical fingertip displacement.
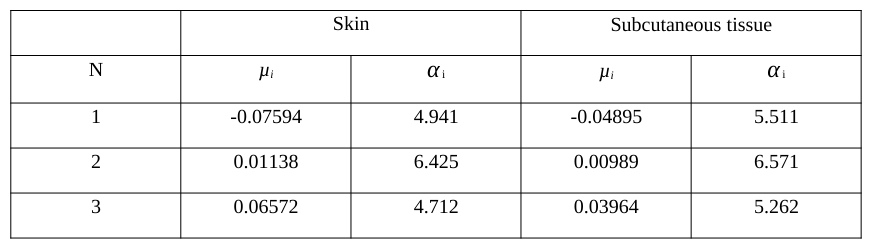
Finite element model – material parameters Fingertip bone and nail were assumed to be linear elastic with isotropic material parameters with Young´s modulus of 17GPa and 170MPa respectively, with a Poisson ratio of 0.3 (Wu, et al. 2002). The material parameters of skin and subcutaneous tissue were extracted from a uniaxial tensile test, and were fitted to the Ogden hyper-elastic material model (Pan, et al. 1998) (Table 1 and 2). Since skin and subcutaneous tissue are almost incompressible, the
Poisson ratio was determined to be 0.4 (Wu, et al. 2002). Steel as a quasi-rigid material was used for the tool handle material with Young´s modulus of 210Gpa and a Poisson ratio of 0.3.
Table 1: Material parameters determining hyper elasticity of skin: Skin Subcutaneous tissue
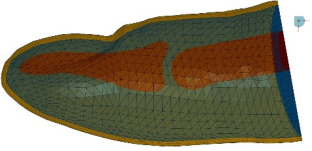
Finite element model – geometrical and boundary conditions For the FE models we used three different 3D reconstructed models of a human fingertip based on medical imaging (Figure 1) (Yoshida, et al. 2011).
Figure 1. Comparison of anatomy between different fingertips in cut view.
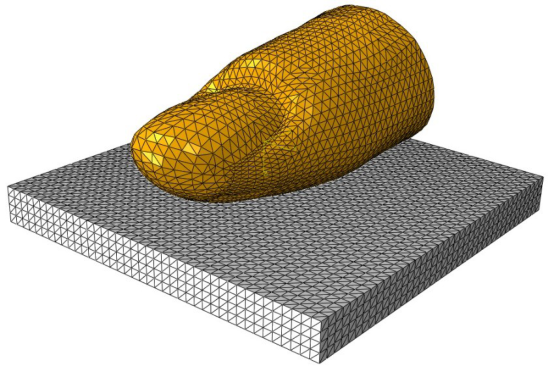
For the grasping simulation a flat block representing a tool handle was modelled and was positioned to be in contact with the fingertip (Figure 2). Displacements and rotations of the block representing the tool-handle were fixed on the lower surface. The displacement and rotations of the fingertip were fixed, except for the displacement along the vertical axis. In the simulations the fingertip and surface were meshed using C3D4 elements (Figure 2).
Figure 2. Fingertip and surface meshing.
Finite element model – numerical tests The simulated finger force was set to obtain characteristic contact pressures of 40kPa, 80kPa, 120kPa and 160kPa using the fingertip 003, which was closest to the 50th percentile human fingertip geometry. Same finger force was then applied to simulations using other two human fingertips (001 and 002).
RESULTS
Verification In our previous research we verified and validated our 2D FE model in regard to existing FE models and to experimental data, since it showed great correspondence between both results (Harih and Dolšak 2013).
In order to verify the 3D fingertip model, the closest match according to the anthropometric measurements of the 2D fingertip was chosen. We investigated the continuous peak contact pressure versus vertical displacement of the fingertip. Results show excellent correspondence, since there is only small difference in the contact pressure for the given vertical displacement (Figure 3). The slight difference in the curve shape can be explained by slightly different geometries of the 2D and 3D fingertip models. Thereby it can be assumed, that the 3D fingertip has been verified.
Figure 3. Comparison of continuous peak contact pressure versus vertical deformation of the 2D and
Figure available in the original PDF paper.
3D fingertip.
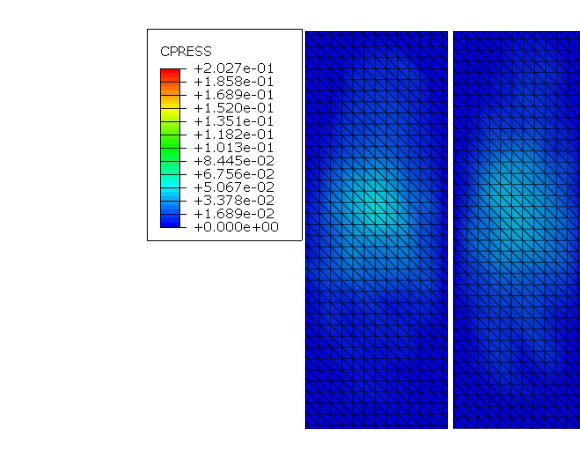
Contact pressure distribution For each fingertip and load-case we provided contact pressure distribution, which showed the distribution of the contact pressure of the fingertip across the contact area between the fingertip and tool-handle. Thereby direct comparisons and evaluations between different fingertip geometries and load-cases were possible (Figures 4, 5, 6, and 7).
Firstly we observed the load-case where a peak contact pressure of 40kPa was obtained during the contact of the fingertip 003 with the surface (Figure 4), which simulates contact pressure holding a tool in the hands (Aldien, et al. 2005). The finger force, which needed to reach this contact pressure, was then applied to simulations using other two fingertips (001 and 002). The highest contact pressure was obtained with fingertip 001 and was 52kPa, while the contact pressure with fingertip 002 was 41kPa.
001 002 003
Figure 4. Contact pressure distribution for finger force producing 40kPa with fingertip 003.
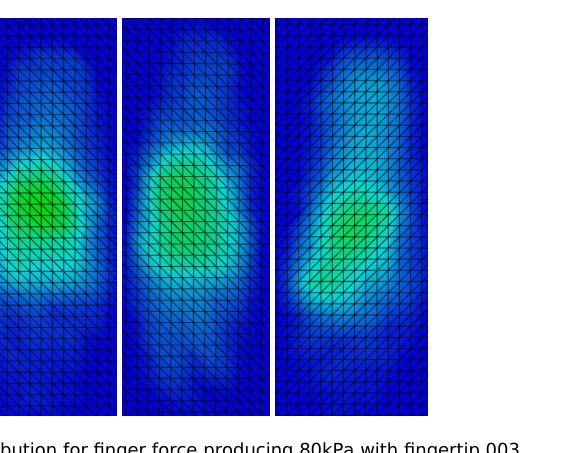
For the next load case we set the finger force to produce the maximum contact pressure of 80kPa during the contact of a fingertip 003 with the surface (Figure 5). The resulting maximum contact pressure for the set finger force was with the case of fingertip 001 104kPa and for fingertip 002 84kPa. From the distributions it is also evident, that different fingertip geometries start to show different contact pressure distributions.
001 002 003
Figure 5. Contact pressure distribution for finger force producing 80kPa with fingertip 003.
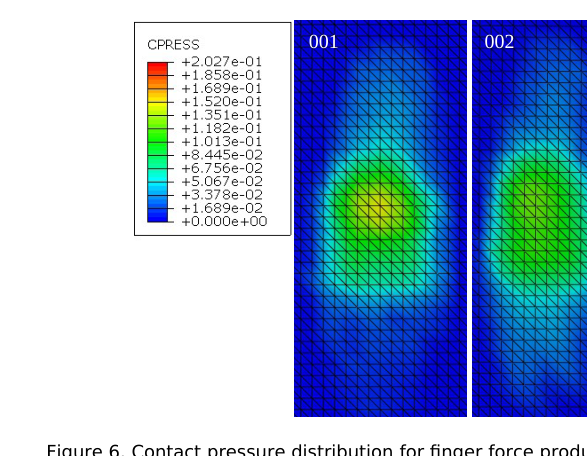
In next load case we observed the contact pressure distribution where a maximum contact pressure of 120kPa was obtained during the contact of the fingertip 003 with the surface (Figure 6). The results show the trend that fingertip 001 produces the highest maximum contact pressure (154kPa) followed by fingertip 002 (125kPa). Additionally the difference in contact pressure distributions for each fingertip become more different.
001 002 003
Figure 6. Contact pressure distribution for finger force producing 120kPa with fingertip 003.
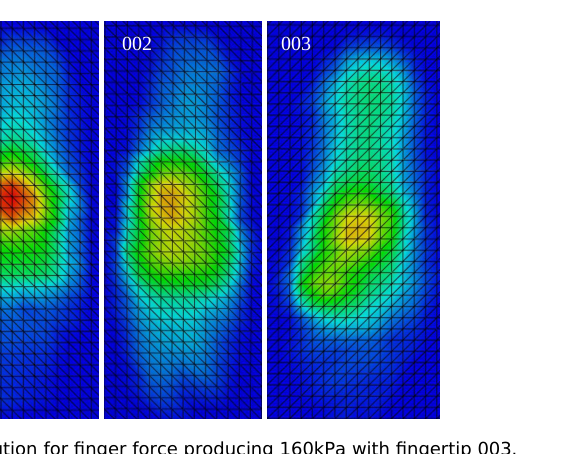
The final load case was set to produce 160kPa of maximum contact pressure with the fingertip 003. The finger force needed to obtain this contact pressure was then again applied to other fingertips. The highest contact pressure was again obtained with the fingertip 001 (203kPa) followed by the fingertip 002 (166kPa) (Figure 7).
001 002 003
Figure 7. Contact pressure distribution for finger force producing 160kPa with fingertip 003.
Contact pressure – normalized finger force We also plotted the maximum continuous contact pressure for each fingertip in comparison to the normalized finger force to observe the difference between the different fingertip geometries (Figure 8). The results show almost linear correlation between the maximum contact pressure and the normalized finger force. It is evident that fingertip 002 and 003 have almost the same behavior, while the fingertip 001 shows significant higher contact pressures for the given normalized finger force.
220
200
180
160
140
120
100
80
60
Contact pressure (kPa)
40
20
0 0.1 0.2 0.3 0.4 0.5 0.6 0.7 0.8 0.9 1 0
Normalised finger force
Fingertip 001 Fingertip 002 Fingertip 003
Figure 8. Maximum continuous contact pressure versus normalized finger force.
Figure available in the original PDF paper.
Contact pressure – vertical finger displacement We also observed the continuous contact pressure in comparison to the vertical finger displacement. Fingertips 002 and 003 show almost the same behavior, where the fingertip 002 shows slightly higher vertical finger displacement for the given contact pressure. The fingertip 001 shows almost the same behavior to a vertical finger displacement of around 3mm. Afterwards the fingertip 001 produces significantly higher vertical finger displacement for the given contact pressure.
Figure 9. Maximum continuous contact pressure versus vertical finger displacement.
Figure available in the original PDF paper.
DISCUSSION
Contact pressure distribution It has been shown that power grasps of badly sized and shaped tool-handles can yield in high contact pressures, which can induce many ATD and CTD. Previous research showed different values of PDT and PPT, where values differ by the subject and the area of the hand. In order to investigate the physiological aspect of the difference, we investigated the contact pressure distribution of a three different fingertip geometries with four load cases of 40kPa, 80kPa, 120kPa and 160kPa.
For the first load case, which was set to produce 40kPa with the fingertip 003, the results already show difference between each fingertip (Figure 4). The highest contact pressure was obtained with the fingertip 001. This can be explained by the contact pressure distribution, which shows, that with the fingertip 001 the contact pressure is distributed over smaller area in comparison to the fingertips 002 and 003. The results show that the higher value of contact pressure of the fingertip 001 is due to more concentrated contact pressure, while the contact pressure of the fingertip 002 is more evenly distributed across the contact area. This is even more evident with the fingertip 003, where the contact area is larger especially in the direction towards the end of the finger.
In next load case (80kPa with the fingertip 003) the difference in contact pressure distribution is even more evident (Figure 5). From the maximum contact pressure for each fingertip and contact distribution it can be concluded that the fingertip 001 produces higher maximum contact pressure due to the smaller contact area and strong non-uniform distribution. The fingertip 003 shows completely different contact pressure distribution. This indicates, that higher area of the fingertip is in contact in comparison to the fingertip 001, where contact is established only at the centre. Despite the contact pressure distributions between fingertip 002 and 003 show significant difference, the peak contact pressure is just slightly different. This can be explained by the very even contact distribution of the fingertip 002.
In load case, which was set to produce 120kPa with the fingertip 003, the difference in contact pressure distributions by all fingertips continues the trend from the previous load cases. The maximum contact pressure of the fingertip 001 is 154kPa, which is 34kpa over the maximum contact pressure of the fingertip 003 (120kPa). The difference is clearly visible from the contact pressure distribution (Figure 6). While the contact pressure distribution with the fingertip 001 shows smaller contact area and higher differences, the fingertip 003 shows higher contact area and more even contact pressure distribution. Despite the fingertips 002 and 003 produce almost the same contact pressure (125kPa and 120kPa respectively), the contact pressure distributions differ to great extent. Fingertip 002 shows oval like contact area with even contact pressure distribution, while the fingertip 003 shows longer and narrower contact area and contact pressure distribution with higher differences in contact pressure.
Finally we discuss the results from the load case, which was set to produce 160kPa with the fingertip 003. The peak contact pressure was obtained with the fingertip 001 (203kPa), which is 43kPa over the value with the fingertip 003. The peak contact pressure of the fingertip 002 is slightly over the contact pressure of the fingertip 003 (166kPa and 160kPa respectively). The final load case confirms the trend, which showed uneven contact pressure distribution by the fingertip 001. Despite the similarity of the contact area shape of the fingertip 001 and 002, the difference in contact pressure distribution is significant. In case of the fingertip 002, the contact pressure is more evenly distributed. The fingertip 003 shows again significant difference in contact area and pressure distribution. All fingertips have one peak contact area. In fingertip 001 and 002 the location of the peak contact pressure is similar, however the fingertip 003 shows different location.
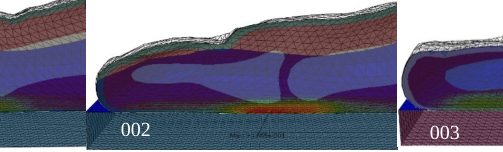
The differences in peak contact pressures, their locations and contact pressure distributions cannot be discussed without the evaluation of each fingertip geometry and anatomy. Therefore we additionally observed a cut view of each fingertip during contact of the tool-handle with the highest load case (Figure 10). Based on the cut views it is evident that the geometry of the both bones have significant impact on the resulting contact peak pressure as well as Applied Digital Human Modeling & Simulation (2020) the contact pressure distribution. The fingertip 001 distal phalange bone is in comparison to the bone of the fingertip 002 and 003 smaller and shorter. Based on the cut view it is also evident that the angle of the lower contour of the bone in fingertip 001 is slightly tilted upwards in comparison to the fingertip 003. Concave like distal phalange bone of fingertip 003 with almost no tilt produces uniform contact pressure distribution, which is distributed across the whole length of the finger. This can be explained by the fact that the soft tissue is encapsulated by the bone due to its shape. The shape of the distal phalange bone of fingertip 001 is similar to the shape of the bone of fingertip 002, however it is smaller, which explains the higher peak contact pressure and less uniform contact pressure distribution.
001 002 003
Figure 10. Cut view of each fingertip anatomy during contact of the tool-handle at the highest load case.
Contact pressure – normalized finger force We also investigated the continuous peak contact pressure versus normalized finger force (Figure 8). The peak contact pressure point is determined for each fingertip at the highest load case. The results provide continuous values of contact pressure for peak contact pressure point in comparison to the normalised finger force. From the diagram it is evident, that the fingertip 001 shows significantly different curve. For the given normalised finger force fingertip 001 produces higher contact pressure in comparison to the fingertip 002 and 003. Fingertip 002 and 003 show similar behaviour, however it can be observed, that the curves intersect at about normalised finger force of 0.1. This can be explained by the fact that more than one fingertip parameter has influence on the results of peak contact pressure in comparison to the normalised finger force. This suggests that the fingertip amount of soft tissue as well as underlying geometry of anatomical structure of the bone has significant impact on the resulting contact pressure in comparison to the normalised finger force. Based on the results of contact pressure distribution it can be concluded that at lower contact pressure the amount of soft tissue has greater influence on the resulting contact pressure and at higher contact pressures, when the soft tissue is already deformed, the fingertip anatomy and its geometry has higher influence on the resulting contact pressure and distribution.
Contact pressure – vertical finger displacement Additionally we also investigated the continuous peak contact pressure in comparison to the vertical deformation of fingertip. All fingertips show the characteristic behavior typical for the hyper-elastic skin and subcutaneous tissue (Figure 9). At the start of the grasping simulation the increase of contact pressure with fingertip vertical displacement is relatively small. However due to the non-linear behavior of the soft tissue, the soft tissue shows substantial increase in stiffness when the contact pressure is increased. Again, the fingertip 002 and 003 show similar curve with similar amount of vertical fingertip displacement and peak contact pressure and fingertip 001 shows significantly different behavior. Since fingertip 001 can be considered as thick finger, it has significantly more soft tissue compared to the fingertip 002 and 003. Therefore also the deformation and vertical displacement is higher than with the fingertip 002 and 003.
CONCLUSIONS
We investigated the physiological aspect of the PDT and PPT difference between subjects and the influence of the fingertip anthropometry and anatomy on the grasping and the resulting mechanical loads on the fingertip using finite element analysis. Results have shown there is significant difference in peak contact pressure values as well as contact pressure distributions. It has been shown that based only on anthropometry the peak contact pressure values and contact pressure distribution cannot be predicted. Therefore it is necessary to simulate the whole fingertip using a 3D fingertip model based on medical imaging with correct anatomical structure and geometry. Results suggest that underlying anatomical structure and geometry, especially of the bone, has significant influence on the peak contact pressure as well as contact pressure distribution. Results have shown that the peak contact pressure varies over 20% between different fingertips, which explains the physiological difference of PDT and PPT.
Future work should investigate more fingertip geometries in order to further investigate influence of fingertip anthropometry and geometry of anatomical structure of the fingertip. Additionally subjective responses could be also evaluated, which would allow the evaluation of the values and their influence on the PDT and PPT.
REFERENCES
Aldien, Y., Welcome, D., Rakheja, S., Dong, R., Boileau, P.E. (2005), "Contact pressure distribution at hand– handle interface: role of hand forces and handle size", International Journal of Industrial Ergonomics, 35, pp. 267-286. Annett, J. (2002), "Subjective rating scales: science or art?", Ergonomics, 45, pp. 966-987. Clark, J.A., Cheng, J.C., Leung, K.S. (1996), "Mechanical properties of normal skin and hypertrophic scars",
Burns, 22, pp. 443-446. De Looze, M., Kuijt-Evers, L., Van Dieën, J. (2003), "Sitting comfort and discomfort and the relationships with objective measures", TERG Ergonomics, 46, pp. 985-997. Edwards, C., Marks, R. (1995), "Evaluation of biomechanical properties of human skin", Clinics in Dermatology,
13, pp. 375-380. Eksioglu, M. (2004), "Relative optimum grip span as a function of hand anthropometry", International Journal of Industrial Ergonomics, 34, pp. 1-12. Fransson-Hall, C., Kilbom, Å. (1993), "Sensitivity of the hand to surface pressure", Applied Ergonomics, 24, pp.
181-189. Goonetilleke, R.S., Eng, T.J. (1994), "Contact Area Effects on Discomfort", Proceedings of the Human Factors and Ergonomics Society Annual Meeting Proceedings of the Human Factors and Ergonomics Society Annual Meeting, 38, pp. 688-690. Harih, G., Dolšak, B. (2013), "Recommendations for tool-handle material choice based on finite element analysis",
Applied Ergonomics, 45, pp. 577-585. Kinchington, M., Ball, K., Naughton, G. (2012), "Relation between lower limb comfort and performance in elite footballers", Physical Therapy in Sport, 13, pp. 27-34. Kuijt-Evers, L.F., Groenesteijn, L., de Looze, M.P., Vink, P. (2004), "Identifying factors of comfort in using hand
tools", Applied Ergonomics, 35, pp. 453-458. Kuijt-Evers, L.F.M., Vink, P., de Looze, M.P. (2007), "Comfort predictors for different kinds of hand tools: Differences and similarities", International Journal of Industrial Ergonomics, 37, pp. 73-84. Moore, A., Wells, R., Ranney, D. (1991), "Quantifying exposure in occupational manual tasks with cumulative
trauma disorder potential", Ergonomics, 34, pp. 1433-1453. Mundermann, A., Stefanyshyn, D.J., Nigg, B.M. (2001), "Relationship between footwear comfort of shoe inserts and anthropometric and sensory factors", Medicine and Science in Sports and Exercise, 33, pp. 1939-1945. Pan, L., Zan, L., Foster, F.S. (1998), "Ultrasonic and viscoelastic properties of skin under transverse mechanical
stress in vitro", Ultrasound in Medicine and Biology, 24, pp. 995-1007. Radwin, R.G., Armstrong, T.J., Chaffin, D.B. (1987), "Power hand tool vibration effects on grip exertions", Ergonomics, 30, pp. 833-855. Rempel, D.M., Harrison, R.J., Barnhart, S. (1992), "Work-related cumulative trauma disorders of the upper
extremity", JAMA : the journal of the American Medical Association, 267, pp. 838-842. Riedel, S. (1995), "Consideration of grip and push forces for the assessment of vibration exposure", Central European Journal of Public Health, 3, pp. 139-141. Wan Abas, W.A. (1994), "Biaxial tension test of human skin in vivo", Bio-medical materials and engineering, 4, pp.
473-486.
Wilhelmi, B.J., Blackwell, S.J., Mancoll, J.S., Phillips, L.G. (1998), "Creep vs. stretch: a review of the viscoelastic properties of skin", Annals of plastic surgery, 41, pp. 215-219. Wongsriruksa, S., Howes, P., Conreen, M., Miodownik, M. (2012), "The use of physical property data to predict
the touch perception of materials", Materials & Design, 42, pp. 238-244. Wu, J.Z., Cutlip, R.G., Andrew, M.E., Dong, R.G. (2007), "Simultaneous determination of the nonlinear-elastic properties of skin and subcutaneous tissue in unconfined compression tests", Skin Research and Technology, 13, pp. 34-42. Wu, J.Z., Dong, R.G. (2005), "Analysis of the contact interactions between fingertips and objects with different
surface curvatures", Proceedings of the Institution of Mechanical Engineers, Part H: Journal of Engineering in Medicine Proceedings of the Institution of Mechanical Engineers, Part H: Journal of Engineering in Medicine, 219, pp. 89-103. Wu, J.Z., Dong, R.G., Rakheja, S., Schopper, A.W. (2002), "Simulation of mechanical responses of fingertip to dynamic loading", Medical Engineering & Physics, 24, pp. 253-264. Wu, J.Z., Welcome, D.E., Krajnak, K., Dong, R.G. (2007), "Finite element analysis of the penetrations of shear and
normal vibrations into the soft tissues in a fingertip", Medical Engineering & Physics, 29, pp. 718-727. Xiong, S., Goonetilleke, R., Jiang, Z. (2011), "Pressure thresholds of the human foot: measurement reliability and effects of stimulus characteristics", Ergonomics, 54, pp. 282-293. Yoshida, H., Tada, M., Mochimaru, M. (2011), "A study of frictional property of the human fingertip using three-
dimensional finite element analysis", Molecular & cellular biomechanics: MCB, 8, pp. 61-71. Zheng, Y.P., Mak, A.F. (1996), "An ultrasound indentation system for biomechanical properties assessment of soft tissues in-vivo", IEEE transactions on bio-medical engineering, 43, pp. 912-918.
LISTED IN THE AHFE DIGITAL BOOKSTORE CATALOGUE
Explore the complete digital volume
Advances in Applied Digital Human Modeling
Read this individual research paper free through the original publisher, or explore the full digital proceedings book.
ISBN 978-1-4951-2094-7
Explore this ISBN in the AHFE Bookstore ↗Listed in the July 2026 bookstore catalogue; search by ISBN to confirm current availability · Digital book purchase optional