Chi Yueyue, Yunfei Chen (2023). Optimization of Human Machine Interface Beauty Calculation System. In: Intelligent Human Systems Integration (IHSI 2023): Integrating People and Intelligent Systems. AHFE Open Access, vol. 69, pp. 769–777. https://doi.org/10.54941/ahfe1002900
Ngo et al. proposed 13 quantitative indicators to measure interface beauty in 2003, but the weight of each quantitative indicator was not determined, and the role of users' subjective emotional factors was not considered. Based on the calculation system of interface beauty proposed by Ngo et al., this paper uses factor analysis method to determine the correlation and weight of various quantitative indicators to simplify the calculation method of interface beauty, uses the analytic hierarchy process method to consider the user's subjective emotional factors, and proposes a new calculation of interface beauty to better guide the interface design optimization.
As a medium for users to obtain information and make decisions, the aesthe- tics of human-computer interface design can not only affect the accuracy and efficiency of information transmission, but also affect the visual perception and cognitive differences of users. Therefore, interface beauty evaluation has become an important part of information interface design research. The beauty of interface plays an important role in the usability and acceptabi- lity of interface. The beauty of interface in the interface design can improve the user’s acceptance of the interface, learning ability, understanding and learning efficiency. For example, Toh found that highly aesthetic interface layout can affect students’ learning motivation and stimulate students’ inte- rest in learning (Toh, 1998). Experiments conducted by Grabinger verified that concepts related to interface beauty, such as interface element organi- zation and visual design, are important indicators for evaluating interface readability and learnability (Grabinger, 1991).
At present, the evaluation and calculation of interface beauty mainly focus on two aspects: one is the qualitative evaluation of interface beauty, such as questionnaire design and expert interview to investigate the user’s subje- ctive perception of interface beauty, the other is the quantitative calculation of interface beauty. For the quantitative calculation of interface beauty, as early as 1933, Birkhoffs put forward the mathematical calculation formula for product beauty in the book beauty measurement, that is, product beauty is equal to product order divided by product complexity, that is, the author
thinks that the beauty of visual stimulation is directly proportional to the order of aesthetic object, and inversely proportional to the complexity (Bir- khoffs, 1933). However, its calculation method is too single to be questioned. After that, Beebe-center and Preatt divided the order degree into vertical and rotational symmetry order, equilibrium order, horizontal and vertical interse- ction order and dissatisfied form order, which improved Birkhoffs’ beauty degree calculation model and improved its reliability (Beebecenter et al., 1937). Then Tullis proposed four indexes to measure the beauty degree of interface: overall density, local density, grouping and layout complexity, and stress (Tullis, et al., 1983). These four indicators are used to calculate the interface beauty, and applied to two different formats of screen design, and the objective and accurate interface beauty evaluation data are obtained. On the basis of Tullis, Ngo proposed 13 calculation methods of interface beauty evaluation indexes, and improved the quantitative interface beauty evalua- tion calculation system (Ngo, et al., 2001). After that, Lei Zhou improved the evaluation index of interface layout beauty degree, comprehensively evalua- ted the interface beauty degree by using gray correlation method, simulated the design fine-tuning process of “small sample, high correlation”, and fur- ther improved the evaluation of interface beauty degree (Zhou et al., 2013). In addition, Peifeng Yuan used neural network and genetic algorithm to explore the relationship between interface features and aesthetic feeling, and extracted the guiding elements of interface design (Yuan, et al., 2001).
Based on the current research situation, this paper starts from the calcu- lation method of interface beauty index by Ngo (Ngo, et al., 2001), then uses the calculation system by Lei Zhou (Zhou et al., 2013), combined with statistical methods, considering the judgment of users’ subjective emotional needs, uses factor analysis and analytic hierarchy process to determine the weight of each dimension, and further optimizes the calculation of the ove- rall interface beauty to clarify the beauty of each dimension. It has certain guiding significance for the practice of interface design optimization.
METHODS
In 2003, Ngo proposed 13 quantitative indexes of interface beauty and ela- borated their calculation methods in detail, mainly including: measure of balance, Measure of equilibrium, measure of symmetry, measure of seque- nce, measure of cohesion, measure of opportunity, measure of proportion, Measure of simplicity, measure of density, measure of regularity, measure of economy, measure of homogeneity and measure of rhythm (Ngo, et al., 2001).
In this paper, the calculation of interface beauty indicators is based on the calculation method proposed by Ngo (Ngo, et al., 2001). Due to the limitation of homogeneity, it is not considered in the following research.
Lei Zhou conducted factor analysis on the 12 indicators, and reduced them into four dimensions (Beauty quantitative indicators), including Balance, Pro- portion, Simplicity and Coordination (Zhou et al., 2013). Each dimension contains a series of sub dimensions, as shown in Table 1. In the study of Ngo, the author assumed that the overall beauty degree of the interface is the ave- rage of 13 quantitative indicators of beauty degree, that is, each quantitative
Optimization of Human Machine Interface Beauty Calculation System 771
Table 1. Framework of interface beauty index (Zhou et al. 2013).
Table available in the original PDF paper.
Aesthetic indicators Sub aesthetic indicators Balance Balance Equilibrium Symmetry
Proportion Sequence Unity Cohesion Simplicity Simplicity Density Economy
Coordination Regularity Rhythm Proportion
index of beauty degree has equal weight in the overall beauty degree (Ngo, et al., 2001). In fact, according to the user’s personal preferences and needs, the weight of the 13 beauty quantitative indicators in the overall beauty is not the same, therefore it is necessary to determine the weight of each beauty quantitative indicator. Moreover, the above research still has the following limitations: the weight of the sub dimensions under the four dimensions has not been determined; the weight of the four dimensions does not consider the user’s subjective emotional needs and task needs.
Factor analysis is a statistical method to extract common factors from variable groups. Factor analysis can reveal the hidden representative factors in many variables, and classify the same essential variables into one factor, which can reduce the number of variables and determine the weight of each factor. The results of factor analysis are more objective and accurate. Factor analysis using SPSS software mainly includes the following steps: calculate KMO value and carry out spherical test (KMO > 0.5 means factor analy- sis can be carried out); calculate the eigenvalue, variance contribution and cumulative contribution of each factor after orthogonal rotation. Based on the research of Lei Zhou, this paper uses SPSS to conduct factor analysis on 12 beauty indicators under the four dimensions to determine the weight of each sub dimension in the four dimensions (Zhou et al., 2013).
Lei Zhou used factor analysis method to calculate the weight of the four dimensions in the overall beauty degree (Zhou et al., 2013). On the one hand, this method ensures the objectivity of data, on the other hand, it lacks the consideration of users’ subjective needs. Each index of interface beauty has different attraction and needs for different users, so it is necessary to determine the weight from the subjective perspective of users for the four dimensions of balance, proportion, simplicity and echo. AHP can be used to judge the importance of different beauty degree according to the user’s subjective, so as to determine the weight of each index. The application of
772 Chi and Chen
Figure 1: Interface design drawing. (Adapted from Andika W, 2021).Table 2. Results of factor analysis under balanced dimension.
AHP needs the following steps: establishing the hierarchical structure model; constructing the judgment matrix; single level ranking; total level ranking; consistency test.
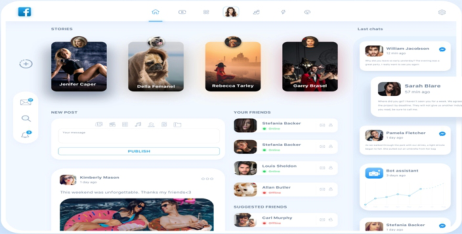
Experiments In this study, a total of 20 different interfaces were selected as samples. CAD was used to sketch the interface outline and interface element framework, and obtain the layout elements (coordinate values, length and width, etc.) to accurately obtain the parameters required for interface beauty calculation. At the same time, using Matlab based on the above beauty index calculation method to get the beauty indicators score of each sample (see Figure 1).
Balance dimension includes Balance, Equilibrium and Symmetry. The three beauty indexes of 20 samples were extracted and factor analysis was performed by SPSS. The results are shown in Table 2.
KMO = 0.621>0.5 means that factor analysis can be carried out. After principal component analysis, it is found that the cumulative contribution rate of total variance of factor 1 (Balance) is 75.97%.
Proportion dimension mainly includes Sequence, Unity and Cohesion. The three beauty indicators of 20 samples were extracted and factor analysis was performed by SPSS. The results are shown in Table 3.
Optimization of Human Machine Interface Beauty Calculation System 773
Table 4. Results of factor analysis under coordination dimension.
Table 6. Hierarchy model based on interface beauty.
Table available in the original PDF paper.
Overall objective The first level Interface overall beauty Balance (C1) Proportion (C2) Simplicity (C3) Coordination (C4)
KMO = 0.606>0.5 means that factor analysis can be carried out. After pri- ncipal component analysis, the cumulative contribution rate of total variance of factor 1 (Sequence) is 58.988%.
Coordination dimension includes Regularity, Rhythm and Proportion. The three beauty indicators of 20 samples were extracted and factor analysis was performed by SPSS. The results are shown in Table 4.
KMO = 0.606>0.5 means that factor analysis can be carried out. After principal component analysis, it is found that the cumulative contribution rate of total variance of factor 1 (Regularity) is 52.24%.
Simplicity dimension includes Simplicity, Intensity and Economy. The three beauty indicators of 20 samples were extracted and factor analysis was performed by SPSS. The results are shown in Table 5.
KMO = 0.698>0.5 means that factor analysis can be carried out. After principal component analysis, it is found that the cumulative contribution rate of total variance of factor 1 (Simplicity) is 69.794%.
The first step of AHP is establishing a hierarchical structure model. As shown in Table 6.
Due to the limitation of conditions, 30 masters of design department are selected as experts to interview and construct the judgment matrix, which is run by Matlab as shown in Table 7.
The results show that CR = 0.0487 < 0.1, which meets the consistency test, and the weight vectors of each index are [0.3362,0.1682,0.4288,0.0668].
Results
Combined with the results of factor analysis, the weight distribution of the four dimensions and their sub dimensions is shown in Table 8, 9, 10, 11, 12.
According to the weight shown in Table 8, 9, 10, 11, 12, the overall beauty of 20 sample interfaces is recalculated, and the results are compared as shown in Table 13.
Therefore, in the evaluation system of interface beauty, Balance and Sim- plicity account for the largest proportion, that is, compared with Proportion and Coordination, Balance and Simplicity have greater impact on the overall interface beauty. In addition, in the evaluation system of Balance, Proportion,
Optimization of Human Machine Interface Beauty Calculation System 775
Table 13. Comparison of interface beauty values of each sample before and after optimization of calcula- tion method.
Figure 2: Sample 9 of interface design drawing. (Adapted from John M, 2020).
Simplicity and Coordination, the sub dimensions that make the largest con- tribution are Balance, Sequence, Simplicity and Regularity. Taking sample 9 (see Figure 2) and sample 14 (see Figure 3) as examples, the left and right balance of sample 9 is less than that of sample 14, and the interface elements of sample 9 are more complex and large in number than that of sample 14. Therefore, the differences in balance and simplicity between the two samples can explain the differences in the overall beauty of the two samples. There- fore, in the future interface design work, we can focus on the above indicators to improve the interface design.
776 Chi and Chen
Figure 3: Sample 14 of interface design drawing. (Adapted from Kemonn, 2020).
CONCLUSION
Combined with the quantitative analysis method of factor analysis and the qualitative analysis method of analytic hierarchy process, this paper analyses the indicators system of interface beauty degree, and determines the weight of four systems in the overall interface beauty degree, such as Balance, Pro- portion, Simplicity and Coordination. At the same time, it also determines the quantitative index of beauty degree which has great contribution in each system, and optimizes the overall interface beauty degree evaluation method. This study also has some limitations. Firstly, the larger sample in factor analy- sis is more conducive to the accuracy of the analysis results. Secondly, in AHP, due to the constraints of conditions, the focus group composed of experts and users should judge and sort the interface beauty system, so as to form a more accurate judgment matrix. In the future, we will collect more samples and optimize the composition of the analytic hierarchy process (AHP) group to further improve the quantitative system of interface beauty indicators, and clarify the weight and priority of each of the indicators to guide the interface design optimization more accurately.
ACKNOWLEDGMENT
The authors would like to acknowledge Contribution of Lei Zhou and Ngo et al. to the calculation of interface beauty.
REFERENCES
Andika Wiraputra. (2020). Dribbble, [online]. Available at: https://dribbble.com/ Wiraputra [Accessed 22 November 2020]. Beebe-Center JG,PrattCC. (1937). A test of Birkhoffs aesthetic measure. The Journal
of General Psycholog, 17(2). pp. 339–353. C.W.Valentine. (1991). Experimental Psychology Beauty. Peking University Press. D.C.L Ngo. and J.G. Byrne. (2001). Application of an aesthetic evaluation model to data entry screens. Computers in Human Behavior, 17(2). pp. 149–185. John Mevis. (2020). Dribbble, [online]. Available at: https://dribbble.com/johnmevis
[Accessed 22 November 2020]. Kemonn. (2020). Dribbble, [online]. Available at: https://dribbble.com/kemonn [Accessed 22 November 2020].
Optimization of Human Machine Interface Beauty Calculation System 777
Lei Zhou., Chenqi Xue and Wencheng Tang. (2013). Beauty evaluation method of interface element layout design. Journal of Computer Aided Design and Graphics, 25(5). pp. 758–766. Peifeng Yuan., Rui Chen and Tao Lin. (2015). Modeling software interface aesthetics
based on genetic algorithm and neural network, 52(2). pp. 269–274. R.S. Grabinger. (1991). Computer screen designs: viewer judgements, Educational Technology Research and Development, 41(2). pp. 35–73. S.C. Toh. (1998). Cognitive and motivational effects of two multimedia simulation
presentation modes on science learning. Ph.D Dissertation, University of Science Malaysia. Tullis T S. (1983). The formatting of alphanumeric displays: A review and analysis.
Human Factors Version 2, 25(6). pp. 657–682.
LISTED IN THE AHFE DIGITAL BOOKSTORE CATALOGUE
Explore the complete digital volume
Intelligent Human Systems Integration (IHSI 2023): Integrating People and Intelligent Systems
Read this individual research paper free through the original publisher, or explore the full digital proceedings book.
ISBN 978-1-958651-45-2
Explore this ISBN in the AHFE Bookstore ↗Listed in the July 2026 bookstore catalogue; search by ISBN to confirm current availability · Digital book purchase optional