Dominik Raeck, Timo Pech, Klaus Mößner (2022). Trajectory forecast for cyclists in cooperative interactions with automated vehicles. In: Human Interaction & Emerging Technologies (IHIET 2022): Artificial Intelligence & Future Applications. AHFE Open Access, vol. 68, pp. 588–596. https://doi.org/10.54941/ahfe1002781
In shared traffic spaces like intersections cooperative behavior can be crucial for safe and comfortable interactions of traffic participants. In mixed urban traffic, VRUs like cyclists need special attention in interactions with autonomous vehicles. The goal of this work is to provide the automated vehicle with trajectory information of the cyclist, to be able to take the behavioral intention of the cyclist into account and make a cooperative reaction possible. This is achieved through a trajectory forecast of the cyclist, which allows for the possibility to estimate his course of movement within a limited time frame. Multiple algorithms for a trajectory forecast have been implemented, compared and evaluated. The results of this research work showed that a CNN can be used to integrate data of various types in order to accomplish a trajectory forecast for cyclists.
MOTIVATION In highly automated traffic not only the communication and interaction between vehicles among themselves, but also with vulnerable road users (VRU) like pedestrians and cyclists is crucial for the safety and comfort of all traffic participants (Ackermann, Trommler, & Krems, 2021). While con- nected vehicles can use technical solutions like ITS-G5 and ETSI standardized messages like cooperative awareness (CAM) (ITS – Vehicular Communicati- ons) or maneuver coordination message (MCM) (ITS – Vehicular Communi- cations) to communicate with each other the possibilities to get information about the VRU’s behavior are limited. One approach is to utilize the onbo- ard sensors of an automated car to detect VRUs. Though this might not be possible if a VRU is concealed by buildings in narrow intersections, trucks or other cars. Instead, kinematic data can be acquired directly from the bicycle with mobile sensors like GPS, accelerometers or gyroscopes that are already included in most smartphones.
This paper proposes an algorithm to combine different types of data in highly connected and automated traffic to achieve an accurate trajectory fore- cast for cyclists. The implemented model utilizes kinematic data alongside
Trajectory Forecast for Cyclists in Cooperative Interactions With Automated Vehicles 589
infrastructural information to estimate the trajectory of cyclists as a behavi- oral indicator that can later be used by automated vehicles to accomplish a safe and comfortable traffic flow.
RELATED WORK
In the research field of trajectory predictions two general types of approaches can be found, physical models and machine learning models (Zernetsch, Koh- nen, Goldhammer, Doll, & Sick) as well as combinations of these variants. While the first mentioned approach focuses on the development of suita- ble movement models for bicycles, the latter is in most cases utilizing neural networks to approximate or plan a trajectory. There is still only little resea- rch on trajectory prediction for bicycles, but a large amount for cars. Because of this it is sensible to make use of the available knowledge and transfer the algorithms for car trajectory planning and forecasting onto cyclists. In this sense Polack et al. (Polack, Altche, d’Andrea-Novel, & La Fortelle) proposed and compared a kinematic model for bicycles based on a vehicle’s movement model. In comparison though to a neural network made for cyclists’ tra- jectory prediction these physical approaches usually yield a lower accuracy (Zernetsch, Kohnen, Goldhammer, Doll, & Sick). The biggest advantage of using a machine learning algorithm in this use case is the fact that it can incor- porate data of all types to improve the estimation or planning of a trajectory. In an interaction situation between cyclists and other vehicles the trajectory of the cyclist is not only influenced by the kinematic parameter of the bicycle but also by the behavior of surrounding road users. In the work of Huang (Huang) and Ju et al. (Ju, Wang, Long, Zhang, & Chang) a neural network- based algorithm was proposed, which is interaction-aware and capable of predicting conflict avoidance behavior in traffic. Another influencing factor of the cyclists’ trajectory is the surrounding infrastructure itself. How a cyclist acts at an intersection can for example depend on the layout of road borders and lane markings, but also on the overall space that each traffic attendant has available for possible maneuvers. Sample situations are investigated in (Ackermann, Trommler, & Krems, 2021). “Djuric et al. (Djuric, et al.) sho- wed an approach of including rasterized maps of intersections into a motion prediction model.
In this paper a neural network will be implemented, which combines and builds up on the aforementioned approaches. The proposed algorithm is not only using the bicycles kinematics, but will be able to predict cyclists’ traje- ctories with awareness of surrounding vehicles movements and incorporate infrastructural data through the use of area maps.
ALGORITHM Model Implementaion
As mentioned before the goal of this work is to implement a trajectory pre- diction algorithm for cyclists in cooperative traffic scenarios, which means calculating a time discrete forecast of the future position and velocity of the cyclist. This is achieved by utilizing neural networks (NN), an approach
that can handle most different types of input data. Since there are multiple variations of NNs, three models have been comparatively implemented and investigated for their possibilities, strengths and weaknesses. The concept of the used architectures, a multi-layer perceptron (MLP), a long-short- term-memory-NN (LSTM) and a convoluted neural network (CNN) will be described below.
The MLP (Kiyoshi Kawaguchi, 2000) is the most simplistic variant of the mentioned NNs and suited to test and validate the general training algorithm as well as generating a baseline accuracy for the trajectory forecasts.
The Input of the MLP consists of a time series of the cyclists’ position coor- dinates. In advance all available data has to be split in sequences of consistent temporal length. The optimal length of those sequences was determined expe- rimentally and is part of the evaluation (see Ch. Evaluation). The output of the model are multiple 2D-position coordinates of the cyclist in 0.5 s intervals.
The model architecture itself consist of one input layer, three fully con- nected layers (dense layers) and one output layer with a relu-function as activation function for the dense layers. Despite its simple structure the MLP is already capable of predicting the future positions of a cyclist, although with a limited accuracy.
Using a MLP to process time series data, the data must be given simul- taneously, in contrary the LSTM was especially developed by Hochreiter & Schmidhuber (Hochreiter & Schmidhuber, 1997) to address features in time series data. The aforementioned MLP approach also only considered the position of the cyclist and the movement of all other surrounding vehicles was ignored. This way the interaction aspect of the traffic scenario cannot be incorporated. To allow an interaction-aware trajectory forecast a specific LSTM was used, which is capable of including other road users within a given radius into the calculation. As a basis the TrajNet++ framework (Kothari, Kreiss, & Alahi) was used. A LSTM that was originally designed to predict movements of pedestrians in crowded areas and that focuses on the coopera- tion and interaction of the individual attendants. This model was adapted for the given use case. The classification of possible interactions, which is based on parameters like the distance between road users, the movement direction and the field of view have been adjusted to match the higher possible velo- city and maneuver spaces of cyclists and cars at an intersection. The input of the model includes time series of position coordinates of the bicycle and all possibly interacting vehicles in its surrounding. The output has been kept the same as in the MLP, the predicted position coordinates of the cyclist.
The evaluation and tests of the LSTM showed the limits of such a model in this use case. Tight corners and fast turning of the cyclist cannot be estimated accurately enough. The reason for that is the high mobility of a bicycle, which allows very dynamic and sudden maneuvers. To increase the prediction accu- racy in those situations infrastructural data should be incorporated in the model’s input. Knowledge about street borders and lane markings can help limiting the cyclist’s possible space of movement. The georeferenced infrastru- cture data is extracted from publicly available maps. A CNN is well suited for this type of input data, as it can process the maps directly as images (Sandler, Howard, Zhu, Zhmoginov, & Chen).
Trajectory Forecast for Cyclists in Cooperative Interactions With Automated Vehicles 591
Between the described model architectures, the CNN offers the most pos- sibilities of integrating various data types. The input is scalable and could in future work be extended by additional parameters. The pre-processing and fusion of all given data is a central part of training such a model and is described in more detail below.
Datasets For the training of the described models three public datasets were used. The “ApolloScape Trajectories” dataset (Ma, et al., 2019), the “Lankershim bou- levard dataset” from the NGSIM project (Coifman & Li, 2017) and the InD dataset (Bock, et al.). All of them include recordings of urban intersections featuring cars, cyclists and pedestrians. The datasets contain position coordi- nates, velocity, heading and corresponding labels of all road users. The InD Dataset also includes drone images of all recorded scenarios.
The large-scale ApolloScape dataset was used to design and validate a workflow for extracting, structuring and pre-processing data, as well as a first training. The NGSIM dataset would later be used to develop a method to incorporate georeferenced infrastructural data into the training procedure. The InD dataset has the most recordings of cyclists’ interactions and was used for statistical and exemplary evaluation.
DATA AUGMENTATION The advantage of a CNN is the capability of processing images fast. In this use case these are satellite, drone images or abstract maps of intersections. Furthermore, the position coordinates and kinematic data of the cyclists and all surrounding vehicles can be included. For this an algorithm is needed to merge those data types and provide it to the CNN as one complete image. The process of this data augmentation will be outlined step by step.
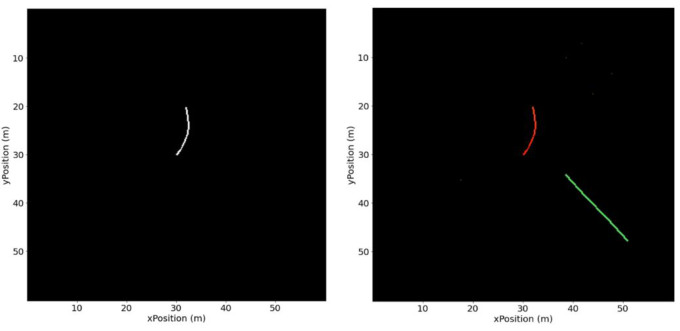
First the cyclist’s course of position coordinates in the past few seconds is drawn into an image true to scale (see fig. 1 left). The size of the image must be consistent and depends on the chosen input layer of the CNN.
The previous positions of all surrounding vehicles are also added to the image (see fig. 1 right). The chosen grayscale value can distinctively separate the types of vehicles from each other.
The kinematic data (here velocity and heading) of the road users are tran- sformed to a scale of 0 - 255 and can this way be added to the color channels of the image. For this the corresponding position coordinates will be displa- yed in the calculated color values. The scaling could result in quantization errors, so the scaling must be adapted to the respective situation. Even if this representation is hardly interpretable for a human, the image now contains all interesting vehicle data and can be read by a CNN model.
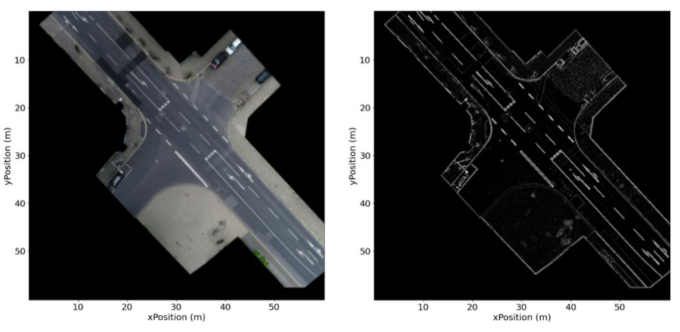
The last step is the incorporation of georeferenced infrastructural data into the created image. The basis for this can be birds eye view recordings of an intersection (see fig. 2 left) or satellite images. Since not all image information is relevant here and the color channels were already used to encode vehicle data, a pre-processing of the recording is necessary. Firstly, the image will be transformed to grey-scale and then an edge detection is done (see fig. 2 right).
Figure 1: Cyclist’s position (left), cyclist’s and car’s position with kinematic data encoded as color (right) over 3 seconds.Figure 2: Georeferenced drone image from InD dataset (Bock, et al.) (left), edge detection image (right).
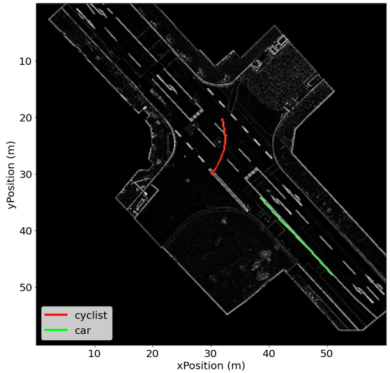
This way only relevant features of the street, like the marking and borders will be highlighted. The resulting image will now be merged with the created image of the previous step (see fig. 3). This is the final input image for the CNN. The process will be repeated for the following time steps to create an extensive training data set of multiple thousand images from the given traffic monitoring data.
EVALUATION Error Metric
To assess the prediction accuracy as well as the performance of the three implemented models (see Ch. Algorithm) a statistic evaluation has been done. For that an established error metric has been used (Twomey, 1997), which allows comparing the models with each other and also with similar already
Trajectory Forecast for Cyclists in Cooperative Interactions With Automated Vehicles 593
Figure 3: Complete input image: with cyclist’s trajectory in the middle (red) and car’s trajectory below (green), both fitted on the map.
existing models. With the following formula (see fig. 1) the average displace- ment error (short ADE) can be calculated, a metric to show the deviation of the predicted cyclists’ trajectories from their actual driving path.
Equation reproduced from the original PDF.
dy =
Equation reproduced from the original PDF.
ADE =
dx + dy/2n (3) To determine the ADE, the deviation of a predicted point from the ground truth is calculated in lateral (dx) as well as longitudinal (dy) direction. Both values themselves can already give insight of the model’s accuracy in specific situations. On the one hand predictions of straight driving can be evalua- ted through the longitudinal error and turning through the lateral error. The combined deviation of the forecasted driving path is then calculated by the mean of those two values.
Evaluation of Different Input Data As test data recordings of an intersection has been used, which were comple- tely excluded from the training. This way the scenario is completely new to the models and allows for a validation of the transferability of the algorithm.
The main focus of the evaluation is the comparison of different input data for a trajectory forecast and alongside that the comparison of the three used neural network architectures – the MLP, LSTM and CNN.
In this table (see table 1) the ADE of the predicted trajectories for the cycli- sts are listed. To allow for comparability a constant prediction time frame of 3 seconds has been chosen for all models.
Table 1. Results of different neural network architectures.
Table 2. Comparison of CNN results with and without infrastructure information.
Table available in the original PDF paper.
CNN with infrastructural data CNN without infrastructural data ADE [m] 0.84 1.08 dx [m] 0.45 0.59 dy [m] 1.23 1.57
The MLP has the biggest average displacement error here of 1.9 m. Given the minimalistic model structure and the sparse input (only cyclists position coordinates) there was no high prediction accuracy to be expected here. How- ever, the longitudinal error (dx) of the MLP shows, that a forecast of straight movements is already possible with this rather simple algorithm.
The LSTM reached a significantly lower average error of 1.24 m. This is for once due to the in general better suitability of the LSTM for time series predictions but also through the incorporation of trajectories of all other vehicles in the surroundings of the cyclist (see Ch. Algorithm). This allows the LSTM to learn interaction behavior between the road users and with that to improve accuracy of the trajectory forecasts.
The best performing model in this comparison is the CNN with an ADE of 0.84 m. This CNN does not only yield the advantage of the LSTM to consider other vehicles in the prediction, but it also includes infrastructural data of the area through the model’s input.
To further prove the positive influence of the georeferenced infrastructural data on the trajectory forecasts, a CNN has been trained, which does specifi- cally not use any this data as input. All other model and training parameters have been kept constant.
The ADE of the compared model variations listed above (see table 2) shows a higher accuracy for the CNN that uses infrastructural data. This proves that the inclusion of this information can enhance predicted cyclists’ trajectories, which can especially be seen in the lateral error of the prediction (dy). That means the turning of the cyclist can be approximated better with the described CNN algorithm.
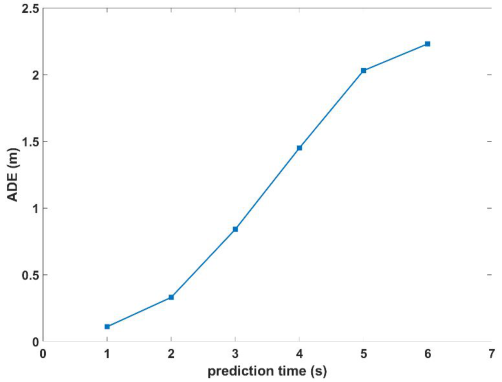
Evaluation of Prediction Time Horizons The accuracy of trajectory forecasts highly depends on the predefined time frame that is supposed to be predicted. The correct value must be chosen with regards to the use case and the desired minimum accuracy. As mentio- ned before all shown results have been done using a prediction time frame of 3 seconds. To evaluate the performance of the CNN with different time
Trajectory Forecast for Cyclists in Cooperative Interactions With Automated Vehicles 595
Figure 4: ADE in relation to the prediction time.
horizons, 6 variations of the model have been trained using values from 1 seconds to 6 seconds respectively.
Comparing the ADE of the trained models with different prediction time horizons shows, that the error of the trajectory forecasts goes up exponen- tially with increasing time frames (see Fig. 4). While the models reach an acceptable accuracy for predicting cyclists’ trajectories for up to 4 seconds, it is assumed the variants above 4 seconds produce an error that is too high to be used in a practical application.
In future work possibilities of increasing the forecast time frame will be further investigated. The biggest advantage of the used neural network is the fact that additional types of data, like for example behavioral or psycholo- gical parameters can be incorporated without having to create mathematical descriptions or models in order to allow for an even more precise and long-term trajectory prediction.
CONCLUSION
Neural networks can directly take the autonomous vehicle’s trajectory into account to forecast a collision free trajectory of cyclists in interaction situa- tions. This paper showed especially CNN as a potent algorithm for combi- ning infrastructural data alongside kinematic data. The results showed that infrastructural information increase the prediction accuracy significantly. In upcoming works, the implemented model will be tested in real time applicati- ons and in varying traffic scenarios to further investigate its adaptability and general performance.
ACKNOWLEDGMENT
This project was funded within the Priority Program 1835 “Cooperative Interacting Cars” of the German Science Foundation DFG.
REFERENCES
Ackermann, C., Trommler, D., & Krems, J. (2021). Exploring Cyclist-Vehicle Interaction – Results from a Naturalistic Cycling Study. In N. L. Black, W. P. Neumann, & I. Noy, Proceedings of the 21st Congress of the International Ergonomics Association (IEA 2021) (Vol. 221, pp. 533–540). Cham: Springer International Publishing. Bock, J., Krajewski, R., Moers, T., Runde, S., Vater, L., & Eckstein, L. (n.d.). The
inD Dataset: A Drone Dataset of Naturalistic Road User Trajectories at German Intersections. IEEE. Coifman, B., & Li, L. (2017). A critical evaluation of the Next Generation Simulation (NGSIM) vehicle trajectory dataset. Transportation Research Part B: Methodological, 105, pp. 362–377. Djuric, N., Radosavljevic, V., Cui, H., Nguyen, T., Chou, F.-C., Lin, T.-H., Schneider,
J. (n.d.). Uncertainty-aware Short-term Motion Prediction of Traffic Actors for Autonomous Driving. IEEE. Hochreiter, S., & Schmidhuber, J. (1997). Long short-term memory. Neural computation, 9(8), pp. 1735–1780. Huang, L. (n.d.). A neural network based modeling and simulation of bicycle conflict
avoidance behaviors at non-signalized intersections. IEEE. Ju, C., Wang, Z., Long, C., Zhang, X., & Chang, D. E. (n.d.). Interaction-aware Kalman Neural Networks for Trajectory Prediction. IEEE. Kiyoshi Kawaguchi. (2000). A multithreaded software model for backpropagation
neural network applications. The University of Texas at El Paso. Kothari, P., Kreiss, S., & Alahi, A. (n.d.). Human Trajectory Forecasting in Crowds: A Deep Learning Perspective. Ma, Y., Zhu, X., Zhang, S., Yang, R., Wang, W., & Manocha, D. (2019). TrafficPre-
dict: Trajectory Prediction for Heterogeneous Traffic-Agents. Proceedings of the AAAI Conference on Artificial Intelligence, 33, pp. 6120–6127. Polack, P., Altche, F., d’Andrea-Novel, B., & La Fortelle, A. (n.d.). The kinematic bicycle model: A consistent model for planning feasible trajectories for autonomous vehicles? IEEE. Sandler, M., Howard, A., Zhu, M., Zhmoginov, A., & Chen, L.-C. (n.d.). Mobile-
NetV2: Inverted Residuals and Linear Bottlenecks. IEEE. Twomey, J. M., & Smith, A. E. (1997). Validation and verification. Artificial neural networks for civil engineers: Fundamentals and applications, 44–64. Vehicular Communications; Basic Set of Applications; Part 2: Specification of
Cooperative Awareness Basic Service. (n.d.). (302 637-2 V1.3.1 (2014)). Vehicular Communications; Informative report for the Maneuver Coordination Service. (n.d.). (ETSI TR 103 578 draft). Zernetsch, S., Kohnen, S., Goldhammer, M., Doll, K., & Sick, B. (n.d.). Trajectory
prediction of cyclists using a physical model and an artificial neural network. IEEE.
Read this individual research paper free through the original publisher, or explore the full digital proceedings book.
ISBN 978-1-958651-44-5
Explore this ISBN in the AHFE Bookstore ↗Listed in the July 2026 bookstore catalogue; search by ISBN to confirm current availability · Digital book purchase optional