Federico Manuri, Andrea Sanna, Matteo Bosco, Francesco De Pace (2022). A Comparison of Three Different NeuroTag Visualization Media: Brain Visual Stimuli by Monitor, Augmented and Virtual Reality Devices. In: Human Interaction & Emerging Technologies (IHIET 2022): Artificial Intelligence & Future Applications. AHFE Open Access, vol. 68, pp. 150–158. https://doi.org/10.54941/ahfe1002726
Brain Computer Interfaces (BCIs) proved to overcome some limitations of other input modes (e.g., gestures, voice, haptic, etc.). BCIs are able to detect the brain activity, thus identifying searched patterns. When a specific brain activity is detected, a well-defined action can be triggered, thus implementing a human-machine interaction paradigm. BCIs can be used in different domains ranging from industry to services for impaired people.Small and ergonomics devices, such as the NextMind (https://www.next-mind.com/) are the result of recent technological advances; these new devices allow to support users in everyday life, thus bringing the design of BCIs into a new dimension well beyond the scope of laboratory tests.In particular, The NextMind is a device able to detect and classify signals coming from the visual cortex. Visual stimuli are blinking/flickering textures that are associated with objects called NeuroTags (see Figure 1). An event is triggered when the user focuses on the same NeuroTag for a given amount of time. This paradigm can replace selection methods based on keyboard, mouse, gesture, touch, voice, and gaze.This paper compares and assesses three different interfaces that share the same input device (the NextMind) to detect the brain activity and differ in the medium to convey to the user the visual stimuli. A monitor, an Augmented Reality (AR) device (the Microsoft HoloLens), and a Virtual Reality (VR) device (the Oculus Rift) are considered. The aim of this work is to assess any difference in the three visualization media when displaying NeuroTags. User tests have been performed in order to evaluate the usability of the three different solutions. After each test, users were asked for filling out the System Usability Scale (SUS) questionnaire and the SUS scores have been used for statistical analysis.
Brain-Computer Interfaces (BCIs) provide an alternative input mode in order to bridge the gap between humans and machines. A BCI can be organized in five different stages: signal acquisition, signal processing, feature extraction, feature classification, and output (Nicolas-Alonso and Gomez-Gil, 2012). Signals generated from the electroencephalographic activity are gathered, processed, analyzed, and classified to interact with devices/machines without the involvement of peripheral nerves and muscles (Mridha et al. 2021).
A Comparison of Three Different NeuroTag Visualization Media: Brain Visual Stimuli 151
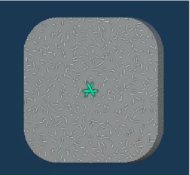
Figure 1: An example of NeuroTag and its flickering texture.
Although BCIs might be a disruptive solution to overcome interaction issues in a large spectrum of disciplines, the size of BCI devices and human factors often limited the use of this type of solution to laboratory studies. On the other hand, a new generation of devices, small and ergonomics, such as the NextMind1 can support users in everyday life, thus bringing the design of BCIs into a new dimension well beyond the scope of laboratory tests.
The NextMind is a device able to detect and classify signals coming from the visual cortex. Visual stimuli are blinking/flickering textures, which are associated with objects called NeuroTags (see Figure 1). An event is triggered when the user focuses on the same NeuroTag for a given amount of time. This paradigm can replace selection methods based on keyboard, mouse, gesture, touch, voice, and gaze.
The NextMind connects to other devices (e.g., the Microsoft HoloLens or the Oculus Rift) via Bluetooth. Eight electrodes have to be in contact with the scalp over the inion. Each NeuroTag represents a unique visual “signa- ture” that is managed by the NeuroManager. The NeuroManager enables the communication between NeuroTags and the NextMind engine, which processes signals gathered from the electrodes. Three green segments are associated with each NeuroTag in the default visualization; when the user focuses on a NeuroTag and the corresponding visual signature is recognized, the three green segments form a triangle, thus triggering the corresponding action associated with that NeuroTag.
The potential of BCIs based on the NextMind has been already investiga- ted; for instance, a comparison, in terms of usability and workload, between brain and gesture selection modes shows the advantages of the BCI (Da Col et al. 2022). This paper aims to further investigate design issues related to BCIs based on the NextMind device. In particular, different configurations in terms of NeuroTag size and distance have been analyzed in order to find an optimal tradeoff between interface robustness (false selections should be avoi- ded) and selection speed (NeuroTag sequences should be selected as fast as possible). Moreover, three different visualization media to convey to the user the visual stimuli have been considered: a monitor, an Augmented Reality (AR) device (e.g., the Microsoft HoloLens), and a Virtual Reality (VR) device (e.g., the Oculus Rift). Preliminary user tests have been carried out to assess any difference in the three visualizations media when displaying NeuroTags. User tests have been performed in order to evaluate the usability of the three 1https://www.next-mind.com/
solutions. After each test that required users to select well-defined NeuroTag sequences, the System Usability Scale (SUS) questionnaire (Brooke, 1996) was filled in for each visualization media, and the SUS scores were computed for statistical analysis. Also, completion times and false selections have been collected. User tests outline that the best tradeoff between robustness and selection speed is obtained by medium-size and medium-spaced NeuroTags; on the other hand, monitor visualization outperforms the AR solution, whe- reas it is not possible to identify statistically significant differences between monitor-VR and AR-VR.
The paper is organized as follows: Section 2 presents the design and develo- pment of the system; Section 3 describes the tests performed with two groups of people, and the results are discussed in the detail. Section 4 presents the conclusion and possible future works.
MATERIALS AND METHODS
This section presents the design and development of a system to effectively compare the usage of NextMind-based BCIs displaying NeuroTags on moni- tors, AR, and VR devices. The aims of the proposed system are to define design rules that may help in the development of UI for the NextMind device and to explore user preferences for three different visualization media: AR, VR, and monitor.
Hardware The design and development of Human-Computer Interfaces (HCIs) is a com- plex task that involves the user experience and knowledge, the task at hand, and the hardware interface. Among the BCIs available on the market, the NextMind headset is an affordable and ergonomic device, which can be easily and comfortably used together with AR and VR headsets. Moreover, the NextMind sensor uses non-invasive EEG technology to detect neural acti- vity from the visual cortex, and machine learning algorithms translate them into digital commands in real-time: more specifically, the NextMind relies on the visualization of NeuroTags, which represent unique visual signatures that will generate a response in the user’s brain. Mapping each NeuroTag to diffe- rent actions available in an application, it is possible to easily deploy a UI that enables user selections through active BCI interactions. Even if the NextMind has been deployed in different tasks and research domains, effective guide- lines pertaining to the dimension and positioning of the NeuroTags in the UI are not available, nor a comparative study exploring which visualization media has to be preferred is known in the literature. For the monitor confi- guration, a 24” 16:9 Full HD display has been used to show the UI. Among the available AR headsets, the Microsoft HoloLens 2 was chosen due to its hardware specifications, which make it one of the most valuable AR weara- ble devices on the market. Even if it may be difficult to wear both hardware together, parameters such as field of view, resolution, and holographic den- sity are crucial to effectively display the NeuroTags. Finally, the Meta Oculus Rift VR Headset has been chosen since it provides good hardware specificati- ons paired with a good level of comfort when combined with the NextMind:
A Comparison of Three Different NeuroTag Visualization Media: Brain Visual Stimuli 153
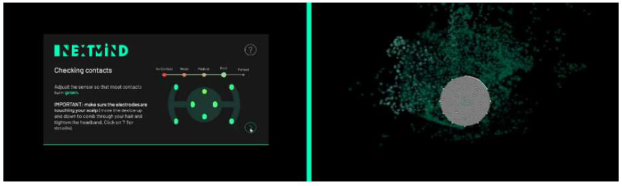
Figure 2: The two crucial steps to be performed when calibrating the NextMind: che- cking contacts (on the left) and performing a focus session to calibrate the device (on the right).
compared to other VR headsets, the Oculus Rift wearing band’s shape allows the user to easily position the NextMind in the right place.
Software The NextMind Dev Kit provides a Unity 3D plugin to easily deploy BCI solu- tions. Thus, a Unity application has been designed to evaluate the usability of the BCI interface with different visualization media. The application provides the same UI on each device, whereas different code has been deployed with respect to the monitor solution to properly handle the objects’ positions and dimensions in the AR and VR environments. The Steam VR Unity plugin has been used to deploy the VR solution, whereas the Mixed Reality Toolkit was necessary to deploy the AR one.
The User Interface The main menu of the proposed application lets the user choose among three options: calibrating the NextMind, executing the performance task, or execu- ting the appearance task. The calibration button enables the user to perform the calibration wizard provided by NextMind, which requires performing two crucial steps: verifying the headset positioning to maximize the EEG sen- sors’ capability (Figure 2, left); performing a focus session on twelve different NeuroTags to effectively calibrate the device (Figure 2, right).
The application consists of two different tasks, the appearance task, and the performance task. The appearance task has been designed to let the user explore among different NeuroTag textures and different selection feedbacks. Different kinds of NeuroTag textures may improve (or decrease) the user’s capability to effectively perform selections; different graphical effects for the activation feedback may improve (or decrease) the user’s understanding of the system status.
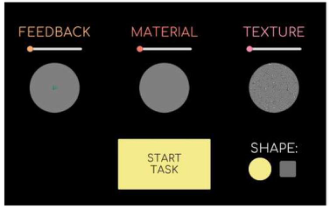
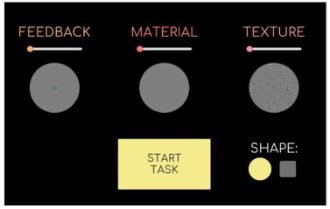
Figure 3 shows the configuration panel for the appearance task. Through the sliders, the user may change among three feedback effects, three different levels of transparency for the NeuroTag material, three textures, and two NeuroTag shapes.
Figure 4 shows the available customizations for the NeuroTag appearance: the feedback effects include a green triangle at the center of the NeuroTag (the system default), a green aura around the NeuroTag, and a green charge bar
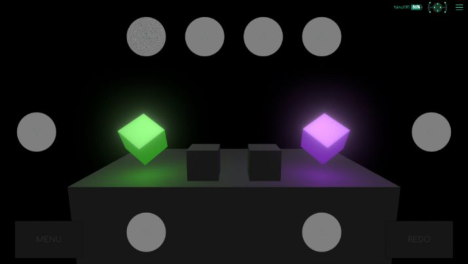
Figure 3: The configuration panel for the appearance task.Figure 4: The available customizations for the NeuroTag appearance provided by the system.Figure 5: The appearance task.
animated on the NeuroTag perimeter; the available textures include lines (the system default), circles, and a grid; circles (the system default) and rounded squares were considered as possible shapes. Figure 5 shows the appearance task. Four different cubes are shown to the user. Activating the NeuroTag upon a cube, the cube itself is activated, moving it upwards, coloring it, and displaying another NeuroTag under the cube, which allows the user to change the cube’s color. The two NeuroTags at the sides of the interface allow the user to rotate left or right the active cubes.
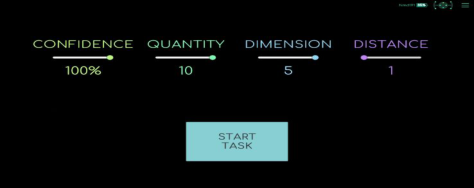
The performance task has been designed to let the user explore different NeuroTag sizes and places: these parameters may improve (or decrease) the user’s capability to effectively perform selections and may also affect the num- ber of false positives, which are wrong NeuroTag selections with respect to the user intentions. The task consists in dialing a sequence of numbers displayed at the bottom of the screen, with each number corresponding to a NeuroTag. Figure 6 shows the configuration panel for the performance task. The first slider allows the user to change the confidence threshold value to be used to select a NeuroTag: lowering this value may improve performances at
A Comparison of Three Different NeuroTag Visualization Media: Brain Visual Stimuli 155
Figure 6: The performance task configuration panel.
the expense of robustness, especially in terms of false positive activations. The second slider allows the user to change the number of NeuroTags available on the screen at the same time: the NextMind supports up to ten NeuroTags without robustness loss, however, it should be relevant to understand if the number of NeuroTags visible on the screen influence the user’s capability to correctly activate the desired NeuroTag. The third slider influences the size of the NeuroTag. NextMind’s best practices suggest that an optimal NeuroTag should span about 4.3 degrees of vision: on a 24" 1080p screen, 60cm away, like the one adopted for the monitor configuration, the NeuroTag should cover a circle with a diameter of 166px. However, since the best practices suggest that larger or differently shaped surfaces should work just as well, or even better, it was relevant to evaluate the impact of the NeuroTag size on the user performance. The five available dimensions span from a zoom value of x0,87 to a zoom value of x1,23. The last slider allows the user to explore different distances among the buttons, from a minimum distance among the NeuroTags to a maximum distance in the available field of view.
TESTS The system described in the previous section consists of a high number of customizable parameters; considering the need to test these combinations on three different hardware, completing all the tests may require a lot of time. In order to focus our attention on the combination of parameters that would affect the most user performances, the first round of tests involved a group of experts, represented by 3 post-doc researchers in the fields of UI, AR, and VR.
Experts Evaluation After successfully calibrating the NextMind, the experts were asked for experimenting with the two available tasks trying out as much parameters combinations as possible on each device. Concerning the appearance task, the users were unanimous in asserting that the transparency value affected negatively the NeuroTag activation rate: transparency affects the object con- trast, making it less visible and thus increasing the false-negative rate (which represents the system not responding to the user’s attempts to activate a Neu- roTag). The first available texture, which is the default one, was considered the most visible on each interface; since the usage of custom textures requi- res customizing the calibration procedure, the experts’ feedback was valuable
to opt for the default texture for the calibration and the performance task. Concerning the feedback parameter, the experts had a slight preference for the first option, but the green perimeter around the NeuroTag was also welco- med. Thus, it was decided to keep the default feedback for the performance task and to let the user experiment with all of them in the appearance task. After experiencing the performance task, the experts suggested focusing on how much the NeuroTag distance affected the false-positive rate, thus, it was necessary to keep the confidence value at 100%. On the other hand, each expert preferred a different visualization media, thus emphasizing the need to further evaluate the three proposed alternatives.
Usability Evaluation After consulting the experts, the system was evaluated by a group of twe- lve students from the engineering faculty, with ages ranging between 20 a 30. The group was heterogeneous in terms of previous experience with AR and VR devices and included both males and females. Each tester performed the two tasks with the three visualizations media, changing the visualization media order for each tester to avoid biases, and filling a System Usability Score (SUS) questionnaire after completing the tasks with each visualization device. At the end of the test session, testers were asked for feedback related to the whole experience. For the appearance task, the users were asked to spend five minutes performing a given set of actions on the cubes visible in the scene, evaluating the effectiveness of feedback effects, textures, and shapes, starting from the default values and being able to change them as they prefer afte- rward. User preferences for each parameter were recorded at the end of the task. For the performance task, users had to “dial” a sequence of ten casual numbers five times, each one corresponding to a different configuration in terms of numbers of NeuroTag, size, and distance, based on the feedback provided by the experts. While the users carried out the performance task, both completion times and false-positive occurrences were recorded for each configuration. A video showing the execution of the test with the monitor configuration is available at https://youtu.be/EpYk3a9WKrI.
Results Discussion For the appearance task, all the feedback effects were welcomed by the users, with a slight preference for the default one in AR: thus, it would be preferable to implement more than one feedback solution and let the user choose from a customization menu. Moreover, the users appreciated the third feedback effect since the charging bar around the NeuroTag provides effective feed- back not only when the selection is completed but also while it is occurring, providing a measure of the confidence level detected by the system while focu- sing on NeuroTags. Pertaining to the textures, the default one was preferred most of the time by all the users with all the available visualization media; since changing the textures requires additional work on the calibration pro- cedure, it would be preferable to adopt the default solution, thus considering different textures only after an assessment of the difficulties in the NeuroTag selection for each specific combination of user task and visualization device.
A Comparison of Three Different NeuroTag Visualization Media: Brain Visual Stimuli 157
Table 1. Average errors (E) and times (T) for the performance task for each configuration (C1 – C5) for the three visualizations media, monitor (MO), AR, and VR.
Table available in the original PDF paper.
C1 C2 C3 C4 C5
E T E T E T E T E T MO 0,83 50,92 0,42 46,42 0,64 56,73 1,00 40,00 0,83 38,50 AR 0,20 98,20 0,50 68,60 0,44 108,00 1,11 70,78 0,50 57,10 VR 0,00 64,14 0,57 71,00 0,33 81,33 0,83 57,17 1,14 40,14
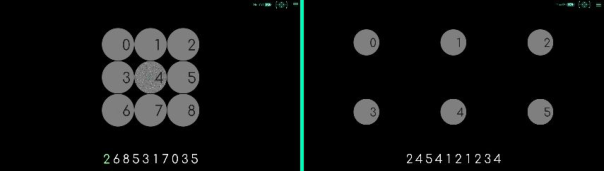
Figure 7: The fifth (left) and second (right) configurations for the performance task.
For the performance task, table 1 shows the average errors (E) and times (T) for the performance task for each configuration (C1 – C5) for the three visualizations media considered in this study. The monitor system on average provides the lowest execution times for all the configurations, whereas the VR system provides the lowest error rate for three configurations out of five.
Overall, the fifth configuration, which consists of the maximum NeuroTag size at the minimum distance, is the fastest one (Figure 7, left); the second con- figuration, which consists of the default size at a medium distance, provides the lowest error rate (Figure 7, right). Comparing the times of the fifth and second configurations, since the second one is slightly slower than the other, it may be possible to consider the second configuration as the best option to minimize errors without affecting selection performances.
Pertaining to the subjective evaluations of the three visualizations media, the SUS scores are shown in Table 2. The averages show that the monitor system was the preferred one, with an overall SUS evaluation between good and excellent, whereas the VR system is almost good, and the AR represents the worst option. Since the difference between the monitor system and the AR one is notable, a two-sample t-test was performed to understand if the monitor system could be considered better than the AR one from a statistical point of view. The resulting P-value for a two-tail distribution is 0,012872, thus it is possible to reject the null hypothesis with a confidence interval of 95%. Overall, the experience was evaluated positively by the users in the general comments’ section. A final consideration regards the wearability of the dif- ferent proposed systems: in three cases, the users were not able to effectively complete the task with all the available systems, due to calibration difficulties. Thus, if the use case is compatible with more than one visualization media,
Table 2. The SUS for each user (U1-U9) and the average (AVG) computed for each visualization media, monitor (MO), AR, and VR.
the one which leads to the best calibration value and comfort for the user should be chosen.
CONCLUSION
Brain-computer interfaces are becoming increasingly popular as technologi- cal advantages allow manufacturers to market small and ergonomics BCI devices. The NextMind belongs to this new device category; in particular, it is able to gather, process, and classify the brain activity of the visual cortex. The NextMind enables the users to trigger predefined actions by means of NeuroTags, which act as a sort of mind-controllable switches.
This paper aims to investigate design issues of BCIs based on the Nex- tMind. NeuroTag size and distance among NeuroTags have been considered in order to find the optimal tradeoff between robustness and selection speed. Moreover, three different visualization media have been considered: a moni- tor, a VR HMD, and a wearable AR device. User tests outline that monitor NeuroTag visualization outperforms AR visualization, whereas it is not pos- sible to identify statistically significant differences between monitor-VR and AR-VR.
Future work will be aimed to explore other visualization media (for insta- nce, projector devices) in order to assess NeuroTag visualization in different contexts/environments.
REFERENCES
Brooke, J. (1996) SUS-A quick and dirty usability scale. Usability evaluation in industry Volume 189 Number 194. Da Col, S. Kim, E. Sanna, A. (2022) Human performance and mental workload
in augmented reality: brain computer interface advantages over gestures, Brain- Computer Interfaces: https://www.tandfonline.com/doi/abs/10.1080/2326263X .2022.2068324 Mridha, M.F. Das, S.C. Kabir, M.M. Lima, A.A. Islam, M.R. Watanobe, Y. (2021) Brain-Computer Interface: Advancement and Challenges, MDPI Sensors Volume 21. Nicolas-Alonso, L.F. Gomez-Gil, J. (2012) Brain Computer Interfaces, a Review,
Read this individual research paper free through the original publisher, or explore the full digital proceedings book.
ISBN 978-1-958651-44-5
Explore this ISBN in the AHFE Bookstore ↗Listed in the July 2026 bookstore catalogue; search by ISBN to confirm current availability · Digital book purchase optional