Hüseyin Avsar, Michael Böhm, Annika Dreßler, Markus Fischer, Ulrike Steinberger (2022). User experience of an automated on-demand shuttle service in public transportation. In: Human Factors in Transportation. AHFE Open Access, vol. 60, pp. 237–251. https://doi.org/10.54941/ahfe1002454
Autonomously driving shuttles with electric drive are envisioned to play a complementary role in public transportation in the near future. These vehicles may be used in scenarios where the use of full-sized busses is not technically feasible or economically viable. The compact size of automated shuttles offers the opportunity to operate in narrow streets, to connect suburban areas and to supply on-demand first and last mile services. The integration of an on-demand shuttle service into public transportation was tested and evaluated in a real-world trial in Hamburg-Bergedorf (Germany). A survey covering a large variety of aspects of user experience was created and distributed among users. Overall, the passengers were satisfied with the on-demand shuttle service and indicated that they could imagine to use such a service in the future. The field trial provided valuable insights and revealed the development potential of on-demand shuttle services in public transportation, motivating to continue research in this area.
INRODUCTION Urban transportation of people has been a challenge since at least the 19th century. In recent years, there has been growing concern on the indirect cost of people transportation, in particular regarding traffic via personal cars. Cities increase the utilization of public transport options with the aim to reduce carbon dioxide emissions and traffic congestions (Verbavatz and Barthelemy, 2019). Unfortunately, the ratio of people using public transport has remai- ned largely unchanged despite measures such as charging road tolls, lowering ticket prices in public transportation, or optimizing service coverage and sch- edules (Prieto Curiel et al., 2021). At the same time, cost constraints prevent cities from increasing the quality of public transport services significantly. In particular, suburban areas are typically underserved by public transport options, especially with regard to frequency of the service and distance to the closest transport station (Berežný and Koneˇcný, 2017).
For instance, the German city of Hamburg has a “five-minute goal”, mea- ning every citizen shall be able to reach a public transport connection within five minutes. This goal is easily achieved in the city center, where a lot of public transport modalities are readily available, but is nearly impossible in the suburban areas, with the current setup of busses, subway and train connections (Hochbahn, 2021). Therefore, there is an increasing trend to consider fully automated shuttles as an affordable option to extend coverage (Bucchiarone et al., 2021).
A fully functional autonomous shuttle by itself could improve the cost stru- cture of a service, since up to 50% of the operating cost of a bus system are for bus drivers (Azad et al., 2019). However, it does not necessarily improve the quality of service. In order to achieve such an improvement, automated shuttles have to be combined with an on-demand routing system. This allows a shuttle to be called to a desired departure location at a desired time. Such an on-demand service can significantly reduce the walking distance to the depar- ture location, can increase the effective frequency of the service for end-users, and thus can improve service quality (Alessandrini et al., 2014). In cities with constrained parking options, the convenience of an on-demand autonomous shuttle service could even exceed that of using one’s own personal car.
In comparison to a conventional bus system, employing a smart routing service which aggregates similar journeys could reduce overall operating cost. This is because many passenger journeys overlap to a great extent in terms of route and timing. Small shuttles can also much better accommodate varying passenger numbers, and the environmental foot-print of a minimal service for very few passengers is much smaller than with regular buses or trains (Hasan et al., 2021).
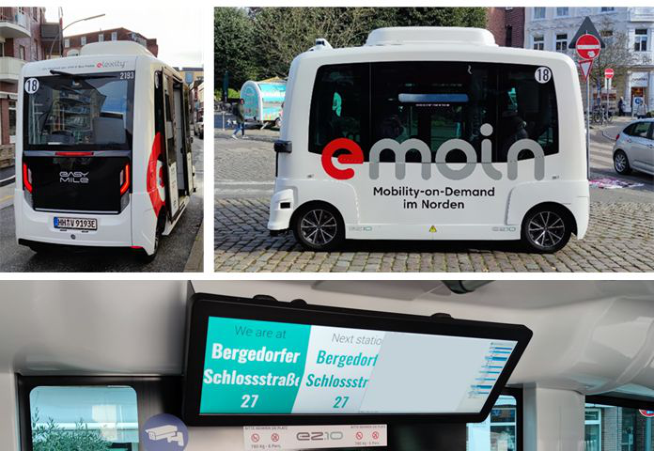
In order to get a realistic insight into the requirements, constraints and results of operating an autonomous, on-demand shuttle, such a service, called “emoin” (mobility-on-demand in the north) (Verkehrsbetriebe Hamburg- Holstein GmbH, 2021), was set up as part of the research project RealLab Hamburg. The service was integrated into the public transport system of Hamburg, so as to explore synergies and complementarities. The service was offered for six weeks (September to October 2021) in the district of Bergedorf and could be ordered for free by the general public via a mobile app or tele- phone. The shuttle service was available every day between 08:30 and 19:30, offering flexible routing between any of the 60 pick-up and drop off locati- ons. The operation area covered the local railway station, a part of the city center and the residential areas where no conventional bus service can be ope- rated due to too narrow streets. The three autonomously driving minibuses equipped with on-board journey information displays were capable to drive up to 18 km/h (Figure 1). Each shuttle was supervised by a safety operator on board. During the whole test period, the shuttles drove approximately 1300 km and transported more than 1000 passengers.
THE ON-DEMAND SHUTTLE SERVICE First, users had to download the emoin app from the google play store. After opening the app for the first time, users were redirected to the emoin website
User Experience of an Automated On-Demand Shuttle Service in Public Transportation 239
Figure 1: The “emoin” shuttle (EasyMile EZ10) applied in the test operations.
and were asked to create a new account. After submitting a username, mail address and password an automatic mail was sent to users for confirmation. Then, users were able to login by using their username and password.
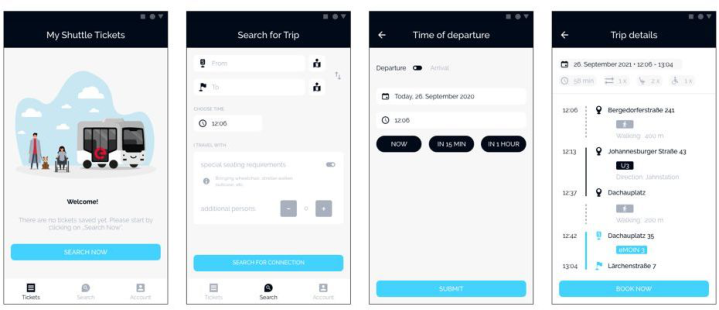
In order to book a journey, users had to click on the menu item “Search” in the bottom navigation bar. There they could enter the desired pickup loca- tion, the destination and the preferred time slot for the start of the trip. The locations could also be picked in a map view or also directly by using the current GPS position of the user’s smartphone. To enhance the usability for spontaneous users, instead of having to enter the time information via a clock wheel selector, they also got the option to book a journey with one button click for “Now”, “in 15 min” or “in 1 hour”. Users could book a journey for up to six people. The toggle “special seat requirements” could be activated if more space than one seat was needed for a passenger (e.g. wheelchair user or user carrying a suitcase). In this case four seats would be reserved automa- tically to ensure that there is enough space for the passenger. Within a few seconds after hitting the “Search” button and a short loading animation, the users saw a result page with the best possible connection (Figure 2).
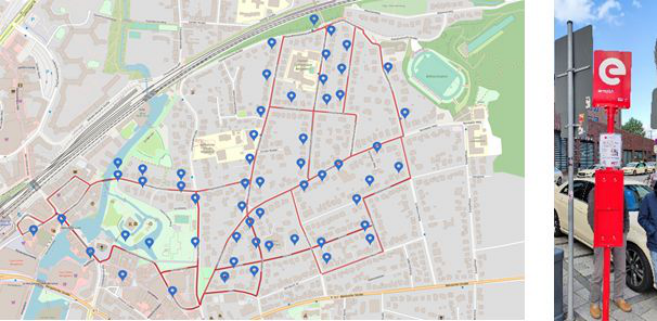
For creating and offering available routes the scheduling system conside- red all means of public transportation options and the shuttle service. The flexibility offered by the on-demand service is that any route in any direction can be created between the 60 pick-up locations. This is only possible if there is an available shuttle without a planned journey for the desired time slot or there is a planned journey where the routes can be aggregated. Pick-up locations which were set at bus stops were equipped with a physical signage including information about the on-demand service. The remaining pick-up locations did not have a signage. However, these “virtual” pick-up locations were easily identifiable by the “no parking areas”. (Figure 3)
Figure 2: Use flow - reserving a ride.Figure 3: Operation area of the emoin shuttle service.
Users received the details of the next available shuttle ride including wal- kways, other transfers with the local bus network. Connections including a shuttle ride were highlighted in the primary color blue. After clicking on the “Book now” button the user needed to confirm the details and received a feedback after the journey was successfully saved.
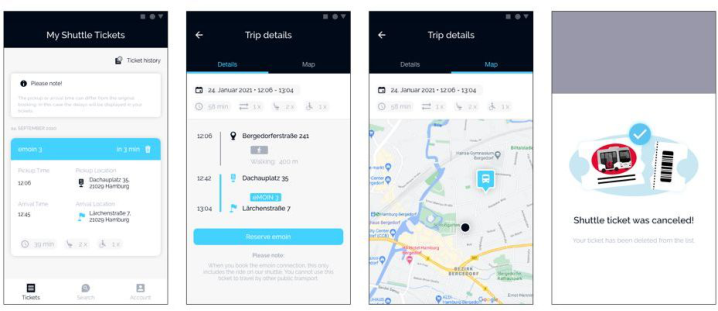
In addition, a confirmation mail was sent to the users and the trip was saved in the app. Both include the postal address of the pickup location and the time of the journey. The users could look up their reservations in the “Tickets” tab. The users could cancel a reservation any time within the detail view of a ride. The cancelation was also confirmed by a mail. In the third navigation tab “Account”general information like terms of use, privacy policy, profile information and the link to the survey platform are displayed. A contact email address is also shown for the user to get support if needed. (Figure 4).
Safety operators checked the reservations before letting the users on the shuttle. Then, safety operator requested passengers to fasten their seat belts and provided (if requested) detailed information about the main project, the
User Experience of an Automated On-Demand Shuttle Service in Public Transportation 241
Figure 4: User flow - ride details.
service and the shuttle itself. Before the journey started, the safety opera- tor warned all passengers about unexpected events (e.g. sudden brakes) that may occur. The shuttles were equipped with multiple displays which provided beside journey related information, information about vehicle automation and its aerial detection as well.
STUDY METHOD Service acceptance and willingness to use are key issues in determining whether an autonomously driving shuttle has the potential to increase the attractiveness of public transportation and to improve mobility. A survey covering a large variety of aspects of user experience in the phases of registra- tion, booking, way to the pick-up location and the journey itself, was created and distributed among users. Service specific quantitative items with additi- onal qualitative information were presented to gain insights on the current state of the service. The service design of the on-demand shuttle service was evaluated with the survey, which included approximately 100 closed-ended and open-ended items. The survey was divided into five sub-questionnaires: registration, booking a journey, journey to the pickup location, shuttle experi- ence and feedback. A general question at the beginning of the survey provided an indication for the users whether they have made the experience to answer the items within the specific sub-questionnaire.
Users were free to fill the questionnaires in one go or to conduct the sub-questionnaires one by one in any order. Users were invited to fill the questionnaires; with a link in the app, a link in the registration- and boo- king confirmation mails, with a QR code at the pick-up location and in the shuttle. In addition, an investigator offered users to fill the survey through a structured interview. The survey results were backed up by observations and interviews with safety operators in order to identify passengers’ pain points during the journey and to propose options and define recommendations to improve service design.
Table 1. emoin app onboarding experience.
Table available in the original PDF paper.
Single Choice - Scale: 1 – complicated / 7 - easy M SD N Installing the app was … 5.71 2.76 42 Registering as a user was … 5.51 1.95 41
PARTICIPANTS 46 users (20 female, 1 diverse) shared their demographical data. The mean age of the participants was 48 (SD = 17.20) ranging from 18 to 95. Appro- ximately two thirds of the users (63%) were locals living in Bergedorf. This was followed by users who are living in other districts (18%) and surroun- ding areas (15%) of Hamburg. There were only a few users (4%) who lived outside of Hamburg. Approximately, half of the users (44%) took notice of the service by seeing the shuttle operating in Bergdorf. The rest of the users became aware of the service through the newspapers (23%), family and fri- ends (18%), internet (12%) and television (3%). The majority of the users (82%) had never used an on-demand service before. Most of the users repor- ted that they used the service out of curiosity (77%) as opposed to “to get from A to B” (17%).
SURVEY RESULTS Registration
The app was downloaded more than 500 times. Installing the app and registe- ring was perceived as easy by the users (Table 1). Users had the opportunity to tell whether there was anything that they found complicated or unfavora- ble during this phase. In summary, users did not like that they had to sign up and share their data even if they just wanted to try the service, that they were redirected to the emoin website and the language on the website was English.
Booking a Journey Users tried to retrieve information about operation area and operation hours mainly through the emoin app (35%), emoin website (23%) and at emoin stops (10%). Approximately half of the users (44 %) indicated that this infor- mation was not easily comprehensible and one third (33%) of the users felt not sufficiently informed about the shuttle and its operation. Suggested rou- tes by the system were not always (37%) according to users’ expectation. In these cases, users thought that the shuttle made a detour. The booking expe- rience showed a tendency towards being “complicated”. Users were neither satisfied nor dissatisfied with the content and presentation of information in the app (Table 2).
Despite efforts to increase the awareness (via internet, newspapers, flyers) the majority of potential users did not know how an on-demand service works. It was observed that potential users were frustrated because an imme- diate journey booking was not possible and it was even more frustrating if
User Experience of an Automated On-Demand Shuttle Service in Public Transportation 243
Table 2. Booking experience.
Table available in the original PDF paper.
Single Choice - Scale: 1 – complicated / 7 - easy M SD N How did you experience the booking with the app? 3.63 1.91 27
Single Choice - Scale: 1 - not satisfied at all / 7 -absolutely satisfied
3.94 1.68 16
Were you satisfied with the presentation of information in the app? 4.38 1.62 16 Were you satisfied with the content of information presented in the app?
they saw shuttles driving away without any passengers on board. A draw- back of the current scheduling system is that it synchronizes every 15 minutes which avoids an immediate booking.
A review of open-ended responses revealed that service specific informa- tion was not communicated well enough. The information about operation hours was only available on the website. Information about the operation area and the journey being free of charge was mentioned in the flyer and was not directly retrievable via the app. Beside promoting the service and answe- ring questions during planned stops, safety operators explained to potential users how an on-demand service works and how they could book a journey with the shuttle.
The usability of the app was evaluated with the System Usability Scale (SUS) (Brooke, 1996). There was a slight tendency towards disagreement for the items asking whether users found the app unnecessarily complex, needed the support of a technical person, thought there was too much inconsistency, and needed to learn a lot of things before they could use the app. There was a slight tendency towards agreement for the item whether users would imagine that people would learn to use this app very quickly. All mean values for other items were within a range (2.50 – 3.50) of neither agreement nor disagreement. The current state of the app produced a SUS Score of 58, which is within the range of being “acceptable” (Brooke, 2013) (Table 3).
Users stated that selecting a departure and arrival point was complicated to some extent because a list of stops was not available and the search area was not limited to the operation area. The system occasionally suggested addres- ses outside of this area. Thus, a list of stops (including the visualization of the stops on a map) and the limitation of the search area to the operation area was a frequently requested feature which was integrated with an update shor- tly after the trials started. The results which were received after the release of the update showed that users appreciated these new features.
The system did not offer a different time slot if there were no available shuttles. Therefore, users often failed to find a bookable journey with the shuttle. The system considered all means of public transportation options in creating available routes. Routes including an emoin shuttle service were color coded (in blue). This difference was not clear and lead to confusion in some users. One of the most requested features for the app is a sort of tutorial providing information about on-demand operation, the shuttle itself and an instruction on how to book a journey.
Table 3. Scores for the emoin app on the System Usability Scale (“str.”-”strongly”).
Table available in the original PDF paper.
Equation reproduced from the original PDF.
3.05 1.36
I think that I would like to use this app frequently.
I found the app unnecessarily complex. 2.30 1.38 I thought the app was easy to use. 2.95 1.28
2.40 1.68
I think that I would need the support of a technical person to be able to use this app.
3.45 1.28
I found the various functions in this app were well integrated.
2.40 1.24
I thought there was too much inconsi- stency in this app.
3.55 1.20
I would imagine people would learn to use this app very quickly.
I found the app very cumbersome to use. 3.35 1.15 I felt very confident using the app. 3.00 1.26
2.40 1.15
I needed to learn a lot of things before I could get going with this app.
Table 4. Pickup location.
Table available in the original PDF paper.
Single Choice - Scale: 1 – complicated / 7 - easy M SD N Finding the pickup location was … 6.61 0.92 23
Users were asked which alternative way of booking they would prefer to use if they had no possibility to book the shuttle via the app. The majority of respondents (39%) stated they would like to use their phone (e.g. voice call), which was an option already available during the trials, or to book the journey via the internet (e.g. website) (22%). Other imaginable solutions were buying a ticket over a vending machine (9%) or via Short Message Service (SMS) (4%). More than a quarter of the users (26%) stated they would like to have the possibility to hop on the shuttle spontaneously.
Journey to the Pickup Location The majority of the users (84%) knew the pickup location by heart or were already there before they made a booking. The majority of journeys (79 %) started from Bergedorf train station, the place where the shuttles stopped between the missions. Thus, finding the pickup location was perceived as easy (Table 4). All respondents stated that they arrived at the pickup location just on time or earlier than the scheduled departure time. There were a few journeys (15%) were the shuttle had a delay. The majority of respondents (92%) were picked up at the expected location but in one case the shuttle did not come. Approximately half of the users (47%) perceived the waiting time between the stops as “too long”. Three quarters of the users (75%) indicated that they would not wait more than 10 minutes for the shuttle.
User Experience of an Automated On-Demand Shuttle Service in Public Transportation 245
Table 5. Journey information.
Table available in the original PDF paper.
Single Choice – Scale: 1 – no very poorly / 7 – yes, very well M SD N Did you feel well informed while riding the shuttle? 6.82 0.39 22
Single Choice - Scale: 1 - not satisfied at all / 7 -absolutely satisfied
5.78 1.47 18
Were you satisfied with the presentation of information presented on the screen in the shuttle?
5.63 1.60 19
Were you satisfied with the content of information presented on the screen in the shuttle?
Users were asked what type of navigation they would prefer, if they did not know the pickup location. The majority of the users would prefer a map- based navigation in the app (41%). This was followed by the address of the pickup location (click on ad-dress leads to external navigation app [19%] / text only [14%]), a picture of the pick-up location in the app for comparison (12%) and navigation by spoken instructions (10%). An additional question was asked to users how they could easily identify the right pickup location. More than two third of the users (68%) would prefer a physical sign at the pick-up location. This was followed by a mark on the ground (20%). A few users (12%) said that they would not need any physical signage of the pickup location and the information that they were receiving via the app would be sufficient.
Shuttle Experience In almost half of the journeys (40%) there were no other passengers on board before users entered the shuttle. The majority of users (85%) preferred to sit on one of the rear seats (facing forward) and perceived the space in the cabin as “sufficient” (90%). Some users thought that the seat width was not sufficient and assumed that they would perceive the room inside the cabin as cramped if there would be more passengers on board. The air quality and the temperature inside of the shuttle was perceived as pleasant.
Usually, users obtained journey related information via the on-board displays (34%) and the safety operator (43%). Users felt very well informed and were satisfied with the content and the presentation of information on the on board displays while being on the shuttle (Table 5).
Nine out of ten users confirmed that they had a conversation with the safety operator about the emoin service. Observation and survey results sho- wed that users were very satisfied with the competence of safety operators and appreciated their support during the journey.
The overall service experience was evaluated with semantic differential items based on the Van der Laan scale (van der Laan et al., 1997). Users indicated that their journey with the shuttle was pleasant, safe, comfortable and entertaining. Users perceived the shuttle as useful, reliable and easy. Users considered the emoin shuttle service desirable in its current state (Table 6).
The majority of users (83%) reported unexpected braking maneuvers of the shuttle. More than half of these users (58%) perceived this experience as
Table 6. User experience journey.
Table available in the original PDF paper.
Equation reproduced from the original PDF.
Unpleasant Pleasant 1.38 0.67 Activating Calming 0.48 1.28
Complicated Easy 0.52 1.19 The emoin-Shuttle service is in its current state Undesirable Desirable 0.69 1.23
uncomfortable. Users reported that more than half of these events (53%) were triggered by other traffic participants who conducted an overtaking maneuver and merged back into the lane too close in front of the shuttle. The other part of these events was triggered by non-moving objects like tree branches protruding into the street, and parking vehicles standing too far from the curb or in towing zones. There were also events where the cause of the sudden braking maneuver was not observable. At some known locati- ons, safety operators proactively took over control of the vehicle in order to avoid a sudden braking maneuver. Sudden braking due to overtaking maneu- vers of traffic participants behind the shuttle was less predictable by nature. It was observed that other traffic participants who followed the shuttle for a prolonged time were likely to conduct a – sometimes risky – overtaking maneuver and vehicles waiting at an intersection were likely to violate the right of way of the shuttle. These maneuvers may be explained with the ave- rage speed of the shuttle (6 km/h) which is significantly lower than speed limit. The speed limit in the operation area varied between 30 km/h and 50 km/h. Users reported that there were traffic participants who expressed their frustration in these situations by pressing the horn. Safety operators identified suitable locations where they could let the traffic behind pass. In these situ- ations, safety operators made gestures to signalize that it is safe to overtake or to cross the street.
There were only a few users who reported unexpected experience due to the shuttles’ way of driving while accelerating or turning. In one instance, a user thought that the shuttle was accelerating faster than in other situations and the shuttle has taken the curves very far. However, none of these events was perceived as uncomfortable.
Although the shuttle was rated slightly worse than other means of public transportation, the users were satisfied with the on-demand service and could
User Experience of an Automated On-Demand Shuttle Service in Public Transportation 247
Table 7. Overall satisfaction and comparison to other public transportation options Single Choice - Scale: 1 – not satisfied at all / 7 - absolutely satisfied M SD N
Table available in the original PDF paper.
How satisfied were you in general with the emoin service? 5.45 1.49 29 Scale: 1 – much worse / 4 – exactly the same / 7 – much worse
3.56 1.45 27
How does the shuttle compare to other public transportation options?
imagine (67%) to use such a shuttle in the future without a safety operator on board (Table 7). Some users (29%) stated that they would use a driverless shuttle if a spontaneous booking was possible, if it was safer and faster, had been tested for a longer period of time, and would not brake suddenly. Pas- sengers indicated that the deployment of such a service as a feeder bus (75%) is sensible in urban (78%) as well as sub-urban areas (68%).
DISCUSSION
The real-world trial resulted in a number of findings which are very instru- ctive for future improvements of on-demand services with self-driving shut- tles. The survey results were backed up by observations and interviews with safety operators in order to identify passengers’ pain points during the journey and to propose recommendations to improve service design.
Awareness of the On-Demand Service The results clearly show that most users are unfamiliar with on-demand, autonomous shuttle services, and transfer their expectations towards a conventional public transport system onto such a service. This is illustrated by the fact that users asked for departure stations clearly marked by a physical sign, as well as by their wish to be able to hop onto the shuttle spontaneously. Potential users were frustrated because booking an immediate journey was not possible and reported it was even more frustrating if they saw shuttles driving away without any passengers on board. An on-demand service pro- vides flexibility but can only do so successfully if the backend system has sufficient information on the desired trips in advance. Otherwise, the system cannot optimize and aggregate routes. Thus, there is an inherent conflict of goals in the system, where users ask for maximum flexibility, and the on- demand disposition requires sufficient leeway to optimize route planning. A drawback of the current scheduling system is that it synchronizes every 15 minutes, and thus route changes and hence booking are only possible up to 15 minutes before departure. In an improved system, the synchronization frequency should be minimized to allow late route changes. Another con- sequence of this insight is that the app design needs to account for ad hoc journey requests with minimal interaction. This could be achieved by main- taining a list of favorite destinations and routing to them from the current location of the user. Ideally, the shuttle itself would provide a user interface
which allows to spontaneously hop on board (and check if there is still space available) after confirming a desired destination.
One of the most requested features for the app is a sort of guide providing information about on-demand operation, the shuttle itself and an instruction on how to book a journey. It is recommended to provide users with this infor- mation right after the installation of the app and make it available for later use. Users were very satisfied with the competence of safety operators and appreciated their support during the journey. In order to keep the positive impression, it is recommended to maintain the level of training of safety ope- rators until fully automated operation can be deployed. In long term it is envisioned to operate the on-demand shuttles without safety operators. The- refore, technical supervisor observing the operation of multiple shuttles from the control center should be capable to address questions and solve problems of passengers.
Booking a Journey The most requested feature for booking a journey was a list of stops (inclu- ding the visualization of the stops on a map) and the limitation of the search area to the operation area. These features were integrated with an update which was released shortly after the trials started. Some users who provided their feedback after the release appreciated this implementation. The trial showed that more flexibility of the booking system and more control of the user on the results of booking requests would be beneficial. Users should be able to decide about the trade-off between the walking distance to a pickup location and the overall travel time. A filter showing only journeys including the on-demand shuttle service might be beneficial at this stage. Related to that, the app should be able to offer upcoming journeys if there is no available connection with the shuttle service within the selected time slot.
Users were asked which alternative way of booking they would prefer to use if they had no possibility to book the shuttle with the app. While an app has significant advantages for the end user (e.g. they can get real time updates on delays and route changes, they can be notified on shuttle departure and arrival, and get information on the current route), a public on-demand shuttle service needs to remain accessible to users who cannot or do not want to use a mobile device. In addition to that it is worth to consider to develop and release the booking app for other mobile operating systems (e.g. iOS and Windows) Users were concerned about seat availability, crowding if all seats are occu- pied, and seat orientation (facing the driving direction). Scaling a shuttle service in a way where full occupancy is the exception rather than the rule, could be a way of enhancing user experience. However, the fact that this con- tradicts the idea of ride-pooling should be further reflected in order to find a suitable trade-off between users’ needs and efficiency. Adapting interior design to user needs (e.g. by providing partly wider seats, seats with variable orientation, partitions, spaces for luggage etc.) may be a way to bring toge- ther full occupancy and positive user experience. Moreover, the app as well as an in-vehicle user interface could clearly communicate the current and plan- ned occupancy. This would not only make it clear how crowded the shuttle
User Experience of an Automated On-Demand Shuttle Service in Public Transportation 249
will be on its trip, but also why it sometimes is almost or completely empty, but still cannot accept additional passengers.
One interesting question for future trials is whether reservation for specific seat positions will improve user acceptance. On the one hand, users showed a clear preference for seats facing in the direction of driving, on the other hand, managing seat positions could potentially lead to conflict and adds significant complexity to the user interface for trip booking.
Journey to the Pickup Location The majority of users were locals and knew the way to the pickup loca- tion by heart. The journey to and the identification of the pickup location may be a challenging task for non-local users. Users were asked what type of navigation they would prefer if they did not know the pickup location. The majority of the users would prefer a map-based navigation and that the pickup location be marked with a physical sign.
Interestingly, a lot of users preferred “stations” or “bus stops” rather than arbitrary addresses. Thus, usage patterns resembled more those of conventio- nal bus lines than taxis. This may be due to the visual appearance of shuttles and the abundance of existing autonomous shuttle projects with fixed line services. It remains to be seen if this perception will change over time, as the flexibility of an on-demand shuttle system allows virtually arbitrary departure and destination locations.
Shuttle Experience In the trial, it turned out that many users were interested in shuttle trips out of curiosity. Therefore, in the trial a lot of users didn’t actually mind where the journey was taking them, and thus were happy with hopping onto the shuttle regardless of its planned destination. We expect that a longer trial or a trial with a larger operating area would increase the frequency of purposeful trips, such as for commuting or shopping. In such a scenario, the preference for spontaneous trips would likely be reduced, and acceptance for planning a trip via the app would increase.
Other traffic participants who followed the shuttle for a prolonged time were likely to conduct sometimes risky overtaking maneuvers, and vehicles waiting at an intersection were likely to violate the right of way of the shuttle. This behavior may be explained by the average speed of the shuttle of 6 km/h. The current setting of the shuttle did not offer the opportunity to use the indicators manually. Safety operators gestured to other traffic participants to signalize that it is safe to overtake or to cross the street. An additional exter- nal human-machine-interface (eHMI) could be used to signal other traffic participants that it is safe to overtake or to cross the street.
Since problems with surrounding traffic were often caused by similar situ- ations in the same location, the on-demand disposition should be extended to have a certain self-learning capability. This would allow it to identify map locations where incidents are likely. In such locations, it could reduce the assumed speed, in order to avoid real-world delays, or try to avoid such
locations altogether. Ideally, improvements in setup of detection sensors and processing algorithms should avoid unnecessary braking maneuvers.
An interesting observation in the trial was the high frequency of passen- gers interacting with the safety operator on board. The safety operators were often asked to create ad hoc bookings, were interviewed on general questions concerning the trial operation, and assisted users with the app. They also explained functional anomalies such as emergency braking maneu- vers or extended waiting periods when the automated driving functions became temporarily unavailable, which reassured passengers. The percentage of interviewees willing to take a ride on a driverless shuttle was high (67% unconditionally, and 29% under certain conditions). Since ultimately auto- nomous shuttles are expected to operate without a safety operator on board, one important aspect of an autonomous shuttle service will be how effectively these non-obvious additional tasks of the safety operator can be automated or provided via a user interface. Providing the possibility to interact with a technical supervisor in the control center would increase user acceptance.
Users felt on average that the waiting time for the shuttle was too high. Most would accept a waiting time of less than 10 minutes. In the trial, the shuttle often encountered situations where the trip had to be delayed (e.g. due to an emergency braking maneuver prompted by another car suddenly over- taking in narrow streets or due to the automated driving functions becoming temporarily unavailable). It is clear therefore that user acceptance depends on a flexible service which keeps users informed about any delays and which can quickly and efficiently re-plan trips based on delays. In the trial, the safety operators on board often re-planned trips in an ad hoc manner when they noticed that the schedule provided by the on-demand disposition could no longer be maintained due to accumulated delays. Thus, in the next iteration the on-demand disposition should be able to detect such situations, do the re-planning by itself and automatically keep users informed, accordingly.
CONCLUSION
The trial yielded a large number of insights and ideas for possible improve- ments of the underlying scheduling and booking system, of the mobile end user app, of the shuttle operation as well as of the communication capabilities of the shuttle itself – both for passengers on board as well as for surrounding traffic.
Even without such improvements, the service was well accepted by the local community and quickly attracted a steady user base. This indicates that a more comprehensive service, covering a larger area and having more vehi- cles in operation, would add significant value to the public transport system of a city. In particular, with a more widespread service, the specific advan- tage of an on-demand shuttle – the ability to pick arbitrary departure and destination locations as well as times – will become more significant.
The low top speed of the shuttle limited its applicability to the first or last mile as well as to locally confined trips. If the underlying automated driving functions can be improved so as to reach top speeds comparable to
User Experience of an Automated On-Demand Shuttle Service in Public Transportation 251
other urban traffic (i.e. in the range of 30-50 km/h), an autonomous on- demand shuttle service could become a viable supplement for conventional public transport modes, such as buses.
A critical hurdle for wider adoption is the full automation, without the need of an on-board safety operator. As shown in this trial, users interact with safety operators in complex ways. Not all of the implicit tasks of a safety operator can be easily substituted by a technical solution. Therefore, we recommend an in-depth analysis of the requirements of a truly driverless shuttle, and how they can be addressed, e.g. by remote operators and in- vehicle information/communication.
ACKNOWLEDGMENT
This research was funded by Federal Ministry for Digital and Transport under the Grant NR: 01MM2006HH
REFERENCES
Alessandrini, A., Cattivera, A., Holguin, C. and Stam, D. (2014) ‘CityMobil2: Challenges and Opportunities of Fully Automated Mobility’, in Meyer, G. and Beiker, S. (eds) Road Vehicle Automation, Cham, Springer International Publishing, pp. 169–184. Azad, M., Hoseinzadeh, N., Brakewood, C., Cherry, C. R. and Han, L. D. (2019)
‘Fully Autonomous Buses: A Literature Review and Future Research Directions’, Journal of Advanced Transportation, vol. 2019, pp. 1–16. Berežný, R. and Koneˇcný, V. (2017) ‘The Impact of the Quality of Transport Services on Passenger Demand in the Suburban Bus Transport’, Procedia Engineering, no. 192, pp. 40–45. Brooke, J. (1996) ‘SUS: A ‘Quick and Dirty’ Usability Scale’, 189 (194), pp. 4–7. Brooke, J. (2013) ‘SUS: A Retrospective’, 8 (2), pp. 29–40. Bucchiarone, A., Battisti, S., Marconi, A., Maldacea, R. and Ponce, D. C. (2021)
‘Autonomous Shuttle-as-a-Service (ASaaS): Challenges, Opportunities, and Social Implications’, IEEE Transactions on Intelligent Transportation Systems, vol. 22, no. 6, pp. 3790–3799. Hasan, U., Whyte, A. and Al Jassmi, H. (2021) ‘Assessing Lifecycle Environmental Footprint of Autonomous Mass-Mobility for Urban Highways by Microsimulation-Modelling’, SSRN Electronic Journal. Hochbahn (2021) Our (climate) plan for the mobility transition: [Online]. Available
at https://www.hochbahn.de/en/responsibility/the-hamburg-takt-. Prieto Curiel, R., González Ramírez, H., Quiñones Domínguez, M. and Orjuela Mendoza, J. P. (2021) ‘A paradox of traffic and extra cars in a city as a collective behaviour’, Royal Society open science, vol. 8, no. 6, p. 201808. van der Laan, J. D., Heino, A. and Waard, D. de (1997) ‘A simple procedure for
the assessment of acceptance of advanced transport telematics’, Transportation Research Part C: Emerging Technologies, vol. 5, no. 1, pp. 1–10. Verbavatz, V. and Barthelemy, M. (2019) ‘Critical factors for mitigating car traffic in cities’, PloS one, vol. 14, no. 7, e0219559. Verkehrsbetriebe Hamburg-Holstein GmbH (2021) Autonomes Fahren [Online].
Available at https://vhhbus.de/autonomes-fahren/.
LISTED IN THE AHFE DIGITAL BOOKSTORE CATALOGUE
Explore the complete digital volume
Human Factors in Transportation
Read this individual research paper free through the original publisher, or explore the full digital proceedings book.
ISBN 978-1-958651-36-0
Explore this ISBN in the AHFE Bookstore ↗Listed in the July 2026 bookstore catalogue; search by ISBN to confirm current availability · Digital book purchase optional