Lasse Schölkopf, Alicia Kneuper, Veronika Hutmann, Frank Diermeyer (2022). Digitizing Buttons: A Comparison of Digital Input Modalities to Replace Physical Buttons in Truck Cockpits. In: Human Factors in Transportation. AHFE Open Access, vol. 60, pp. 14–24. https://doi.org/10.54941/ahfe1002429
Commercial vehicle cockpits are, due to a high number of control elements, complex workplaces. To simplify the interaction, fewer buttons could only present currently relevant functions, which requires dynamic and therefore digital input modalities. While such modalities exist, their fitness for use in commercial vehicles has to be proven and compared. For this, a user study with N = 23 truck drivers was conducted to evaluate three potential hardware approaches with regards to operating safety and user acceptance. Results indicate minor differences in operating safety and none in acceptance ratings for buttons with display strip, buttons with integrated displays and a touchscreen with haptic feedback.
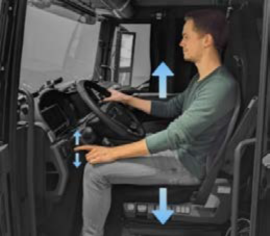
Modern vehicles are complex machines, which is especially true for comme- rcial vehicles, due to highly specific vehicle functionalities. This has led to driving workplaces which are cluttered with push buttons and other physi- cal control elements. Fortunately, the complexity of cockpits can be reduced, for example through the use of adaptive user interfaces (AUI) (Schölkopf, Kneuper, Hutmann, & Diermeyer, 2021). Such systems only present the currently relevant functions and have been successfully introduced in pas- senger cars (Thomasen, 2020; Walthart, 2021). This trend is expected to be introduced into commercial vehicles, for which first concepts already exist (Schölkopf, Wolf, Hutmann, & Diermeyer, 2021). AUIs require dynamical positioning of control elements, which is not possible with traditional static buttons, hence digitalized modalities are required to replace them. One may ask: Why not simply use the digitized modalities already used in passenger cars such as simple touchscreens? This is where the truck specific require- ments come into play. In contrast to passenger cars, trucks feature suspension seats, shown in Figure 1. While these maximize the driver’s comfort on long distance driving and on rough road surfaces, they introduce vertical move- ment into the driver relative to the driving workplace, impairing the driver’s
Digitizing Buttons: A Comparison of Digital Input Modalities to Replace Physical Buttons 15
Figure 1: Moving seat fitted to a truck cockpit which introduces vertical movement into the driver’s body and limbs, therefore making it harder to reach for control elements.
ability to reach for small control elements. This leads to higher time to task completion, longer glances towards the control element and higher workload level (Salmon et al., 2011).
The time the driver has to take his eyes from the road in order to find the control element has to be minimized to improve safety, while also considering the user group’s acceptance. And finally, the solution must be economically manufacturable and capable of being installed in a vehicle in series produ- ction. Therefore, a modality that satisfies all requirements is needed. This work aims to present and compare digitized modalities to replace physical control elements in truck cockpits and to conduct a user study.
STATE OF THE ART Digitized Input Modalities
Input modalities for human-machine interfaces generally can be categorized into direct and indirect manipulating modalities (Saffer, 2007). For indi- rect modalities, such as rotary push controllers to operate a higher-mounted display (Harvey, Stanton, Pickering, McDonald, & Zheng, 2011), the hands are typically not touching the output medium (Schmidt, Block, & Gellersen, 2009). For direct modalities, the same device acts as the input and output device, which is true for touchscreens (Harvey et al., 2011), but also argua- bly for traditional physical control elements such as push buttons. While both types of modalities feature their own advantages and challenges, prior work has shown that direct modalities outperform indirect input devices for simple tasks such as selecting one function out of many in terms of time to comple- tion, the number of glances off the road as well as driving performance (Large, Burnett, Crundall, Lawson, & Skrypchuk, 2016). Tasks can also be executed faster with direct modalities compared to indirect ones (Harvey et al., 2011). Therefore, this work focusses on digitized direct modalities which will be discussed in the following.
Touchscreens Touchscreens are widely used in the automobile sector due to their high fle- xibility (Pitts, Skrypchuk, Wellings, Attridge, & Williams, 2012). However, a
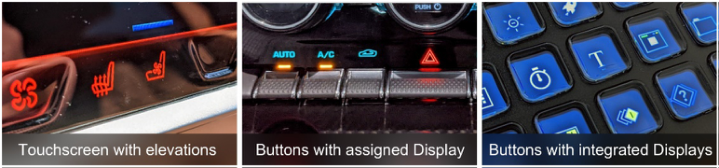
Figure 2: Touchscreen with static elevated surfaces as orientation aids (left), row of phy- sical buttons with an assigned display strip (center), physical buttons with integrated displays (right).
lack of haptic confirmation of actions (Stevens, Quimby, Board, Kersloot, & Burns, 2002) forces the user to rely on visual feedback to check if the desired action was achieved. Furthermore, in contrast to physical push buttons, con- trol elements cannot be located by feel on the touchscreen’s surface, leading to increased glances towards the user interface. To counteract this, previous research focused on augmenting touchscreens with haptic feedback (Beru- scha, Krautter, Lahmer, & Pauly, 2017; Farooq, Evreinov, & Raisamo, 2019; Gordon & Zhai, 2019; Harrington, Large, Burnett, & Georgiou, 2018; Pitts, Burnett, et al., 2012; Pitts, Skrypchuk, et al., 2012; Tunca, Fleischer, Schmidt, & Tille, 2016; Weddle & Yu, 2013; Zimmermann, Rümelin, & Butz, 2013), which mimics the feel of mechanical buttons (Beruscha et al., 2017). This diverts some of the workload back to the haptic sense (Pitts, Skrypchuk, et al., 2012), which leads to positive effects, such as lower glance times towards the modality (Beruscha et al., 2017; Pitts, Burnett, et al., 2012), and therefore improves the safety (Pitts, Burnett, et al., 2012) and the success rates for tasks (Gordon & Zhai, 2019). Prior work also suggests that haptic feedback could lead to slightly better driving performance (Beruscha et al., 2017), subjecti- vely easier and more pleasurable usage (Gordon & Zhai, 2019; Pitts, Burnett, et al., 2012; Weddle & Yu, 2013), and lower perceived mental workload (Beruscha et al., 2017). Adding haptic cues for locating control elements by feel is also known to improve the human-machine interaction and are refer- red to as orientation aids (Tunca et al., 2016). These can be implemented by static elevated surfaces (Zimmermann et al., 2013) (Figure 2, left) or trigge- ring active haptic feedback when sliding with the finger over a button’s edge on the touchscreen’s surface (Beruscha et al., 2017).
Physical Buttons with Displays Physical push buttons cannot dynamically change their functionality on their own, but in combination with a display this becomes feasible. Such buttons are widely used with a display strip (BWD), due to their main advantages, such as high cost-effectiveness, good haptic feedback and high blind opera- bility, (Figure 2, center). A more modern solution is buttons with integrated displays (DB), which are primarily used in consumer electronics (Figure 2, right) and industrial appliances, but also in cars such as the Nissan Juke (Nissan Motor Corporation, 2010).
Digitizing Buttons: A Comparison of Digital Input Modalities to Replace Physical Buttons 17
RESEARCH QUESTIONS It can be deducted from the state of the art, that input modalities should fea- ture haptic feedback to enable the driver to blindly find and push the correct control element, which applies to all three identified solutions. Although all modalities have been the subject of previous research, studies on their sui- tability for use in commercial vehicles and comparisons are lacking. After considering all the positive effects from haptic feedback on touchscreens, we hypothesize that their safety and user acceptance are identical to physical buttons. To answer whether this is true for use in commercial vehicles, the most important criteria should be examined: Firstly, the safety to operate the modality while driving.
RQ1: Do the selected modalities differ in terms of their influence on operating safety?
Since the driving safety is critically influenced by glances away from the road (Pitts, Burnett, et al., 2012), the visual demand will be compared by mea- suring critical glances and mean glance time towards the interface, as well as the driving performance while interacting with the modality by evalua- ting the standard deviation of lane position (SDLP). Furthermore, the time to task completion (TTC) will be investigated. Four hypotheses were therefore derived:
H1: The average number of critical glances towards the modality is equal for all three modalities.
H2: The mean glance time towards the modality is equal for all three modalities.
H3: The SDLP is equal for all three modalities.
H4: The mean TTC is equal for all three modalities.
Gaining the acceptance of the targeted user group is one of the biggest challenges when creating new interfaces for the human vehicle interaction (Winner, Hakuli, Lotz, & Singer, 2015), which in this case are truck drivers. Thus, the second research question is as follows:
RQ2: Do the selected modalities differ in terms of acceptance by the targeted user group?
The acceptance will be investigated by using a standardized questionnaire (van der Laan, Heino, & Waard, 1997), which is intended for use in veh- icular applications. It divides the user’s acceptance into two subdimensions (usefulness and satisfaction), leading to two hypotheses:
H5: The perceived usefulness of the three modalities is equal.
H6: The perceived satisfaction of the three modalities is equal.
A driving simulator study was conducted in order to answer the stated research questions.
DRIVING SIMULATOR STUDY Digital Input Modalities
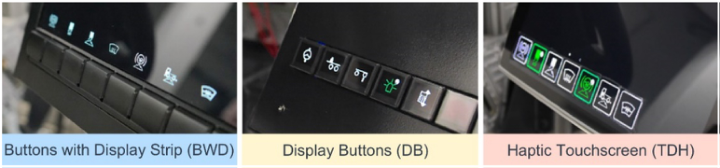
The identified potential digital input modalities were built as interactive pro- totypes and integrated into a driving simulator. For the BWD (Figure 3, left), physical buttons were placed under a display strip. The keys are 22.6mm wide and 20.5mm high and are separated by ridges running vertically between the keys. The display has a resolution of 2736x1824 pixels. For the DB prototype (Figure 3, center), buttons by NKK (NKK Switches of America, Inc., 2021) are integrated into a custom built case. The buttons are 23.1mm wide and 20.3mm high and feature OLED displays with a resolution of 64x48 pixels. The TDH (Figure 3, right) prototype is based on an Audi 10.1 inch touch- screen featuring a resolution of 1540x720 pixels and a pressure sensor, as well as a haptic feedback actuator (Audi AG, 2017). Using a similar appro- ach as in previous work (Zimmermann et al., 2013, p. 10), haptic guidelines were applied to the touchscreen’s surface to improve blind operability.
The interface for the BWD and TDH are implemented in Unity 3D and a proprietary software for the DB. Since the user interface itself and the size and number of buttons is known to influence the interaction (Feng, Liu, & Chen, 2017), it is consistent for all three modalities, and shows seven vehicle functions arranged on two pages. An eighth button on the right allows swi- tching of pages for the DB and BWD, while a swipe functionality similar to current mobile operating systems is implemented for the TDH. The interface changes based on the current context, which is defined by four work pha- ses (loading of the vehicle, loaded drive, break and off-road driving) during which only currently relevant vehicle functions are presented to the driver.
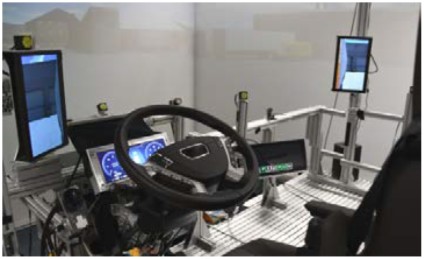
Driving Simulator A static truck driving simulator running the simulation software SILAB is used to conduct the study (Figure 4), featuring three projectors to create a field of view of 180° and two LCD panels to represent side view mirrors. A mount allows fast changes between the three digital user input modalities and ensures a realistic and consistent positioning in the cabin.
Study Design and Procedure A repeated measures design with a randomized order for the digital input modalities was used. The experiment was divided into five experimental blo- cks: The first block consisted of welcoming the test person, instructions, a pre-survey and a brief drive to allow for familiarization with the simulator. Experimental blocks 2, 3 and 4 are structured identically and only vary by the prototype used. After a short exploration of the digital input modality, the actual test drive began. During this, the driver was prompted via voice instructions to interact with 23 vehicle functions while the data was collected. The drive included four different scenarios, which prompted the adaptive user interface to switch the context and present currently relevant vehicle functions. Block 5 contained a final interview and the drivers debriefing.
Digitizing Buttons: A Comparison of Digital Input Modalities to Replace Physical Buttons 19
Figure 3: The three potential digital input modalities as interactive prototypes with a rudimental adaptive user interface.Figure 4: Static truck driving simulator running with eye tracking cameras and integra- ted TDH prototype.
Data Collection An eye tracking system consisting of four cameras and five infrared light sources recorded the gaze behavior (Figure 4). The driving performance was measured by the driving simulation, while the TTC is recorded by JavaScript code running on the respective prototypes, capturing all user interactions. Three additional cameras recorded the interaction with the modality to identify possible operating errors in retrospective analysis. A standardized questionnaire consisting of nine items and the qualities “usefulness” and “satisfaction” (Van der Laan et al., 1997), quantified the user’s acceptance.
RESULTS
Demographic Data N = 23 truck drivers participated in the study with an average age of 44 years (SD = 12.22). The sample is composed of 22 (96%) male and one (4%) female truck drivers. Due to non-reliable measurements, the eye tracking data consists of 15 participants (14 male, 1 female). The average age of this sample is 42.6 years (SD = 11.79).
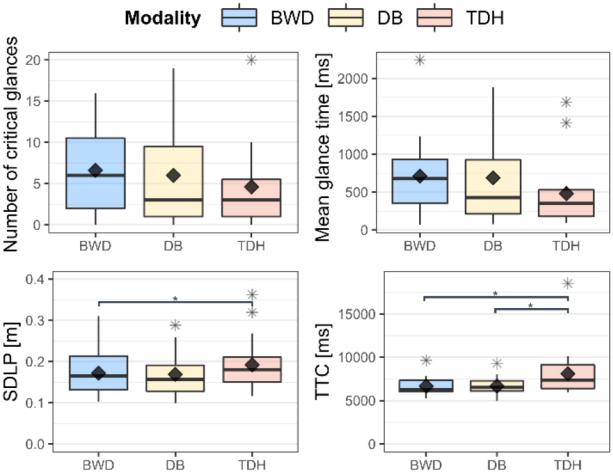
RQ1: Qualitative Data Due to multiple violations of assumptions for an ANOVA, non-parametric Friedman tests were used to answer hypotheses H1-H4 (Field, Miles, & Field, 2012) with subsequent Conover post hoc tests to identify which modalities
Figure 5: Boxplots with indicated means for the number of critical glances (top left), mean glance times (top right), and driving performance captured as SDLP (bottom left) and TTC (bottom right).Table 1. Descriptive data for the safety relevant metrics (N = 23).
Table available in the original PDF paper.
Metric Number of
Mean glance
SDLP [m] TTC [ms]
time [ms]*
critical glances*
M SD M SD M SD M SD BWD 6.60 5.04 711.93 541.83 0.17 0.05 6691.26 1028.28 DB 6.00 6.55 688.58 611.65 0.17 0.05 6667.45 1000.87 TDH 4.60 5.23 479.73 467.74 0.19 0.06 8103.09 2628.69
Equation reproduced from the original PDF.
differ from another. The results are shown for each measurement in Figure 5 and Table 1.
According to the Friedman test, the average number of critical glances is not significantly influenced by the modality (χ2(2) = 2.327, p = 0.312). Significant differences are reported for the mean glance time (χ2(2) = 6.533, p = 0.038) and SDLP (χ2(2) = 8.435, p = 0.015) as well as TTC (χ2(2) = 11.565, p = 0.003). Pairwise comparisons by Conover post hoc test with Bonferroni-Holm correction show significant differences for SDLP between BWD and TDH (z = 2.801, pHolm = 0.023) and for TTC between BWD and TDH (z = 4.193, pHolm < .001) and DB and TDH (z = 5.367, pHolm < .001). No significant difference in pairwise comparisons are repor- ted due to the correction for the mean glance time. Without any correction, there would be a difference between TDH and BWD (z = 2.373, p = 0.025).
Digitizing Buttons: A Comparison of Digital Input Modalities to Replace Physical Buttons 21
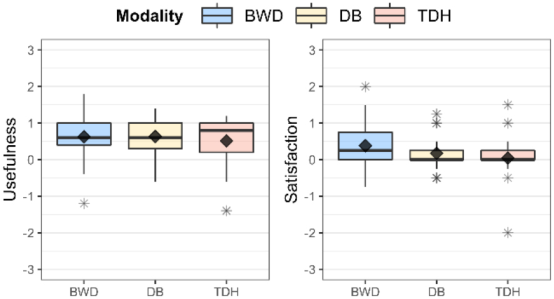
Figure 6: Boxplots with indicated means for the usefulness (left) and satisfaction (right).Table 2. Descriptive data for user acceptance (N = 23).
Table available in the original PDF paper.
Metric Usefulness Satisfaction
M SD M SD BWD 0.63 0.61 0.38 0.62 DB 0.63 0.56 0.17 0.44 TDH 0.51 0.66 0.04 0.62
Based on the analysis, hypotheses H1 is accepted whilst H2, H3 and H4 are rejected due to significant differences.
The number of operating errors was recorded by video analysis and eva- luated exploratively. Results show that 4 errors occurred for the BWD, 19 for the DB and 103 for the TDH, which were primarily caused by the swipe gesture to switch between pages one and two.
RQ2: Quantitative Data Statistical analysis for hypotheses H5 and H6 was also performed with Fri- edman tests because the assumptions of an ANOVA were violated. The descriptive data can be found in Figure 6 and Table 2.
A Friedman test showed no significant differences for usefulness (χ2(2) = 0.080, p = 0.961) and satisfaction (χ2(2) = 2.164, p = 0.339) for the different modalities. Hypotheses H5 and H6 are accepted based on the lack of significant differences.
DISCUSSION AND SUMMARY Three digitized input modalities were compared in a driving simulator study with N = 23 truck drivers to investigate their fitness for use in comme- rcial vehicles. For RQ1, results showed that the digital input modalities are not equal regarding their influence on safety. The driving performance and task efficiency differed significantly with lower values for SDLP in the BWD and DB condition and slower times to task completion for the TDH.
We suspect that those results could be due to the high number of opera- ting errors for the TDH. This prolonged the TTC and presumably caused the driver to mentally focus longer on the operating task instead of driving, which could be the reason for the slightly impaired driving performance. While the mean glance time also indicated significant differences, no stati- stical interpretation of differences between the modalities was possible due to correction. However, descriptive data showed that the visual distraction for the TDH is the lowest and therefore safest, and without any correction the results would have been significant. This leads to the conclusion that the visual demand was successfully reduced by applying haptic feedback and orientation aids to the touchscreen. To answer RQ2, we investigated the user’s acceptance by comparing the usefulness (H5) and satisfaction (H6) which showed no significant differences, leading to the conclusion that the three modalities are indeed comparably accepted by the targeted user group of truck drivers. Descriptive data showed the lowest levels for the TDH, which could again be attributed to frustrated users due to the high num- ber of operating errors. While the TDHs swipe functionality was intended to facilitate easy switching between the pages, it caused operating errors and may have limited its performance. We suspect a virtual button to switch between pages for the TDH would lead to driving performance and TTC on par with the DB and BWD. A further limitation is the lack of vehicle movements: Although the study took place on a suspension seat, no vibra- tions were introduced into the driving simulator, which would have been present in an actual vehicle. The greater feeling of safety in the driving simulator is also likely to have an influence on the driver’s behavior, since an accident has no consequences as it would in actual road traffic, which limits the transferability to reality. Future work should therefore validate the study’s findings without a swiping gesture for the TDH and in real world driving.
ACKNOWLEDGMENT
As first author, Lasse Schölkopf initiated the research, conducted the litera- ture review, planned the user studies and conducted the qualitative user study. Alicia Kneuper carried out the quantitative study including data collection and analysis and contributed to the writing process. Veronika Hutmann revi- sed the content of this work critically. Dr. Frank Diermeyer made an essential contribution to the conception of the research project. He revised the paper for important intellectual content and gave final approval of the version to be published and agrees to all aspects of the work. As a guarantor, he acce- pts responsibility for the overall integrity of the paper. The authors would like to thank Marian Hirsch, Dr. Anna Sprung and Dr. Sigrun Weise for their support and advice. This research was funded by MAN Truck & Bus SE.
REFERENCES
Audi AG (2017, October 2). Audi A8 10,1 Zoll-Touch-Display. Retrieved from https: //www.audi-mediacenter.com/de/fotos/detail/audi-a8-53730
Digitizing Buttons: A Comparison of Digital Input Modalities to Replace Physical Buttons 23
Beruscha, F., Krautter, W., Lahmer, A., & Pauly, M. (2017). An evaluation of the influence of haptic feedback on gaze behavior during in-car interaction with touch screens. In M. Otaduy, J.-H. Ryu, & G. Gerling (Eds.), 2017 IEEE World Haptics Conference (WHC): 6-9 June 2017 (pp. 201–206). Piscataway, NJ: IEEE. https: //doi.org/10.1109/WHC.2017.7989901 Farooq, A., Evreinov, G., & Raisamo, R. (2019). Reducing driver distraction by improving secondary task performance through mul- timodal touchscreen interaction. SN Applied Sciences, 1(8), 242. https://doi.org/10.1007/s42452-019-0923-4 Feng, F., Liu, Y., & Chen, Y. (2017). Effects of Quantity and Size of Buttons of
In-Vehicle Touch Screen on Drivers’ Eye Glance Behavior. International Journal of Human–Computer Interaction, 34(12), 1105–1118. https://doi.org/10.1080/ 10447318.2017.1415688 Field, A., Miles, J., & Field, Z. (2012). Discovering statistics using R. Los Angeles, London, New Delhi, Singapore, Washington, DC: Sage. Gordon, M. L., & Zhai, S. (2019). Touchscreen Haptic Augmentation Effects on
Tapping, Drag and Drop, and Path Following. In S. Brewster, G. Fitzpatrick, A. Cox, V. Kostakos, & A. L. Cox (Eds.), CHI 2019: Proceedings of the 2019 CHI Conference on Human Factors in Computing Systems : May 4–9, 2019, Glasgow, Scotland, UK (pp. 1–12). New York, New York: The Association for Computing Machinery. https://doi.org/10.1145/3290605.3300603 Harrington, K., Large, D. R., Burnett, G., & Georgiou, O. (2018). Exploring the Use of Mid-Air Ultrasonic Feedback to Enhance Automotive User Interfaces. In A. S. I. G. o. C.-H. Interaction (Ed.), Proceedings of the 10th International Conference on Automotive User Interfaces and Interactive Vehicular Applications (pp. 11– 20). [Place of publication not identified]: ACM. https://doi.org/10.1145/3239060. 3239089 Harvey, C., Stanton, N. A., Pickering, C. A., McDonald, M., & Zheng, P. (2011). To
twist or poke? A method for identifying usability issues with the rotary controller and touch screen for control of in-vehicle information systems. Ergonomics, 54(7), 609–625. https://doi.org/10.1080/00140139.2011.586063 Large, D. R., Burnett, G., Crundall, E., Lawson, G., & Skrypchuk, L. (2016). Twist It, Touch It, Push It, Swipe It. In P. Green, B. Pfleging, G. Burnett, J. Gabbard, & S. Oswald (Eds.), ACM Digital Library, Automotiveui 2016, 8th International Conference on Automotive User Interfaces and Interactive Vehicular Applicati- ons: In-cooperation with ACM SIGCHI : October 24-26, 2016, Ann Arbor, MI, USA : Proceedings (pp. 161–168). New York, NY: ACM. https://doi.org/10.1145/ 3003715.3005459 Nissan Motor Corporation (2010). Nissan Juke. Retrieved from https://www.nissan
-global.com/EN/NISSAN/JUKE/ NKK Switches of America, Inc. (2021). Human-Machine Interface Products and Custom Engineered Solutions. Retrieved from https://www.nkkswitches.com/ Pitts, M. J., Burnett, G., Skrypchuk, L., Wellings, T., Attridge, A., & Williams, M. A.
(2012). Visual–haptic feedback interaction in automotive touchscreens. Displays, 33(1), 7–16. https://doi.org/10.1016/j.displa.2011.09.002 Pitts, M. J., Skrypchuk, L., Wellings, T., Attridge, A., & Williams, M. A. (2012).
Evaluating User Response to In-Car Haptic Feedback Touchscreens Using the Lane Change Test. Advances in Human-Computer Interaction, 2012(1), 1–13. https://doi.org/10.1155/2012/598739 Saffer, D. (2007). Designing for interaction: Creating smart applications and clever devices. Voices that matter. Berkeley, Calif.: New Riders.
Salmon, P. M., Lennè, M. G., Triggs, T., Goode, N., Cornelissen, M., & Demczuk, V.
(2011). The effects of motion on in-vehicle touch screen system operation: A battle management system case study. Transportation Research Part F: Traffic Psychology and Behaviour, 14(6), 494–503. https://doi.org/10.1016/j.trf.2011. 08.002 Schmidt, D., Block, F., & Gellersen, H. (2009). A Comparison of Direct and Indirect Multi-touch Input for Large Surfaces. In T. Gross, J. Gulliksen, P. KotzÈ, L. Oestreicher, P. Palanque, R. O. Prates, & M. Winckler (Eds.), Lecture Notes in Computer Science. Human-Computer Interaction – INTERACT 2009 (Vol. 5726, pp. 582–594). Berlin, Heidelberg: Springer Berlin Heidelberg. https://doi.org/10. 1007/978-3-642-03655-2_65 Schölkopf, L., Kneuper, A., Hutmann, V., & Diermeyer, F. (2021). Methods for Redu-
cing the Complexity of Driving Workplaces in Commercial Vehicles. In N. Stanton (Ed.), Lecture Notes in Networks and Systems. Advances in Human Aspects of Transportation (Vol. 270, pp. 34–44). Cham: Springer International Publishing. https://doi.org/10.1007/978-3-030-80012-3_5 Schölkopf, L., Wolf, M.-M., Hutmann, V., & Diermeyer, F. (2021). Conception, Development and First Evaluation of a Context-Adaptive User Interface for Com- mercial Vehicles. In 13th International Conference on Automotive User Interfaces and Interactive Vehicular Applications (pp. 21–25). New York, NY, USA: ACM. https://doi.org/10.1145/3473682.3480256 Stevens, A., Quimby, A., Board, A., Kersloot, T., & Burns, P. (2002). Design
Guidelines for Safety of In-Vehicle Information Systems. Thomasen, F. (2020, December 9). First of a new breed: Ford Mustang Mach-E ready to accelerate zero-emission driving thrills and bring on tomorrow. Retrie- ved from https://media.ford.com/content/fordmedia/feu/en/news/2020/12/09/firs t-of-a-new-breed--ford-mustang-mach-e-ready-to-accelerate-ze.html Tunca, E., Fleischer, R., Schmidt, L., & Tille, T. (2016). Advantages of Active
Haptics on Touch Surfaces. In P. Green, B. Pfleging, G. Burnett, J. Gabbard, & S. Oswald (Eds.), ACM Digital Library, Automotiveui 2016, 8th International Conference on Automotive User Interfaces and Interactive Vehicular Applicati- ons: In-cooperation with ACM SIGCHI : October 24-26, 2016, Ann Arbor, MI, USA : Proceedings (pp. 137–144). New York, NY: ACM. https://doi.org/10.1145/ 3003715.3005406 Van der Laan, J. D., Heino, A., & Waard, D. de (1997). A simple procedure for the assessment of acceptance of advanced transport telematics. Transportation Rese- arch Part C: Emerging Technologies, 5(1), 1–10. https://doi.org/10.1016/S0968- 090X(96)00025-3 Walthart, G. (2021, January 7). EQS with unique MBUX Hyperscreen: the big in-car
cinema. An assistant for the driver and front passenger who is constantly learning, thanks to artificial intelligence. Retrieved from https://media.daimler.com/mars MediaSite/ko/en/48584064 Weddle, A., & Yu, H. (Juni 2013). Confirmation Haptics for Automotive Interfaces: Cadillac CUE User Study. San Jose California. Winner, H., Hakuli, S., Lotz, F., & Singer, C. (2015). Handbuch Fahrerassistenzsy-
steme. Wiesbaden: Springer Fachmedien Wiesbaden. https://doi.org/10.1007/978- 3-658-05734-3 Zimmermann, S., R ˙melin, S., & Butz, A. (2013). I feel it in my fingers. In A. Butz (Ed.), Proceedings of the 8th International Conference on Tangible, Embedded and Embodied Interaction (pp. 9–12). New York, NY: ACM. https://doi.org/10. 1145/2540930.2540938
LISTED IN THE AHFE DIGITAL BOOKSTORE CATALOGUE
Explore the complete digital volume
Human Factors in Transportation
Read this individual research paper free through the original publisher, or explore the full digital proceedings book.
ISBN 978-1-958651-36-0
Explore this ISBN in the AHFE Bookstore ↗Listed in the July 2026 bookstore catalogue; search by ISBN to confirm current availability · Digital book purchase optional