Konomu Dobashi (2022). Development of a Method to Visualize the Approximate Synchronization Ratio of a Teaching Material Clickstream in Class. In: Training, Education, and Learning Sciences. AHFE Open Access, vol. 59, pp. 109–115. https://doi.org/10.54941/ahfe1002390
This study proposes a method for a large number of university students to analyze the synchronization ratio in opening teaching materials in classes using Moodle learning management system (LMS) and online teaching materials. Furthermore, this research analyzes the results in terms of both educational technology and ergonomics and discusses the improvement in the interaction between teachers and learners. Learners’ reactions are influenced not only by the teacher's instructions, but also by various factors such as the quality of the content, the method of presenting the teaching materials, the performance of the software, and the performance of the monitor screen. Therefore, using the proposed method, the analysis was limited to the clickstream of the teaching material accumulated in the LMS. The time-series cross-section displays the synchronization ratio of teaching materials in the class in graphs and tables at intervals of between 1 and 5 minutes. Moreover, since the synchronization ratio is based on the time-series cross-section for each learner, one can observe the synchronized learners, the learners who open the teaching materials late, and the learners who never open the teaching materials.
Since there are various educational goals and methods, there are many situa- tions where real-time synchronization is required in the interaction between teachers and learners. Regardless of the learner’s age or the type of educati- onal institution, teachers must grasp individual learners’ reactions in order to proceed smoothly with the lesson. Previously, in a large class, it was reco- gnized that it was a difficult task even for a skilled teacher to properly grasp the behavior and reaction of the learner. However, with the development of LMS and the understanding of how to use them, it is becoming possible to partially grasp and analyze learning behavior individually, even with a large number of learners in a class (Arnold and Pistilli, 2012). Therefore, in this study, the Moodle LMS was used to check the synchronization between a
teacher’s instructions and the learners’ reactions, and the learning logs for the teaching materials were collected.
It is also necessary to be able to grasp the mode of synchronization that reflects the passage of time and analyze it in real-time. The lessons in this paper were conducted in a computer classroom, and the teaching materials were uploaded to the Moodle LMS. The synchronization ratio of viewing tea- ching materials according to the teacher’s instructions is discussed for classes where university students learn the basics of data science using the spreadsh- eet software Excel. In this class, it is necessary to adjust the progress speed of the lesson so that the whole class is synchronized as much as possible, and the instructor must always pay attention to the learners’ behavior.
Related Research In recent years, LMS such as Moodle have been actively used, and efforts are being made to analyze the learning logs. Due to the Coronavirus 2019 (COVID-19) pandemic, many educational institutions have conducted dista- nce learning. This has increased the importance of LMS in distance learning, and research analyzing accumulated learning logs has become more and more active. Many studies have analyzed learning logs and have used them to improve education (Romero and Ventura, 2020), which is also the purpose of this paper. Research analyzing learning logs is evolving primarily in the areas of Educational Data Mining (EDM) and Learning Analytics (LA) (Blikstein and Worsley, 2016; Namoun and Alshanqiti, 2021; Ray and Saeed, 2018; Viberg et al. 2018). In the field of education, many dashboard studies have also been conducted on themes such as applying data mining and visualiza- tion technology, monitoring the progress of learning, and tracking learning behavior (Bodily et al. 2018; Verbert et. al. 2013; Vieira, Parsons and Byrd, 2018). In addition, Nguyen et al. proposed the development of a system for integrating learning analytics functions into existing information systems and dashboards and developed a system for visualizing learner involvement (Nguyen, Rienties and Whitelock, 2022).
Course Signals is a system developed at Purdue University that individu- ally predicts students’ grades from data and test scores stored in Blackboard LMS. Warning signals colored according to traffic signals are posted on the students’ homepages to draw their attention and prevent stumbling blocks in their learning (Arnold and Pistilli, 2012). Shimada et al. developed a real-time lecture support system, conducted lessons using the Moodle LMS and e-book system, analyzed the learning logs of teachers and learners in real-time, and conducted research to provide feedback during the lesson. With their system, the heat map displayed on the teacher’s computer showed the synchroniza- tion status of the material browsing, showing that the teacher could adjust the speed of the lecture (Shimada, Konomi and Ogata, 2018).
LEARNING LOGS AND LESSON OUTLINE Experimental Environment and Teaching Materials
A learning log is influenced by various factors such as how to proceed with the lesson and its teaching materials. When analyzing it, it is necessary to
Development of a Method to Visualize the Approximate Synchronization Ratio 111
clarify the experimental environment as much as possible. Although this paper is mainly aimed at classes conducted in computer classrooms, Moodle is also used to distribute teaching materials online, so the method presen- ted in this paper can also be applied to learners who take distance lessons at home. This section outlines the teaching materials used to collect learning logs, how the lessons proceeded, and the experimental environment. The class covered in this paper is a subject called “China Data Analysis”. Classes were held 15 times over 120 days from September 14, 2021, to January 11, 2022. There were 55 students enrolled in the class, 45.5% of whom were female and 54.5% of whom were male. The number of registrants was mixed from the 1st school year to the 4th school year: the ratio was 25.45% for the 1st school year, 10.91% for the 2nd school year, 47.27% for the 3rd school year, and 16.36% for the 4th school year. The purpose of this class is to use the data from the Chinese Statistical Yearbook published on the web to learn the basics of statistics. In the semester, the students mainly learn how to ope- rate Excel, including graphing, mean, deviation, variance, standard deviation, moving average, pivot table, frequency distribution, etc.
Link Structure and Section Transitions The teaching materials were created for half a year of the university course and consisted of 13 chapters, with 95 sections and 183 total pages, and a PDF file was created to upload to Moodle for each section. The number of sections per chapter was 7.3, and the number of pages per section was 1.9. The author created 13 chapters and 95 sections in topic mode in Moodle and entered the name of each chapter and the name of the section. The link to the teaching material sends the learner to the first page of each section, that is, to the section transition. Therefore, when they move the page within the section, they must move the page or thumbnail of the PDF file displayed on the web browser up and down. In addition, all links to the materials are provided on the course gateway page, so if the learner wants to move to another section, they need to go back to the entry page and click the destination section from there. For the clickstream that is the subject of analysis in this paper, only the clicks opening the teaching materials used in the lesson were extracted and analyzed.
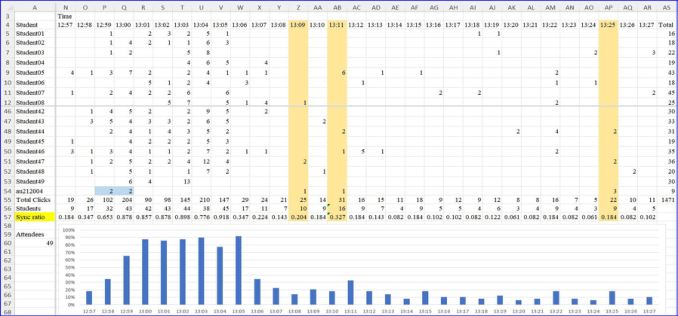
EXPERIMENT In this section, we provide an example to visualize the synchronization ratio with a time-series cross-section and a graph from the lessons held in the fall semester of 2021. The synchronization ratio was calculated by dividing the number of people who opened the teaching materials by the number of atten- dees (49 learners) present that day. Figure 1 shows a bar graph created by aggregating the clicks of section transitions every minute and calculating the synchronization ratio. Schedules and graphs can be created not only every 1 minute, but also every 2 minutes, 3 minutes, 4 minutes, and 5 minutes. Due to the limited space in this paper, Figure 1 is divided into four screens, the parts necessary for writing this paper are colored manually by the author, and explanations are provided in Excel balloons.
112 Dobashi
Figure 1: Example table and graph showing time-series cross-sections and synchroni- zation ratios for section transitions (Minute-by-minute, 2021/11/2, China data analysis, 49 attendees).
Column A in Figure 1 shows the anonymized learner’s ID, and column B (hidden in the table) to column AR show a summary of section transitions. The fourth row at the top of the screen is an example displaying the time every minute. Cells containing a number indicate how often the teaching material was opened. The rightmost AS column shows the total number of clicks until 13:27, and the 56th row at the bottom of the table shows the number of learners who opened the material. Furthermore, the synchronization ratios calculated in 57th row are shown, which are the original data for the bar graph. After the quiz, the author opened the teaching materials at 13:06 and proceeded with the lesson, but the colored three columns (Z, AB, and AP) in the table show when the author opened the teaching materials on the com- puter of the teacher’s desk and instructed the learners and the time when the commentary started. Cells P54 and Q54 show when the author (cell A54, au212004) opened the table of contents of the course and the entrance to the quiz in preparation for the lesson.
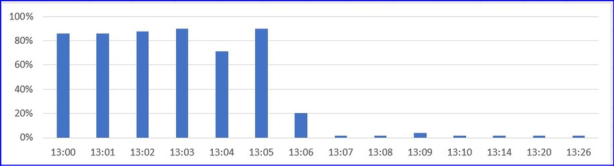
Since the quiz was given at the beginning of the lesson, many learners were synchronized at that time, so high numbers are displayed in the tables and graphs. The time limit was 5 minutes, and the higher end value for the quiz in the bar chart refers to when learners clicked to open the quiz score confir- mation page. Classes started at 13:00, but Figure 1 shows tables and graphs from 3 minutes before the class started (12:57) until 13:27. Additionally, since the synchronization ratio can be calculated for each teaching material, Figure 2 shows a graph for only the clickstream of the quiz. Figure 2 was created manually from the original data in Figure 1. It can be seen that about 30% of the learners completed the quiz just before the end of the allotted time (13:04). In addition, it can be seen that about 90% of the learners viewed the results immediately after the quiz, and after that, several people opened the quiz page by 13:26.
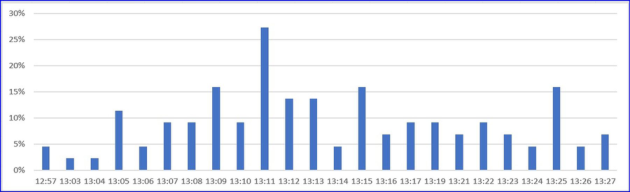
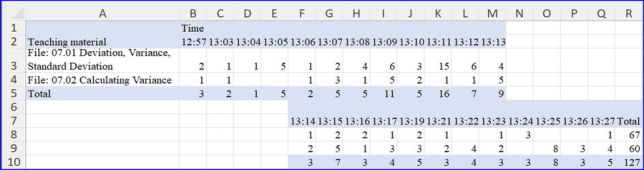
Below, a graph of the synchronization ratio of only the teaching materi- als used in one day (see Figure 3) and a time-series cross-section of section transitions (see Figure 4) are shown. In Figure 3, it can be seen that some
Development of a Method to Visualize the Approximate Synchronization Ratio 113
Figure 2: Synchronization ratio for the quiz (minute-by-minute, 2021/11/2, China Data Analysis).Figure 3: Example of synchronization ratios for section transitions of teaching materials (minute-by-minute, 2021/11/2, China Data Analysis).Figure 4: Example of time-series cross-section of section transitions by teaching mate- rial (minute-by-minute, 2021/11/2, China Data Analysis; the columns that do not display the time indicate that there is no clickstream at that time.).
learners opened the teaching items scheduled to be used on that day during the quiz (13:03, 13:04), and these bar graphs can also be confirmed by the numerical values in Figure 4. In addition, the values for 13:11 (column AB) and 13:25 (column AP) in Figure 3 are higher than the values before and after. These are the times when the author opened the teaching material and instructed the learners, and it can be seen that the synchronization ratio is slightly higher at these times. On the day of the lesson, the first half of the lesson was conducted using the teaching materials in two sections: “07.01 Deviation/Variance/Standard Deviation” and “07.02 Calculating Variance” (see Figure 4).
From Figure 4, it can be seen that at 13:11, 15 learners opened and synch- ronized the “07.01 Deviation/Variance/Standard Deviation” material. The “07.02 Calculating Variance” material was opened by the author at 13:25, and in Figure 4, it can be seen that many learners had already opened this material before this time, and only eight learners were in sync with the author’s instructions. The value in the bar graph is high at 13:15, but this was
114 Dobashi
because five people opened the latter teaching material. In class, the use of the “07.01 Deviation/Variance/Standard Deviation” teaching material occurred until around 13:25, and after that, it can be seen that the class moved to the “07.02 Calculating Variance” teaching material.
DISCUSSION
In Figure 1, data are aggregated at 1-minute intervals, but if the intervals are lengthened to 2 minutes or 3 minutes, the synchronization ratio will naturally increase. However, the scattered details could then become lost and invisi- ble, which can lead to overlooking learners who open the material after the teacher’s instructions. On the contrary, the interval can be shortened, for example, to 30 seconds, which will decrease the synchronization ratio. How- ever, the scattered details will become easier to see, increasing the chances of finding out-of-sync learners. In engagement studies, learning behavior rela- ting to opening materials is considered to be one of the factors that directly influence test scores (Steinmayr et al. 2019), and it is important to set the inte- rval appropriately when considering correlations with the synchronization ratio.
Since the time-series in this paper is divided by clock time, even a difference of 10 seconds or less from the teacher’s instruction may be included in the adjacent time range. This makes it difficult to consider synchronization by strictly dividing the time-series by the elapsed time. In addition, since the teaching materials may be opened by prereading the teacher’s instructions, time ranges must be considered until just before the instructed time. Deciding how to divide the time-series depends on the content of the lesson and how to proceed, but it seems necessary to proceed with the lesson flexibly while using an interval of about 1 to 3 minutes. Shimada et al. give an example of a lecture-style class using an e-book in which the synchronization ratio could be increased if the instruction speed is adjusted by teaching while looking at a heat map showing the degree of concentration of the learners (Shimada et al. 2018). The author recommends that learners open the Moodle and Excel screens at the same time and use split-screen view. However, there are many learners who open teaching materials and Excel on full-screen view. When the learner opens Excel in full screen, it seems that there is a difference in the time spent browsing the teaching materials, but the learners’ use of full-screen view did not decrease even if the author intervened. Both the author and the student wanted to operate the personal computer on a widescreen.
CONCLUSION
In the example given in this paper, the synchronization ratio of the reading materials can explain some of the learners’ behaviors, but further analysis is needed to investigate the relationship with other factors such as grades. However, since the synchronization ratio can be observed in real-time during the lesson, it is possible to adjust the progress speed of the lesson according to the students and to advise students who are behind.
Development of a Method to Visualize the Approximate Synchronization Ratio 115
ACKNOWLEDGMENT
This work was supported by JSPS KAKENHI Grant Numbers 18K11588 and 21K12183.
REFERENCES
Arnold, K. E. and Pistilli, M. D. (2012), “Course signals at Purdue: Using learning analytics to increase student success”, Proceedings of the 2nd international conference on learning analytics and knowledge, pp. 267–270. Bidwell, J. and Fuchs, H. (2011), “Classroom analytics: Measuring student engage-
ment with automated gaze tracking”, Behav Res Methods, 49(113). Blikstein, P. and Worsley, M. (2016), “Multimodal learning analytics and education data mining: Using computational technologies to measure complex learning tasks”, Journal of Learning Analytics, Volume 3 No. 2, pp. 220–238. Bodily, R., Kay, J., Aleven, V., Jivet, I., Davis, D., Xhakaj, F. and Verbert, K. (2018,
March), “Open learner models and learning analytics dashboards: a systematic review”, Proceedings of the 8th international conference on learning analytics and knowledge, pp. 41–50. Namoun, A. and Alshanqiti, A. (2021), “Predicting student performance using data mining and learning analytics techniques: A systematic literature review”, Applied Sciences, Volume 11 No. 1, 237. Nguyen, Q., Rienties, B. and Whitelock, D. (2022), “Informing learning design in
online education using learning analytics of student engagement”, Open World Learning: Research, innovation and the challenges of high-quality education, pp. 189–207. Ray, S. and Saeed, M. (2018), “Applications of educational data mining and learning analytics tools in handling big data in higher education”, Applications of big data analytics, pp. 135–160. Romero, C. and Ventura, S. (2020), “Educational data mining and learning analy-
tics: An updated survey”, Wiley Interdisciplinary Reviews: Data Mining and Knowledge Discovery, Volume 10 No. 3, e1355. Shimada, A., Konomi, S. I. and Ogata, H. (2018), “Real-time learning analytics system for improvement of on-site lectures”, Interactive Technology and Smart Education, Volume 15 No. 4, pp. 315–331. Srivastava, N., Nawaz, S., Newn, J., Lodge, J., Velloso, E., M. Erfani, S. and Bailey,
J. (2021, April), “Are you with me? Measurement of learners’ video-watching attention with eye tracking”, LAK21: 11th International Learning Analytics and Knowledge Conference, pp. 88–98. Steinmayr, R., Weidinger, A. F., Schwinger, M. and Spinath, B. (2019), “The importance of students’ motivation for their academic achievement–replicating and extending previous findings”, Frontiers in psychology, Volume 10, 1730. Viberg, O., Hatakka, M., Bälter, O. and Mavroudi, A. (2018), “The current land-
scape of learning analytics in higher education”, Computers in Human Behavior, Volume 89, pp. 98–110. Verbert, K., Duval, E., Klerkx, J., Govaerts, S. and Santos, J. L. (2013), “Learning analytics dashboard applications”, American Behavioral Scientist, Volume 57 No. 10, pp. 1500–1509. Vieira, C., Parsons, P. and Byrd, V. (2018), “Visual learning analytics of educati-
onal data: A systematic literature review and research agenda”, Computers & Education, Volume 122, pp. 119–135. https://doi.org/10.1016/j.co
LISTED IN THE AHFE DIGITAL BOOKSTORE CATALOGUE
Explore the complete digital volume
Training, Education, and Learning Sciences
Read this individual research paper free through the original publisher, or explore the full digital proceedings book.
ISBN 978-1-958651-35-3
Explore this ISBN in the AHFE Bookstore ↗Listed in the July 2026 bookstore catalogue; search by ISBN to confirm current availability · Digital book purchase optional