Ran Guo, Yi Ding, Yaqin Cao (2022). The Use of physiological measurement for user experience Assessment: A Bibliometric Analysis. In: Usability and User Experience. AHFE Open Access, vol. 39, pp. 185–193. https://doi.org/10.54941/ahfe1001707
This paper aims to use a quantitative and visual method to evaluate the history, current, and future of publications regarding physiological measurement for user experience (UX). Since UX has attracted the attention of many disciplines, this field has accumulated numerous research outcomes. Therefore, it is important and timely to make a systematic and comprehensive evaluation of the research output of UX over the last decades. Citespace was used to identify and summarize the publications from WoS from 2010 to 2021. The publication time, country, institution, and author distribution of user experience physiological measurement were recorded and analyzed. Bibliometric maps of authorship, citation, co-citation, and network of co-occurrence of keywords are drawn. The research found that: (1) The international physiological measurement of user experience has gradually developed since 2010, and now it has become a topic of focus for scholars. (2) User experience physiological measurement involves a wide range of disciplines, with engineering and computational science as the main disciplines undertaking important tasks. (3) Physiological measurement of user experience will be more used in VR, AR, and adaptive aging in the future. This study provided later researchers with ideas on the physiological measurement of user experience.
At present, China’s Ministry of Industry and Information Technology issued the Notice on Promoting Information and Communication Service Perce- ption (hereinafter referred to as the Notice) that is also called the “524 Action”. The “524” campaign is aimed at improving UX (The Notice on Promoting Information and Communication Service Perception.2021). Thus, UX is an important part that we can’t ignore.
Researchers have done relevant research on UX, and the content of UX is constantly enriched. Donald Norman thought that a good UX needed to meet the following three points: First, meeting the needs of consumers was done without disturbing or boring users; Second, users are happy to use the products you provide; Third, give extra surprises to consumers (Miller et al. 1994). ISO 9214-210 defined UX as the result of all reactions to the use or expected use of products, systems or services (ISO 9241-210.2009).
With the in-depth study of UX, some scholars began to study UX physio- logical measurement. UX measurement has been measured by questionnaire, namely PrEmo scale (Russell. 1974), PAD scale (Desmet. 2004), Likert scale (Hassenzahl. 2001) and usability evaluation scale (Likert. 1932). The que- stionnaire measurement is subjective, so scholars began to use physiological measurement to study it. Mandryk researchers selected eye movement, skin electricity, ECG, EMG, breathing speed and breathing amplitude as indica- tors to evaluate UX (Mandry et al. 2006). P. Books team found that compared with subjective measurement methods, objective measurement methods are popular among researchers (Brooks et al. 2010). Shi team tested 9 subjects through physiological measurement methods of PPG and EDA and determi- ned the user’s visual comfort threshold under natural light in the gymnasium (Shi et al. 2021). In order to study the e-learning portal for college students, Zardari, Baqar Ali team tracked the objective data of users with the eye tra- cker (Tobii X-30 Hz) to reveal the usability of the portal (Ali et al. 2020). Jiang, MY, and others participated in a study on the usability of the ventila- tor user interface through 16 respiratory therapists and used eye movement methods to evaluate and found that a physiological measurement is a reli- able tool for evaluating the usability of the ventilator user interface (Jiang et al. 2020). As a result, more and more researchers have begun to pay increasingly significant attention to UX physiological measurement.
In this paper, the literature related to UX physiological measurement is sorted out by bibliometric method, and the basic status, hot spots, and development trend of UX physiological measurement are analyzed.
METHODOLOGY
This paper studies the hotspot and development trend of user experience physiological measurement and selects the core database of the web of sci- ence as the sample (from January 2010 to November 2021).“TS =” user experience “and” TS = “physical measurement” or “physiological measu- rement” or “EDG” “or” ECG “or “EMG” “or” FNRS “or “eye tracking” used as the retrieval subject words, and the retrieval subject field contains the phrase“ user experience ”. Finally, 788 articles related to the physiological measurement of UX were obtained.
Bibliometrics has been widely used in academic circles to analyze research hotspots and research trends in a certain field. In this paper, CiteSpace sof- tware is used to visually analyze the publishing time, authors, institutions, countries and regions, co-citation, and keyword functions of 788 collected kinds of literature.
RESULTS AND DISCUSSION
Number of Publications and Journal Source According to statistics, a descriptive statistical analysis related to the physiological measurement of UX from 2010 to 2021 is obtained. Engineering (26.616%), Computer Science (25.475%), and Health Care Sciences Services (10.646%) are the top three disciplines in terms of the
The Use of Physiological Measurement for User Experience Assessment 187
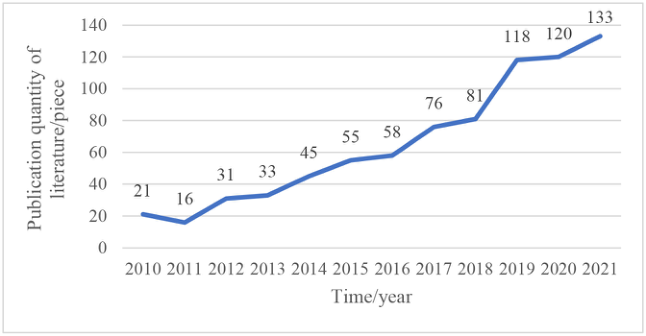
Figure 1: The numbers of annual publications in UX physiological measurement during 2010–2021.
number of published articles of UX physiological measurement. By con- trast, Rehabilitation (8.492%),Medical Informatics (7.731%), Neurosci- ences Neurology (6.971%), Public Environmental Occupational Health (6.464%), Psychology (5.577%), Psychiatry (5.196%), and Chemistry (5.070%) rank lower in the number of published articles on physiologi- cal measurement of UX. On the whole, the number of publications in this field continues to increase, from a few publications in 2010 to hundreds of publications per year.
We also analyzed the contribution of journals. PLOS ONE (175 articles) and LECT NOTRES COMPUTE SC (153 articles) account for 22.29% and 19.49% of all journals, respectively, ranking first and second. ARCH PHYS MED REHAB (96), COMPUTEHUM VEHAV (93), J MED INTERNET RES (92), int J Hum-COMPUTEST (90), JAMA-J AM MED ASSOC (88), PSYCHOL BULL (88), LANCET (86 articles) and BMJ-BRIT MED J (79 articles) accounted for 12.29%, 11.85%, 11.72%, 11.46%, 11.21% and 11.21% of all journals, respectively, and the published papers were relatively small. CiteSpace (Betweenness Centrality) discovers and measures the impor- tance of nodes through intermediary centrality, which means that one node in the network is the “intermediary” of other nodes (Li et al. 2017). PLOS ONE and LECT NOTRES COMPUT SC rank the first and the second (the centrality score are 0.12 and 0.09), which means great contribution of these journals in these field.
Co-Authorship Analysis The survey found that more than 70 countries study the physiological mea- surement of UX. USA (226), England (131), Australia (64), China (64), and Germany (59) are the top five productive countries, followed by Canada (57), Netherlands (48), Spain (35), Italy (30) and Switzerland. The number of USA publications is far ahead of other countries, and it plays a supporting role in the user’s experience of physiological measurement.
Table 1. Number of articles issued by authors.
Table available in the original PDF paper.
Rank Author Total publications 1 WILLIAM C MILLER 5 2 FU GUO 4 3 FRANCOIS ROUTHIER 4 4 BRODIE M SAKAKIBARA 4 5 ABBY C KING 3 6 ALLEN W HEINEMANN 3
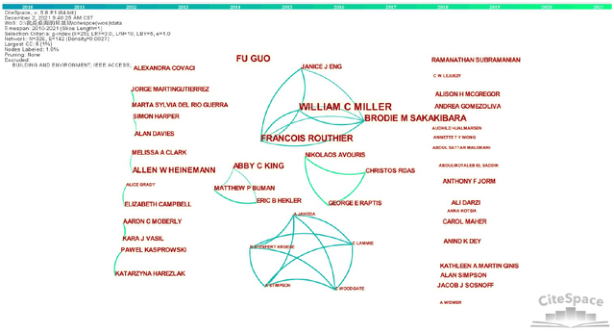
Figure 2: Network on co-authorship of UX physiological measurement.
The number one publication is UNIV BRITISH COLUMBIA (19 arti- cles), Followed by UNIV MANCHESTER (15 articles), NORTHEASTERN UNIV (13 articles), KINGS COLL LONDON (12 articles), UNIV WASH- INGTON (12 articles), STANFORD UNIV (11 articles), UNIV EXETER (10 articles), UNIV MELBOURNE (10 articles), and UNIT NOTTINGHAM (10 articles). The institutional distribution of literature reflects the spatial distribution of research to a certain extent, which is helpful for scholars to quickly identify and understand the main research groups in this resea- rch field (Zhao et al. 2019). It has already occupied a dominant position in USA and England, and UNIV BRITISH COLUMBIA has become the main research group in this field with the first number of publications.
Further study the relationship between author networks. This paper analy- zes the collinear network of the author by using CiteSpace, as shown in Figure 2. The size of nodes in the figure shows the number of posts sent by authors, and the connection between nodes indicates the cooperative rela- tionship with others (Wang et al. 2021). According to table 1, MILLER (5 articles) is the first author, followed by GUO, ROUTHIER, SAKAKIBARA with 4 articles each, KING with 3 articles, and HEINEMANN with 3 articles. MILLER, ROUTHIER, SAKAKIBARA studied the same theme, considering the reliability of wheelchair use of the elderly from two perspectives of user physiological measurement and user evaluation. GUO pays more attention to
The Use of Physiological Measurement for User Experience Assessment 189
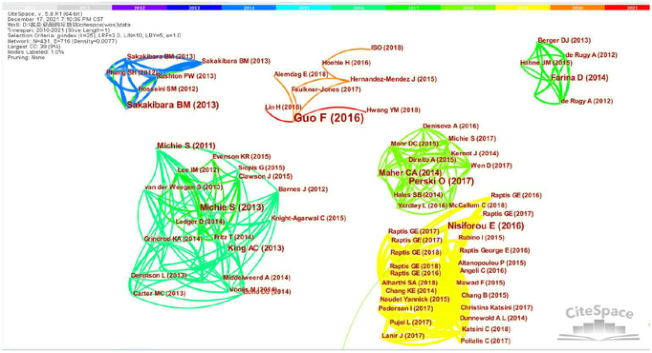
Figure 3: Co-citation network 3.4 research trends analysis.
the way users experience physiological measurement and considers the influ- ence of eye movements on users to improve product design. KING studies the influence of mobile devices on the sedentary behavior of the elderly. Hei- nemann pays attention to the UX in the medical and health field. Figure 2 shows that MILLER, ROUTHIER, SAKAKIBARA have formed a research cooperation network, and MILLER is the center of the research team. KING, BUMAN, HEKLER also formed a small research cooperation network. In general, in the field of physiological measurement of UX, the cooperation among authors is 2 to 3 people, which is the cooperation among small teams and does not form a cluster cooperation network.
Co-citation Network In 1973, literature citation means that two documents appear together in the reference of the third cited document, then the two documents form a co- cited relationship (Li et al. 2017).In this paper, 785 pieces of literature were retrieved from the core database of the WoS. And the co-citation network of physiological measurement of user experience was shown in the figure 3. The color and size of nodes in the graph indicate the time sequence of cited documents and the frequency of cited kinds of literature, respectively, and the connection between nodes indicates the mutual citation strength between documents.
The top-ranked paper by co-citation count is written by Fu Guo (Guo et al. 2016). It is described that in the process of product design, besides considering the data of eye movements, visual attention mechanism is also needed. Identifying how the differences of users’ cognitive styles are reflected in the eye gaze mode, Nisiforou provides evidence and a theoretical basis for the application of human-computer interaction in user-centered design (Nisiforou et al. 2015). Brodie discusses the influence of wheelchair skill training on the confidence of the elderly who lack wheelchair experience (Brodie et al. 2013). It also presents a meta-analysis of these presence models,
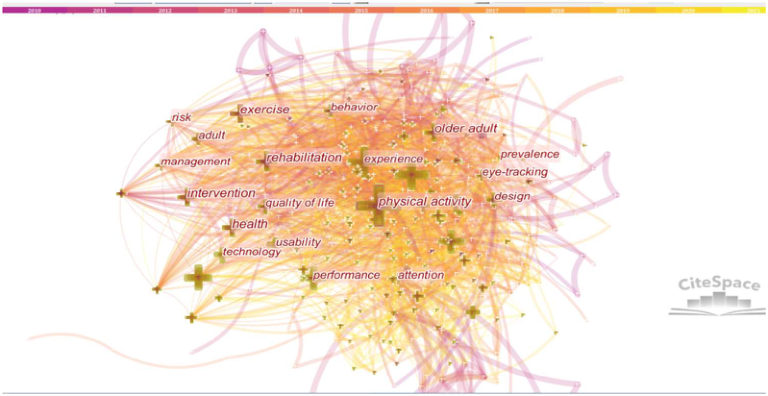
Figure 4: Collinear network of co-occurrence of author keywords.Table 2. Co-occurrence of author keywords of UX physiological measurement.
identifying commonalities between them and presenting a new model infor- med by Slater’s Place Illusion and Plausibility Illusion. We conclude with a review of existing presence measures, presenting and commenting on many of the self-report, behavioral, physiological, and psychophysical measures that have appeared in the VE literature (Richard et al. 2018). Abby focu- ses on adults aged 45 and over who lack enough physical activity, and pays attention to the effect of health improvement by participating in the itera- tive design development and feasibility test of three smartphone applications for daily activities based on the motivation framework of behavioral science theory and evidence (Abby et al. 2013).
Research Trends Analysis The keyword is a high-level summary of the theme of the paper, and the frequ- ently appearing keywords reflect the research hotspots in this field during this
The Use of Physiological Measurement for User Experience Assessment 191
period (Yang. 2019). Based on 787 literature in the WoS, we use CiteSpace software to analyze keywords collinearly and list high-frequency keywords, as shown in Figure 4 and Table 2.
According to CiteSpace analysis, there are 29 keywords whose freque- ncy exceeds 20 times, and 17 keywords whose frequency exceeds 30 times. The top ten high-frequency keywords are listed in Table 2. The node size represents the co-occurrence intensity of keywords (Figure 4). According to Table 2 and Figure 4, Physical activity, Eye-tracking Experience, Rehabilita- tion, and Virtual Reality are the top 4 keywords with most co-occurrence, which shows that these topics are the new research hotspot in this field.
CONCLUSION
In this paper, CiteSpace visualization software is used to analyze the literature related to UX physiological measurement in the core database of the WoS. In addition, the research hotspots and trends of UX physiological measurement are analyzed by literature co-citation analysis and co-occurrence analysis of keywords.
The UX physiological measurement is still developing, and it will reach a stable and mature stage in the next few years. At present, user physiological measurement is divided into two stages: the first stage is the initial stage from 2010 to 2013, and the second stage is the development stage from 2014 to 2021. With the passage of time and the development of technology, the physi- ological measurement of UX will become a hot topic of increasing concern in academic and business circles, so the physiological measurement of UX will be further developed, and will become stable and mature in the near future.
The UX physiological measurement should put aside the distinction betw- een national boundaries and universities, and strengthen the cooperation among scholars. At present, England and USA occupy a certain dominant position in the research of physiological measurement of UX. On the whole, the research in this field in the USA is more prominent, but the research in this field in UNIV BRITISH COLUMBIA in Canada is very prominent, which shows that UNIV BRITISH COLUMBIA has outstanding strength in UX physiological measurement. However, the cooperation among authors is scat- tered and small group-based research and has not formed standardized and large-scale cooperation. Therefore, strengthening cooperation and commu- nication among scholars will promote the development of UX physiological measurement.
The UX physiological measurement have begun to pay increasingly impor- tant role in product problems solved human-centered. At present, a large number of publications study to solve the product problems of human- centered. Eye movements and visual attention are used to improve product design (Guo et al. 2016) . The elderly who lack wheelchair experience trai- ned the confidence to enhance wheelchair skill (Brodie et al. 2013). To sum up, UX physiological measurement is still to solve the problem of human-centered in the process of human-computer interaction.
The development of UX physiological measurement: (1) Pay more atten- tion to the physiological changes of users in product design and product
model from the user’s perspective, and use physiological measurement meth- ods such as skin electricity, ECG, eye movement, and so on. (2) With the development of the aging population, the proportion of the elderly population is increasing, and the elderly population becomes the focus of experience research, so more and more elderly people are chosen as the rese- arch object. (3) Users experience physiological measurement in the field of technical application, paying more attention to the application of AR, VR, and rehabilitation medicine.
There are some limitations in this paper. First of all, the analysis data is static, while the bibliometric data is dynamic. Many documents analyzing topics, countries, researchers, or institutions may be read by many people, but the degree of citation is very small. Therefore, in the process of analy- sis, the atlas will be insufficient. Secondly, this paper only chooses English without considering other languages, which makes the analysis database incomplete. Finally, researchers with different knowledge backgrounds have different interpretations of hotspots. Therefore, the conclusion of the article is not necessarily accurate, and it still needs to be improved.
ACKNOWLEDGEMENT
This work is supported by the National Natural Science Foundation of China (No. 71801002, 71701003, 71802002) and the youth foundation of Humanities and Social Sciences of Ministry of Education of China (No. 18YJC630023).
REFERENCES
Abby C. King, Eric B.Hekler, Lauren A. Grieco, Sandra J. Winter, Jylana L. Sheats, Matthew P. Buman, Banny Banerjee, Thomas N. Robinson, Jesse Cirimele. (2013). Harnessing Different Motivational Frames via Mobile Phones to Promote Daily Physical Activity and Reduce Sedentary Behavior in Aging Adults. J. PLOS ONE. Brodie M. Sakakibara, BSc, William C. Miller, PhD, FCAOT, Melanie Souza,
MSCOT, Viara Nikolova, MSCOT, Krista L. Best, MSC. (2013). Wheelchair Skills Training To Improve Confidence With Using a Manual Wheelchair Among Older Adults: A Pilot Study. Archives of Physical Medicine and Rehabilitation. 94,1031–1037. Brooks, P., Hestnes, B. (2010). User Measures of Quality of Experience: Why being Objective and Quantitative is Important. IEE. Desmet, P. (2004). Measuring Emotion: Development and Application of an Instru-
ment to Measure Emotional Responses to Products. Springer, Berlin. DIS, I. ISO 9241–210:2009. (2010). Ergonomics of Human System Interaction-Part 210: Human-Centred Design for Interactive Systems (Formerly Know as 13407). Switzerland: International Organization for Standardization (ISO). Efi Nisiforou, Andrew Laghos. (2015). Field Dependence-Independence and Eye
Movement Patterns:Investigating Users’ Differnces Through an Eye Tracking Study. The British Computer Society. Guo Fu, Ding Yi, Liu Weilin, Liu Chang, Zhang Xuefeng. (2016). Can eye-tracking data be measured to assess product design?: Visual attention mechanism should be considered. International Journal of Industrial Ergonomics. 53, 229–235.
The Use of Physiological Measurement for User Experience Assessment 193
Hassenzahl, M. (2001). The Effect of Perceived Hedonic Quality on Product Appealingness. International Journal of Human-Computer Interaction. 13, 481–499. Jiang, M.Y., Sun, D.J., Li, Q., Wang, D.X. (2020). The usability of ventilator
maintenance user interface: A comparative evaluation of user task performance, workload, and user experience. Science Progress. LI Jie, Chen Chaomei. (2017). CiteSpace: Text Mining and Visualization in Scientific Literature (Second Edition). Beijing: Capital University of Economics and Business Press. 93. Likert, R.:A. (1932). Technique for the Measurement of Attitudes. Archieves of
Psychology. 22, 1–55. Mandry, R.L. Inkpen, K.M., Calvert, T.W. (2006). Using Psychophysiological Techniques to Measure User Experience with entertainment technologies. Behaviour & Information Technology. 25, 141–158. Mehrabian, A., Russell, J.A. (1974). An Approach to Environmental psychology.
MIT press, Cambridge, MA. Norman, D., Miller, J., Henderson, A. (1994). What You See, Some of What’s in the Future, and How We Go about Doing It: HI at Apple Computer. Conference Companion on Human Factors in Computing Systems. ACM, Massachusetts. Richard Skarbez, Frederick P.Brooks, Jr., Mary C. Whitton. (2018). A Survey of
Presence and Related Concepts. J. ACM Computing Surveys. 96,1–39. Shi, L.G., Zhang, Y.X., Wang, Z.L., Cheng, X.Y., Yan, H.Z. (2021). Luminance Parameter Thresholds for User Visual Comfort under Daylight Conditions from Subjective Responses and Physiological Measurements in a Gymnasium. Building and Environment. The Notice on Promoting Information and Communication Service Perception.
(2021). http://www.gov.cn/. Wang Youfa, Chen Hui, Luo Jianqiang. (2021) Comparison of Research Hotspots of Artificial Intelligence at Home and Abroad and Frontier Mining. Computer Engineering and Application. 57(12):46–53. Yang, M.X. (2019). Knowledge Graph and Evolution of Leadership Research in
the Chinese Context: Bibliometrics of Titles from 1949 to 2018. J. Nankai Management Review. 22, 80–94. Zardari, B.A., Hussain, Z., Arain, A.A., Rizvi, W.H, Vighio, M.S. (2020). Quest E-learning Portal: Applying Heuristic Evaluation, Usability Testing and Eye Tracking. Universal Access in the Information Society. 20,531–543. Zhao, H. (2019). Research Context and Hotspot Evolution of Social Commerce
Based on Bibliometric Analysis. Journal of Management. 16,923–931.
LISTED IN THE AHFE DIGITAL BOOKSTORE CATALOGUE
Explore the complete digital volume
Usability and User Experience
Read this individual research paper free through the original publisher, or explore the full digital proceedings book.
ISBN 978-1-958651-15-5
Explore this ISBN in the AHFE Bookstore ↗Listed in the July 2026 bookstore catalogue; search by ISBN to confirm current availability · Digital book purchase optional