Farman Moayed, Kendall Cribelar, Annette Smith (2022). Sustainability of Human Resources: A Heuristic Approach. In: Human Error, Reliability, Resilience, and Performance. AHFE Open Access, vol. 33, pp. 120–129. https://doi.org/10.54941/ahfe1001576
Introduction: Companies increasingly recognize the effects of socially and environmentally responsible decisions and investment in the sustainability of their businesses. Skilled and well-trained employees (human resources) are like valuable and scares resources and should be managed in sustainable manners. Ergonomics and Human Factors (E/HF) field can help management identify potential problem areas and improve the working conditions to minimize waste such as turnover, injury, absenteeism, etc. The employees’ performance can be used as an indicator of sustainability. Objective: To develop a heuristic model to assess the sustainability of human resources by utilizing micro-, meso, and macro-ergonomics factors, which can be used as diagnostic tool for improvement.Method: A survey questionnaire was developed and distributed among two different organization (a hospital and a manufacturing company). Three different indices of E/HF were calculated as well as performance index. The correlation between indices were studied and three-dimensional plots were created to evaluate the validity of the heuristic model.Finding: There were insignificant correlation between the E/HF indices and performance index in both organization, however, the responses from the manufacturing company matched the heuristic model better than hospital. Conclusion: The heuristic model developed in this study appeared to be viable to assess the sustainability of human resources. Additional work or different methods need to be implemented to validate the results. It seems that the survey should be custom designed for different industry since different factors and elements can affect the sustainability of human resources in each industry.
The concept of sustainability was initially focused only on environmental issues. The most commonly used definition for sustainability is from UN Brundtland Commission 1987, which states, “sustainable development is development that meets the needs of the present without compromising the ability of future generation to meet their own needs” (Haslem and Waterson, 2013; Hanson, 2013). This concept has been predominantly applied to sca- rce and/or expensive natural resources, waste management, environmental conservation, energy generation and consumption.
Several years later, Moray (1995) described major global problems and invited the researchers in ergonomics and human factors (E/HF) to make contributions in addressing ‘global problems’ (Moray, 1995; Haslem and Waterson, 2013). Presumably, the ergonomists should use their expertise involving human characteristics, behavior, performance and human intera- ction with technology to contribute to sustainability efforts at global scale. In order to achieve such goal(s), the solutions must be accepted by gene- ral population around the world and not just industries. To successfully promote sustainability at such scale and broad notion the E/HF experts
Sustainability of Human Resources: A Heuristic Approach 121
need to re-examine their own philosophy and ethics (Dekker et al., 2013). However, instead of focusing on the general global population, they stayed focused on industries to help create ‘sustainable businesses’ (Hanson, 2013; Radjiyev et al., 2015).
Socially responsible investment are important for business sustainability. This means nonfinancial elements of business are important measurements for a company’s values. Such measurements also included employees’ welfare (human resources) (Funk, 2003). Healthy, experienced and knowledgeable human resources (HR) can be considered an expensive and scarce resource in the context of the continuously changing technology; therefore, it could be beneficial to industries/society to develop sustainable human resources in order for the business to remain sustainable.
The main goal of this study was to develop a heuristic model to assess the sustainability of human resources in an organization by creating an instru- ment to study the E/HF aspects of their jobs and working environment in three different dimensions (i.e. micro-, meso- and macro-ergonomic) which in addition to employees’ performance were main indicator of HR sustaina- bility. This instrument can be used as a diagnostic tool to identify weaknesses and strengths and consequently help the management make decisions to improve HR sustainability.
Definition of Human Resources Sustainability The authors propose and use the following definition for human resources sustainability throughout this project: “Sustainability of human resources is development and implementation of policies and practices in any orga- nization to help its employees perform their jobs at or close to their highest capacity at any given time and maintain such performance throughout the term of their employment.”
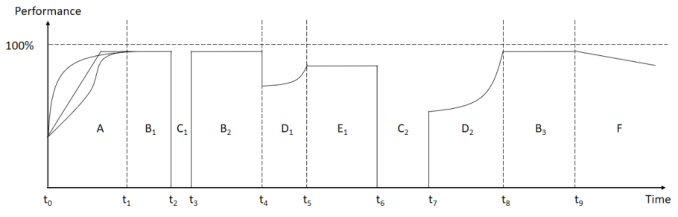
Figure 1 is an example of a hypothetical employee who has a fluctuating performance throughout his/her employment. Every employee goes through learning period once he/she is employed (section A) which can be different depending on the job and environment for each individual. Ideally, an orga- nization with sustainable human resources helps its employee achieve and maintain their performance close to 100% capacity without interruption. In reality, different factors can cause the performance to change. For example, an employee starts his/her career at t0 (figure 1) and goes through the learning process (section A) and at some point (t1) reaches the highest performance and remains at that level (section B1). It is very likely that the employee mis- ses a few days of work for variety of reasons (section C1) such as taking vacation or getting sick/injured. It is possible that the employee in this exam- ple gets injured at some point during his/her career (t4) but not so severely that he/she misses work days, nevertheless, his/her performance is negatively affected and it takes a while to recover from injury (section D1). In case of chronic illnesses or injuries, the performance remains lower than pre-injury levels even after the recovery (section E1). The employee might get injured so seriously that he/she is hospitalized and misses a few days of work (C2) and when he/she comes back to work (t7) it takes a long time to recover
Figure 1: Example of employee performance with low sustainability.
and get back to highest performance (section D2). Even if the employee does not get injured, eventually performance start to decline for different reasons such as aging, difficulty to learn/use new technology, obsolete and outdated knowledge and skills sets (section F). These type of events and changes in performance can happen frequently in someone’s career until he/she leaves the company or retires.
Factors such as injury, absenteeism, turnover rate, etc. can reduce the per- formance of employees (or human resources in general term) and add to company’s costs and expenses. The injuries or illnesses could be physical or psychological. Even if an injured or sick employee leaves a company to work in another one, he/she still is going to have lower than pre-injury or sickness performance.
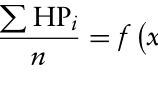
As it was described in the example above and based on the definition, the sustainability of HR has direct correlation with employees’ performance. Therefore, it might be reasonable to assess the sustainability of HR by measu- ring their performances. Human performance modeling can use factors such as task completion time, work time, motor performance, results of decision making, errors, cognitive and physical workload, etc. to quantify and predict human performance (Wu and Wada, 2018). In abstract, the sustainability of HR is equivalent to the average of employees’ performance, which is a function of observable factors during the term of employment (equation 1). This equation can change if an employee changes job within the company for any reason (e.g. promotion).
P HPi
S ≈
(1)
x1, x2, . . . xj, t
Equation reproduced from the original PDF.
Which: S is Sustainability of HR; HPi is Human performance of i-th emplo- yee; n is the number of employees; xj is the j-th observable factor and t is term of employment. Some of the examples of observable factors include produ- ction rate, frequency and severity of injury at work, sick leave, absenteeism, missing or making deadlines (asking for extension), needing help to complete tasks (physical or mental), quality of work (number of errors), redoing work, miscommunication with others, difficulty or ease of learning/using/adapting new skills or technology, etc. (Diamanditis and Chatzoglou, 2019).
Sustainability of Human Resources: A Heuristic Approach 123
Conceptual Model to Assess Human Resources Sustainability In any human-at-work system analysis, there are numerous factors which can affect the performance of employees. These factors can be categorized in three levels; micro-, meso-, and macro-ergonomic factors (Moayed 2016; Boils et al. 2014; Genaidy et al. 2014; Diamantidis and Chatzoglou 2019; Muhs et al, 2018). There is no universally accepted and comprehensive list of ergonomic factors but in this study the following definitions were used: i. Micro-ergonomic factors are ones that directly related to human-work inte- raction that can affect performance; ii. Meso-ergonomic factors are those from the immediate surrounding/environment of an employee but indirectly affecting his/her performance; and iii. Macro-ergonomic factors are related to the organizational structure, culture, or policies that can affect employees’ performance. Some HR management studies looked at employees’ perfor- mance but mostly at meso- and macro-ergonomic levels without using this terminology (Krishnaveni and Monica, 2018).
Within each level of ergonomic factors, some have positive correlation with performance, which means as the intensity or magnitude of such factors increase, the performance of employees improves. For example, designing workstation according to anthropometric measurement (micro-ergonomic factor) and performance improvement. Some factors are negatively correla- ted with performance. For example, exposure to hazardous chemicals (micro- and meso-ergonomic factors) and decrease in performance due to illnesses. There is a third group of factors that have hormetic correlation with perfor- mance, which means they can reduce the performance of employees when they are in their lowest or highest level, but can improve it when they are in mid-range. Stress is a typical example of this type of factors. Work with- out stress can become less challenging and boring and too much stress can cause health problems, while moderate levels of stress can keep the employees motivated and alert.
Sustainability of HR (performance) can be evaluated based on certain observable factors during the term of employment which can be positively or negatively affected by E/HF factors and by presence/absence of control methods. The optimum performance and therefore the optimum sustainabi- lity of HR can be achieved when there is a balance between job stressors, hazards and the control methods. In abstract, sustainability of HR can be a function of micro-, meso-, and macro-ergonomic factors as well as the con- trol methods (equation 2). Considering the number of possible ergonomic factors in a typical workplace, equation 2 can become very complex very quickly.
Equation reproduced from the original PDF.
a1, . . . , ai, b1, . . . , bj, d1, . . . , dk, c1, . . . , cl Which: S is Sustainability of human resources; ai is the i-th mirco-ergonomic factor; bj is the j-th meso-ergonomic factor; dk is the k-th macro-ergonomic factor and cl is the l-th control method. In order to simplify equation 2, it is better to calculate three different indices representing the three different dimensions of E/HF These indices would range from -1 to +1 and each index
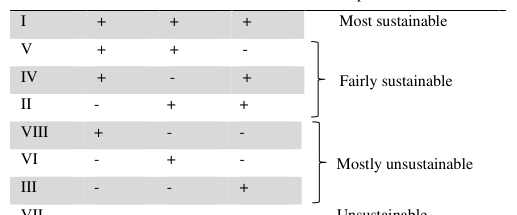
Table 1. Interpretation of E/HF Indices.
Octant IMicro IMeso IMacro Description I + + + Most sustainable V + + -
VII - - - Unsustainable
can include both hazards factors (stressors) and the relevant control method. The larger the index value the better (equation 3).
S = f (IMicro, IMeso, IMacro) (3) This three-dimensional model can be visualized by using an XYZ coordinate system. Once the three indices of E/HF are calculated for a given employee, the result can fall in one of the octants in the 3D coordinate system as pre- sented in table 1. Octant I represent positive values for all three Indices of E/HF and therefore it represents sustainable HR and octant VII represents unsustainable HR because all three Indices have negative values. Sustai- nability is not a discrete concept but rather a continuous one, therefore, the closer the values of three Indices are to (1,1,1) corner the better and (−1,−1,−1) corner on the other end of the cube is considered the worst case.
Ideally, if such heuristic model is used, it is expected that when the three E/HF Indices of a job fall in the first octant, the employee’s performance will score high and therefore it is considered sustainable. Similarly, when the three E/HF indices of a job fall in other octants, the employee’s performance is expected to score lower which means less sustainable HR with octant VII to be the worst one.
METHODOLOGY
A survey questionnaire was developed by researchers, which was made of five sections; demographic, micro-ergonomic factors, meso-ergonomic factors, macro-ergonomic factors, and performance indicators. It contained 67 que- stions about hazard exposures and control methods all of which required participants to rate their answers on a scale of zero to ten. Several of previ- ously published and validated instruments were used as general guideline to develop the instrument in this project (NIOSH, n.d; McCormick et al. 1956; Reid and Nygren, 1988; Rohmert and Landau, 1983; Tuomi et al, 1994; Herzberg, 1987; Abdallah et al. 2004).
Initially, employees of a large hospital located in rural region in mid- west were considered as target population in this study which was made of 4 groups (nurses, technical, support, professional). The office of HR
Sustainability of Human Resources: A Heuristic Approach 125
distributed the survey instrument among subjects. The second sample was collected from a manufacturing company within the same region a few mon- ths later. The sample was made of employees of three production lines. Two separate approvals were obtained from Indiana State University Institutio- nal Review Board (IRB), one for each sampling and before distributing the survey among target population in November of 2019 and January 2020. Pre-stamped envelopes were provided to participants in the hospital to mail their responses anonymously to researchers. Subjects of the second sample placed their responses anonymously in a drop box located at the facility. The researchers used SAS 9 for Windows for analysis and MATLAB R2015b to plot the data. Since the participant answered the questions using a score betw- een zero to ten, the researchers used sigmoid functions to normalize the range of responses to [−1,+1] accordingly.
For validation purposes, the HR management of each participating orga- nization was supposed to provide data about certain indicators such as injury/accidents, absenteeism, and turnover rates which could be used to eva- luate the sustainability of HR. If such indicators show the same trend as what the results of survey show, it would be evident that the heuristic model is an appropriate method to measure (evaluate) the sustainability of HR.
RESULTS
Two hundreds survey questionnaire were distributed among hospital emplo- yees and 101 responses were received (50% response rate). There were 86% female and 70% of participants were younger than 45 years. More than 90% of the participants identified themselves as Caucasian/White. On average par- ticipants had been employed in the hospital for 11.4 years (SD = 9.7 years) and have been in their current position for 7.3 years (SD = 8.2 years). Overall, 27.7% of participants were occupying positions which required job rotation (2 missing data points).
Statistical analysis showed very weak correlations between the E/HF indi- ces and performance index both for the entire dataset and stratified subsets according to job categories. It was not possible to validate the findings by comparing the performance index with observable factors of perfor- mance mainly because i. the human resources management did not have some of the data (i.e. injury rate), and ii. the information was aggre- gated by groups and it was not possible to stratify the data by jobs or positions.
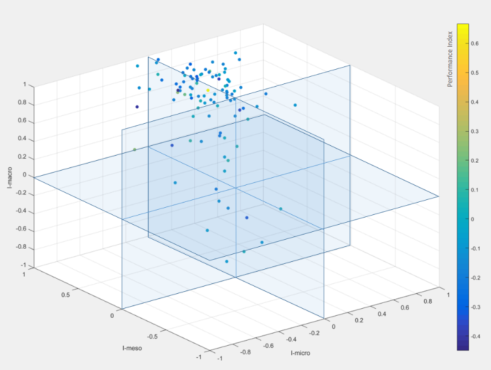
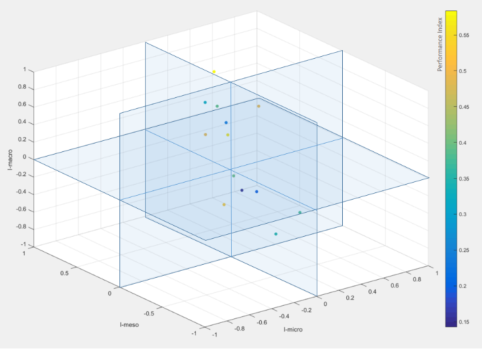
The 3D presentation of data from first sample indicated that majority of data points fall in the octant I where the three E/HF indices had positive values (figure 2). However, the color of the data points indicate that their performance index values were low, predominantly close to zero or nega- tive values. This is contrary to how the abstract model is supposed to work. This could be because the content of the survey instrument is not suitable for healthcare facilities and jobs. It is possible that the survey instrument is more suitable for manufacturing. In order to examine this assumption, a second sample was taken and studied.
Figure 2: The 3D presentation of data from first sample.
In the second sample, a total of 13 survey questionnaire were distribu- ted among employees in three different production line in a manufacturing company. All questionnaires were returned (100% response rate). All par- ticipants identified themselves as Caucasian/White with the average age of 46.5 years (SD = 9.2). The average work experience was 7.9 years (SD = 2.8 years) and the average time of employment in current position was 7.2 years (SD = 3.1 years). All participants indicated that their job requires job rotation.
The three E/HF indices and the performance index were calculated based on the normalized scores exactly like the first sample both for the entire data- set and stratified subsets based on production lines. The coefficient values showed somewhat stronger but still insignificant correlation between vari- ables. Similar to the first dataset, it was not possible to validate the results based on the measurable (observable) factors for similar reasons. As it can be seen in the 3D presentation of data from second sample, majority of data points fall in the octant I and V where either all three or two of the three E/HF indices have positive values (figure 3). The color of the data points indicate that their performance index values are all positive (from 0.15 to 0.6). This is consistent with how the abstract model is supposed to work.
DISCUSSION
The major element in the definition of HR sustainability was ‘time’. Sustaina- bility of human resources is the consistent and close to perfect performance over a long period of time. Performance can change over time for different reasons therefore this survey should be administered periodically to monitor the trends of E/HF indices and performance index. What has been presented in this article were two snapshots of the status of HR sustainability from two different organizations. The survey instrument used in this project can be used as a diagnostic tool to identify areas of potential problems. Each snapshot can
Sustainability of Human Resources: A Heuristic Approach 127
Figure 3: The 3D presentation of data from second sample.
reveal the weaknesses or challenges an organization faces and management can make decisions and adjustments to improve working conditions. For example, if micro-ergonomic index is the lowest value, it indicates mismatch between the content and design of work and the employees who are supposed to do the job and therefore some adjustments are necessary. Such mismatch between human and work can lead to physical and/or mental/psychological stresses on human body, which can eventually reduce performance and lower the sustainability of HR.
A global and widespread unsustainable HR can create additional demand for almost all kind of resources (human, equipment, capital, energy, etc.) and that means more stress on environment and natural resource.
CONCLUSION
One of the findings of this project was the fact that the survey instrument used in this heuristic method should be custom designed for any industry. The instrument used in this study worked better for the manufacturing com- pany compared to the hospital. It can be assumed the type of hazards and environmental factors as well as the type of control methods used in each industry can be different, and therefore the survey should be customized accordingly. The major weakness of this project was that the researchers were unable to validate the findings of the survey with the actual observa- ble or measureable HR variables/factors mainly because the HR management of the two participating organizations provided aggregated data, which was not very helpful to demonstrate the validity of this method. However, the second dataset collected from the manufacturing company showed that the instrument worked as expected based on the abstract model. Overall, it is possible for companies to develop their own instruments and adopt similar heuristic models to evaluate the sustainability of human resources in their organizations.
REFERENCES
Abdallah, S., Genaidy, A., Shell, R, Salem, O., and Karwowski, W. (2004). The Concept of Work Compatibility for Improving Workplace Human Performance in Manufacturing Systems. Human Factors and Ergonomics in Manufacturing and Service Industry, Volume 14, No. 4, 1–24. Bolis, I., Brunoro, C. M. and Sznelwar, L. I. (2014). Mapping the Relationship betw-
een Work and Sustainability and the Opportunity for Ergonomic Action. Applied Ergonomics, Volume 45, No. 4, 1225–1239. Dekker, S.W.A., Hancock, P. and Wilkin, P. (2013). Ergonomics and Sustainability: Toward an Embrace of Complexity and Emergence. Ergonomics, Volume 56, No. 3, 357–364. Diamantidis, A. D. and Chatzoglou, P. (2019). Factors Affecting Employee Per-
formance: An Empirical Approach. International Journal of Productivity and Performance, Volume 68, No. 1, 171–193. Funk, K. (2003). Sustainability and Performance. MIT Sloan Management Review, Volume 44, No. 2. Genaidy, A. M., Sequeira, R., Rinder, M. M. and A-Rehim, A. D. (2009). Determi-
nants of Business Sustainability: An Ergonomics Perspective. Ergonomics, Volume 52, No. 3, 273–301. Hanson, M. A. (2013). Green Ergonomics: Challenges and Opportunities. Ergonomics, Volume 56, No. 3, 399–408. Haslam, R. and Waterson, P. (2013). Ergonomics and Sustainability. Ergonomics,
Volume 56, No. 3, 343–347. Herzberg, F. (1987) One More Time: How Do You Motivate Your Employee?
Harvard Business Review, Volume 65, No. 5, 109–120. Krishnaveni, R. and Monica, R. (2018). Factors Influencing Employee Performance: the Tole of Human Resource Management Practices and Work Engagement. International Journal of Business Performance Management, Volume 19, No. 4, 450–475. McCormick, E.J., Jeanneret, P.R. and Mecham, R.C. (1969). The Development and
Background of the Position Analysis Questionnaire. Lafayette, IN: Occupational Research Center, Purdue University. Moayed, F.A. (2016). Human Factors Measurement. In Badiru, A. B. and Racz, L. (Eds.), Handbook of Measurements: Benchmarks for Systems Accuracy and Precision (pp. 41–78). CRC Press. Moray, N. (1995). Ergonomics and the Global Problems of the Twenty-First Century.
Ergonomics, Volume 38, No. 8, 1691–1707. Muhs, K. S., Karwowski, W. and Kern, D. (2018). Temporal Variability in Human Performance: A Systematic Literature Review. International Journal of Industrial Ergonomics, Volume 64, 31–50. NIOSH (n.d.). NIOSH Generic Job Stress Questionnaire. Cincinnati, OH:NIOSH,
Division of Behavioral and Biomedical Sciences, Motivation and Stress Research Section. Radjiyev, A., Qiu, H., Xiong, S. and Nam, K. (2015). Ergonomics and Sustainable Development in the Past Two Decades (1992-2011): Research Trends and How Ergonomics Can Contribute to Sustainable Development. Applied Ergonomics, Volume 46, part A, 67–75. Reid, G. B. and Nygren, T. E. (1988). The Subjective Workload Assessment Tech-
nique: A Scaling Procedure for Measuring Mental Workload, In: Hancock, P. A. and Meshkati, N. (Eds.), Human Mental Workload (pp. 185-218). Amsterdam: Elsevier Science Publishers (North-Holland).
Sustainability of Human Resources: A Heuristic Approach 129
Rohmert, W. and Landau, K. (1983). A New Technique for Job Analysis. London, UK: Taylor & Francis. Tuomi, K., Ilmarinen, J., Jahkola, A., Katajarinne, L., and Tulkki, A. (1994). Work
Ability Index. Helsinki, Finland: Institute of Occupational Health, Wu, C. and Wada, T. (2018). Introduction to the Special Issue of Human Performance Modeling: Prediction of Human Performance to Improve Productivity and Safety. International Journal of Industrial Ergonomics, Volume 63, 1–2.
LISTED IN THE AHFE DIGITAL BOOKSTORE CATALOGUE
Explore the complete digital volume
Human Error, Reliability, Resilience, and Performance
Read this individual research paper free through the original publisher, or explore the full digital proceedings book.
ISBN 978-1-958651-09-4
Explore this ISBN in the AHFE Bookstore ↗Listed in the July 2026 bookstore catalogue; search by ISBN to confirm current availability · Digital book purchase optional