Chuyu You, Beibei Sun (2022). Application of Genetic Algorithm in data Visualization color matching realized by front-end. In: Intelligent Human Systems Integration (IHSI 2022): Integrating People and Intelligent Systems. AHFE Open Access, vol. 22. https://doi.org/10.54941/ahfe1001073
Aiming at the problems of low efficiency, difficulty in expansion and lack of standardization in the process of realizing data visualization in the front-end, a set of automatic color matching schemes suitable for various chart types is proposed. This method is implemented in combination with Genetic Algorithm. First, a color selection function is used to randomly select colors from qualified color intervals to construct multiple palettes to improve the efficiency of the algorithm. Then, the fitness function is constructed from the two aspects of perceptibility and harmony between colors to judge the quality of the palette, and to screen out the groups that can be inherited to the next generation. Finally, this method is combined with the front-end chart library (ECharts) to apply to the construction of charts with multiple indicators of fire risk indicators, and multi-dimensional surveys of users are carried out. The results show that the chart drawn by this method has higher recognition efficiency and color harmony.
Intelligent Human Systems Integration (IHSI 2022): Integrating People and Intelligent Systems https://openaccess.cms-conferences.org/#/publications/book/978-1-7923-8988-7
INTRODUCTION
The color design in data visualization allows users to efficiently understand data, discover rules, and explore tasks as the goal, focusing on mining the relationship between color and data, tasks, equipment and other visualization application environments. However, in actual visualization applications, the process of color design is usually an iterative trial-and-error process, that is, designers or users iteratively try different color designs and judge their rationality based on personal subjective perception [1]. The optimization of colors in visualization can be described from two aspects: perception and harmony, that is, the optimized visualization chart needs to enhance the degree of recognition between different data, while ensuring the harmony of the overall color matching of the chart.
Color Space and Color Calculation Color Space
The color space refers to the color range defined by the color model. The frequently used color spaces mainly include RGB, CMYK, Lab, etc.
RGB is a device-related color model, which uses a three-dimensional rectangular coordinate system to represent colors. The red, green, and blue primary colors are additive primary colors[3]. Mixing each primary color together can produce a composite color. It is the most commonly used color model for the front end.
The Lab color model is a color model developed by CIE (International Commission on Illumination) and has nothing to do with equipment. The Lab color model takes the coordinates Lab, where L represents brightness; the positive number of a represents red, and the negative end represents green; the positive number of b represents yellow, and the negative end represents blue. Any color in nature can be expressed in Lab space. Its color space is larger than RGB space.[4] The color information that RGB can describe can be mapped in Lab space.
Color Calculation Due to the differences between the human eye and the colorimeter in the color evaluation methods and shapes at different positions in the chromaticity diagram, there is a problem of mismatch between the measured data and the visual observations during color evalua-tion. The CIEDE2000 color difference formula was published by CIE in 2001[4]. It provides an improved industrial color difference calculation process and is currently a more accurate color difference calculation formula.
Judd and Wyszecki defined color harmony as a pleasing effect that produced by two or more colors in neighbouring areas[6].Li-Chen Ou[7] et al suggested the three colour harmony factors, chromatic effect (HC), lightness effect (HL), and hue effect (HH) respectively, are assumed to be independent of each other. This means that each factor is correlated linearly with colour harmony value if and only if the other two are held constant.
Intelligent Human Systems Integration (IHSI 2022): Integrating People and Intelligent Systems https://openaccess.cms-conferences.org/#/publications/book/978-1-7923-8988-7
Equation reproduced from the original PDF.
Among them, H is the total harmony, HC represents the harmony of the chroma, HL represents the harmony of the lightness, and HH represents the harmony of the hue.
GA OPTIMIZATION Genetic Algorithm (GA) is a computational model that simulates the biological evolution process of natural selection and genetic mechanism of Darwin's biological evolution theory, and is a method of searching for the optimal solution by simulating the natural evolution process. The genetic algorithm takes all the individuals in the species group as the object, and uses randomization technology to guide an efficient search of a coded parameter space. Among them, selection, crossover and mutation constitute the genetic operation of genetic algorithm; The five elements of parameter coding, initial population setting, fitness function design, genetic operation design, and control parameter setting constitute the core content of genetic algorithm[12].
Initializing Seed Since the color space selected by the algorithm is LAB, the population is initialized directly in the LAB color space. The chromosome is composed of multiple LAB arrays. The length of the chromosome array is determined by the number of data to be displayed. The positions 0, 1, and 2 of the LAB array represent the values of L, A and B respectively. At the same time, in order to prevent the brightness and saturation from being too high or too low, and to ensure the rationality of colors in data visualization applications, certain restrictions are imposed on the color selection of chromosome genes: 1. Color brightness should be high in data visualization to ensure that the information is easy to perceive. But too high brightness will also cause distraction and visual fatigue, so the value range of L is limited to 50 to 80. 2. At the same time, in order to ensure that the colors have proper hue and saturation, and avoid problems such as indistinguishable or overly prominent colors, the values of A and B are limited to two intervals: [-100,-14] and [14,100]. 3. In order to ensure the overall harmony of the initialized chromosomes, the brightness of each gene in each dye is equal, and the difference in brightness is mainly completed by cross and mutate. On the basis of satisfying the above conditions, in order to ensure the running speed, the number of chromosomes of the sample is finally set to 500.
Fitness Function Wang et al. [8] combined the existing color difference calculation formula CIEDE2000[5] and the color harmony calculation formula proposed by Li-Chen Ou et al.[7], and de-rived a
Intelligent Human Systems Integration (IHSI 2022): Integrating People and Intelligent Systems https://openaccess.cms-conferences.org/#/publications/book/978-1-7923-8988-7 comprehensive color calculation formula for calculating the score of two colors in the data visualization chart:
S(Cp, Cq) = D(Cp, Cq) + αH(Cp, Cq) (2) Where, S(Cp, Cq) represents the final score of the two color combinations, H(Cp, Cq) represents the harmony score of the two color combinations, D(Cp, Cq) represents the calculated value of the color difference, and α represents the coefficient used to determine whether the overall visual effect emphasizes contrast or harmony. In Wang's algorithm, α is a constant, but after trying to optimize data with different amounts of data, it is found that: when the amount of data is small, the larger contrast will make the chart appear disorderly, so the value of α should be increased; when the amount of data is large, the harmony is too high will make it difficult to distinguish between different color blocks. From this, the solving equation of α is obtained:
𝛼= 110𝑛−0.66 (2) For the specific process of obtaining α, please refer to the user research section in Section 5.
Refer to the optimization ideas of Fang et al.[9], the fitness function obtained by the fitness function is the lowest score 𝑆𝑚𝑖𝑛(𝐶𝑝, 𝐶𝑞) of the two color combinations in each set of palettes. By maximizing 𝑆𝑚𝑖𝑛(𝐶𝑝, 𝐶𝑞), the final optimization result can be obtained. In this model, the top 30 percent with the highest fitness score in each generation is directly inherited to the next generation.
Crossover Function The crossover function first randomly selects two palette arrays, from which the one with the highest fitness is selected as the parent chromosome. Repeat the previous opera-tion to obtain the mother chromosome. After that, the start position and end position of the gene that randomly crossed, the gene fragments in this interval are exchanged, and two new chromosomes are returned. After testing, when the probability of crossover between chromosomes is set to 30%, a good balance can be achieved between visualization and operating efficiency.
Mutation Function The mutation function randomly selects a LAB array on the palette where the mutation occurs, randomly selects the value of A or B, and replaces it with any value within the value range ([-100,-14]U[14,100]). Lightness is not mutated here, because lightness has a greater impact on delta-E, and its mutation is easy to obtain greater fitness, which will eventually lead to evolution toward an increase in lightness difference. After testing, when the probability of mutations between chromosomes is set to 30%, a good balance can be achieved between visualization effects and operating efficiency.
Intelligent Human Systems Integration (IHSI 2022): Integrating People and Intelligent Systems https://openaccess.cms-conferences.org/#/publications/book/978-1-7923-8988-7
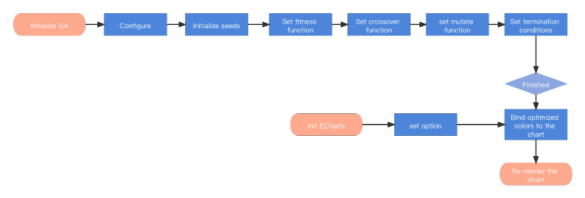
FRONT-END IMPLEMENTATION There are many programming languages for data visualization. This model chooses JavaScript to develop, mainly based on the following reasons: 1. Currently, the Web terminal is developing rapidly, and it has a huge user group due to its advantages of simple interaction and easy access. 2. A set of front-end codes can be applied to various terminal devices, shielding the differences of user terminals 3. Open source frameworks such as Vue, React, and the open source visualization library ECharts can greatly improve development efficiency. The model in this article will rely on Vue and ECharts to develop and implement. Its advantage is that it is conducive to the two-way binding characteristics of Vue, which can greatly improve the efficiency of view refresh and enhance the interactive experience. The specific implementation process of this model is shown in Figure 1:
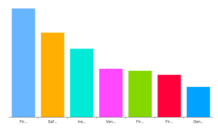
Figure 1. Operation flow chart of optimization model The final optimization result is shown in Figure 2 The pie chart and bar chart are drawn using ECharts as the result display.Figure 2. Interface of palette optimization system
RESEARCH AND ANALYSIS The experiment in this article is carried out in two steps. First, it is necessary to test the effect of different α values on the results, and then obtain the calculation equation of α. Then, test the validity of the experimental equation, select the optimized palette to draw the chart, and test the user's subjective evaluation of the chart from six dimensions.
Intelligent Human Systems Integration (IHSI 2022): Integrating People and Intelligent Systems https://openaccess.cms-conferences.org/#/publications/book/978-1-7923-8988-7
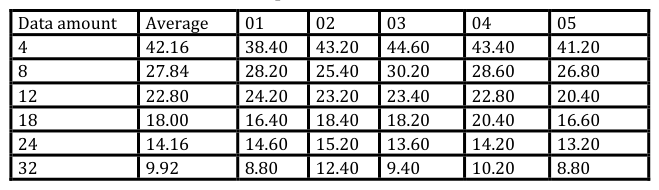
α Test In the α test experiment, the subjects were asked to perform 5 optimization operations when the data volume was 4, 6, 8, 10, 12, 16, and 22. In the α test experiment, the subjects were asked to perform 5 optimization operations when the data volume was 4, 6, 8, 10, 12, 16, and 22. The alpha value for the first time is determined and calculated by an empirical formula, and the alpha value for the next four times is adjusted by the subjects according to their own feelings: If you feel that the color of the picture is not harmonious, increase the value of α; else, increase the value of α. In order to eliminate the interference of shape, size and position, the subjects only need to observe the color palette and make an evaluation during this process. The experimental results are shown in Table 1:
Table 1: The mean value of alpha obtained with different amounts of data.Equation reproduced from the original PDF.
Validity test of experimental model The validity test of the experimental equation combines multiple color design guidelines for data visualization. Referring to the color design guidelines for data visualization proposed by Bujack et al.[10], this experiment measures the six indicators of distinguishability, orderliness, uniformity, visual importance, aesthetics, and smoothness.
In response to the above indicators, the Likert scale method was used to test the participants’ experience of using the histogram and pie chart of a company’s fire risk indicator data obtained before and after the optimization of the model. The scale used in the test consists of a set of statements. Each statement has five types: "Much better than the former", "Better than the former", "No obvious difference in perception", "Weaker than the former", and "Much weaker than the former". Answer, the corresponding scores are 5, 4, 3, 2, and 1. results obtained are as follows:
Table 2: The mean value of alpha obtained with different amounts of data.
Table available in the original PDF paper.
Intelligent Human Systems Integration (IHSI 2022): Integrating People and Intelligent Systems https://openaccess.cms-conferences.org/#/publications/book/978-1-7923-8988-7
From the statistical results in the above table, it can be seen that the overall effect of the optimized chart is good, and the average total score under each number is better than the standard score of 15 points. Discriminability, Uniformity and Aesthetic, all have good performance under different values, indicating that the chart has found a good balance between discernibility and aesthetics. As the amount of data increases, the value of Importance decreases.
CONCLUSIONS
In this paper, combining the existing color difference calculation formula and delta-E formula, on the basis of the existing color fusion calculation formula, the calculation formula of α value is proposed. At the same time, genetic algorithm is used to realize the optimization model of palette in front-end environment using JavaScript language, combined with the currently widely used front-end framework Vue and front-end visualization library ECharts for visual presentation, and use it for user research. The innovations of this paper include: 1. When the two colors are combined, the calculation of the α value is explored to make it suitable for application scenarios with different data volumes; 2. Combine genetic algorithm to build an optimization model of palette, and explore a variety of situations, which has a wide range of applications; 3. Use JavaScript language to implement the model, which can be directly applied to the Web interface display; 4. According to the role of color in multiple dimensions in data visualization, user research was conducted to prove the validity of the results. According to the results of user research, although the color palette obtained by the method in this article has good effects in terms of aesthetics and efficiency, there are still many areas to be optimized: 1. The score of the palette in this article is determined by the lowest score of the palette color pairwise combination. To get this score, it is convenient to double cycle the palette array, which has high time complexity and the overall running time of the program. Longer 2. When assigning the color of the palette to the graphics, the size of the data is only corresponding to the level of brightness, and the influence of factors such as hue and
Intelligent Human Systems Integration (IHSI 2022): Integrating People and Intelligent Systems https://openaccess.cms-conferences.org/#/publications/book/978-1-7923-8988-7 warmth on the importance of the data is not considered; 3. The application in data visualization only explores simple bar charts and pie charts, and lacks research in complex visualization models.
REFERENCES
Zeng, Q., Wang Y.H., Tu C.H., Chen B.Q.: Color Computing in Data Visualization. J.
Journal of Computer-Aided Design & Computer Graphics. 32(10), 1549-1559. (2020) Lee, Y.K.: Comparison of CIELAB Delta ΔE* and CIEDE2000 color-differences after polymerization and thermocycling of resin composites. J. Dental Materials. 21(7), 678--682(2005) Li, J.F.: No-reference Image Quality Assessment Based on Natural Scene Statistics in RGB
Color Space. J. Acta Automatica Sinica. 41(09), 1601--1615. (2015) Pecho, O.E., Ghinea, R., Alessandretti, R., Pérez, M.M., Bona, A.D.: Visual and instrumental shade matching using CIELAB and CIEDE2000 color difference formulas. Dental Mater. 32, 82--92. (2016) Lee. Y.K.: Comparison of CIELAB Delta ΔE* and CIEDE2000 color-differences after
polymerization and thermocycling of resin composites. J. Dental Materials. 21(7), 678--682(2005) Judd, D.B., Wyszecki, G.: Color in business, science and industry, 3rd ed, New York: John Wiley & Sons(1975) Ou, L.C., Luo, M.R.: A Colour Harmony Model for Two-Colour Combinations. J. COLOR
RESEARCH AND APPLICATION. 31, 191--204 (2006) Wang, H., Hu, R.Z.,: Perception and Harmony Guided Color Assignment Optimization for Multi-Charts. J. Journal of Computer-Aided Design & Computer Graphics. 33, 815-- 825(2021) Fang, H, Walton, S., Delahaye, E.: Categorical colormap optimization with visualization
case studies. J. IEEE Transactions on Visualization and Computer Graphics. 23(1), 871--880(2017) Bujack, R., Turton, T.L., Samsel, F.: The good, the bad, and the ugly: a theoretical framework for the assessment of continuous colormaps. J. IEEE Transactions on Visualization and Computer Graphics. 24(1), 923--933 (2018) Lothar, M.S.: Theory of genetic algorithms. J. Theoretical Computer Science . 2001 Zhang, S., Zhang F.X.: A modified method to fitness function of genetic algorithms. J.
Computer Applications and Software. 23(2), 108--110 (2006)
Intelligent Human Systems Integration (IHSI 2022): Integrating People and Intelligent Systems https://openaccess.cms-conferences.org/#/publications/book/978-1-7923-8988-7
LISTED IN THE AHFE DIGITAL BOOKSTORE CATALOGUE
Explore the complete digital volume
Intelligent Human Systems Integration (IHSI 2022): Integrating People and Intelligent Systems
Read this individual research paper free through the original publisher, or explore the full digital proceedings book.
ISBN 978-1-7923-8988-7
Explore this ISBN in the AHFE Bookstore ↗Listed in the July 2026 bookstore catalogue; search by ISBN to confirm current availability · Digital book purchase optional