Xiaoying Yang, Xingsong Wang, Hongyi Yang (2022). Comparative color analysis of icons and logos. In: Intelligent Human Systems Integration (IHSI 2022): Integrating People and Intelligent Systems. AHFE Open Access, vol. 22. https://doi.org/10.54941/ahfe1001045
In the field of design, both logo and icon are the most common visual symbols. Among them, the logo is more commercial, and its purpose is to spread the value connotation of the brand. At the same time, the icon has more substantial functionality, which makes it easier for users to identify and Understand the functions of related products. To explore whether there are some potential human factors or design guidelines when designers are designing an icon or logo, which may cause the difference in colour between the two, this article attempts to combine image processing technology to analyze the colour characteristics of the logo and icon image And research. We extracted features such as colour moment and brightness. We used a machine learning classifier to prove that the two colour features are quite different. This research can be used as the basis for quantitative research on the difference between logo and icon. At the end of the paper, we have a prospect for future research.
Logos and icons can be seen everywhere in daily life. At the same time, as the two
Intelligent Human Systems Integration (IHSI 2022): Integrating People and Intelligent Systems https://openaccess.cms-conferences.org/#/publications/book/978-1-7923-8988-7 most common visual symbols, they are also design tasks that visual designers often encounter. For a long time, the distinction and definition of the two types of symbols have remained at the subjective perceptual level; they are defined according to their different usage scenarios. In Wikipedia, the definition of logo is "A logo is a graphic mark, emblem, or symbol used to aid and promote public identification and recognition. It may be of an abstract or figurative design or include the text of the name it represents as in a wordmark." (https://zh.wikipedia.org/wiki/logo),
Moreover, the definition of an icon is "An icon is a pictogram or ideogram displayed on a computer screen in order to help the user navigate a computer system. The icon is a quickly comprehensible symbol of a software tool, function, or data file accessible on the system. It is more like a traffic sign than a detailed illustration of the actual entity it represents." (https://zh.wikipedia.org/wiki/icon). A logo is a corporate cultural symbol. Its image reflects its brand culture; Simultaneously, an icon has more substantial functional attributes; it appears more in the man-machine interface. It is a kind of specific function graphic signs.
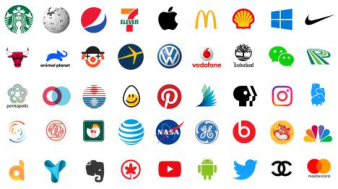
(a) (b)
Figure 1. (a) Logo images; (b) Icon images.
Vera et al. investigated whether the complexity of a food logo affected consumers' desire to buy the product and proved that consumers are more likely to buy products with more straightforward logos (Vera et al. 2019). Kiriaki et al. provided design guidelines and recommendations for logos design in the renewable energy sector (Kiriaki et al. 2021); Jannick et al. discussed the relationship between logo symmetry and product inference (Jannick et al. 2019). TabassumRiaz et al. explored the role of logo placement on consumer perceptions of products, showing that consumer purchase intentions and recommendations are influenced by the placement of the logo on the packaging and that brands that place their logos higher on the packaging are likely to be more favoured by consumers (TabassumRiaz et al. 2019).
In terms of icon research, Zhang et al. conducted a user behavioural study on the visual search efficiency of interfaces based on four image features of icons: colour combination, contrast, brightness, and area ratio (Zhang et al. 2021). María et al. proposed appropriate design guidelines for the design of icons for recurring products to enable efficient recognition by users (María et al. 2018). Henrietta et al.
Intelligent Human Systems Integration (IHSI 2022): Integrating People and Intelligent Systems https://openaccess.cms-conferences.org/#/publications/book/978-1-7923-8988-7 investigated the relationship between consumers' perceptions of application icons and the success of icons in four dimensions using a semantic differential scale containing 22 pairs of adjectives, which The study showed that users were more likely to click on or purchase applications represented by more aesthetically pleasing and pleasing icons (Henrietta et al. 2019).
While previous studies have primarily focused on a single work on logos or icons, this study is the first to use both logos and icons as research objects and conduct comparative analysis based mainly on image colour features. We first constructed a dataset of 5400 logo images and 5700 icon images, extracted ten colour features such as colour moment, lightness and colour entropy from each of these samples. We quantified them using a machine learning classifier to show that there are significant differences between the two. Our study can be used as a basis for the study of the differences between logos and icons.
Methods
Colour features Colour is a fundamental element in the content of an image, a global feature of the image, and the main feature for the human eye to perceive and recognise the image intuitively. At the same time, colour features are less dependent on the image's geometry and have a high degree of robustness. In the study, we chose the image's mean brightness and colour moments as the colour features for calculation.
Mean brightness For colour images, a reasonable image luminance will bring better visual effects; too much luminance will cause aesthetic fatigue due to the stimulating effect on the human eye, while too little luminance will most likely reduce the attractiveness of the image due to the lack of great details. We obtained the luminance component of the image based on the RGB colour space and the luminance information of the image based on the logarithmic mean luminance proposed by Reinhard in 2002 (Stricker and Orengo. 1995).
Color moments Colour moments are a simple and effective colour representation method proposed by Stricker and Oreng, which can effectively represent the colour distribution in an image (Reinhard et al. 2002). The extraction of colour moment features does not require quantization of the image, thus avoiding the false detection that digital images are prone to in high dimensions. The colour information of a colour image is mainly expressed in the lower order distance. The first-order moments represent the mean intensity of the colour components, the second-order moments represent the variance
Intelligent Human Systems Integration (IHSI 2022): Integrating People and Intelligent Systems https://openaccess.cms-conferences.org/#/publications/book/978-1-7923-8988-7 of the colour components, and the third-order moments represent the skewness of the colour components. This study calculates the order colour moments of each colour channel in the HSV colour space.
Colour Complexity In the information theory proposed by Shannon, entropy is a measure of the uncertainty of a signal (Shannon. 1948). Information entropy is a concept used to measure the amount of information, and it can be used to express the value of information. The entropy value of an image signal reflects the average amount of information in the image and is an essential indicator of the richness of the information contained in the image. The entropy of information has the following characteristics: symmetry, determinism and non-negativity. Entropy reflects the average amount of information in an image and is an essential indicator of the richness of the information contained in an image. By calculating the amount of colour information in each channel of the colour space in an image, it is possible to reflect the image's colour richness. The more prosperous and complex the colour, the higher the value of colour information contained in the image. In summary, 13 colour features were extracted from the logo and icon images for comparison and analysis, including colour moments and colour complexity.
Experiments Data
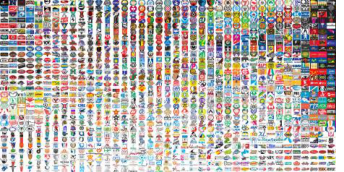
In this study, we first constructed a dataset of 5400 logo images and 5700 icon images. It is also important to note that we did not select text-only logo images for the logo data, while we selected flat icons and face icons for the icon data. The final data was processed into JPG format with a resolution of 64×64. The final data consisted of 5400 logo images and 5700 icon images, shown in Figures 2.
(a) (b)
Figure 2. Datasets.
Results
Intelligent Human Systems Integration (IHSI 2022): Integrating People and Intelligent Systems https://openaccess.cms-conferences.org/#/publications/book/978-1-7923-8988-7
We extracted the colour features from the logo and the icon in the sample set and compared the distribution of the samples with the corresponding features.
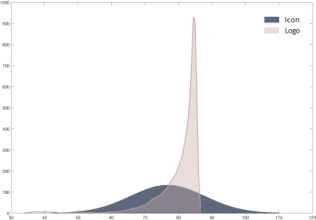
First, for the brightness features of the icon and logo, the distribution of the brightness of the icon image is closer to the normal distribution, while the brightness of the logo image is mainly concentrated in the range of 82-83 and has a higher mean value of brightness (Figure 3).
Figure 3. Lightness distribution of logo and icon.
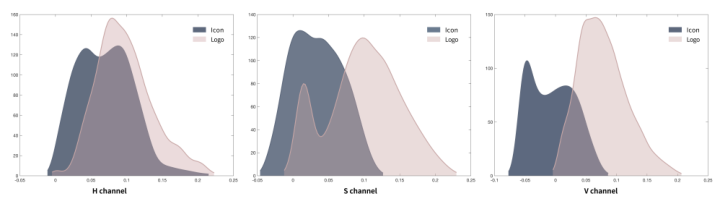
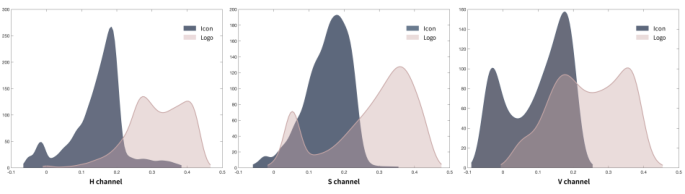
Similarly, we calculated the distribution of the 1st to third-order moments of the icon and logo colours in the samples (Figure 4 to 5). The results show that the difference between the first-order moments of each colour channel of the two types of samples in HSV colour space is slight, while the second-order and third-order moments are different. This indicates that icons and logos in the dataset have a similar intensity of colour components, while the variance and skewness of colour components are different.
Figure 4. First-order moments distribution of logo and icon.
Intelligent Human Systems Integration (IHSI 2022): Integrating People and Intelligent Systems https://openaccess.cms-conferences.org/#/publications/book/978-1-7923-8988-7
Figure 5. Second-order moments distribution of logo and icon.Figure 6. Third-order moments distribution of logo and icon..
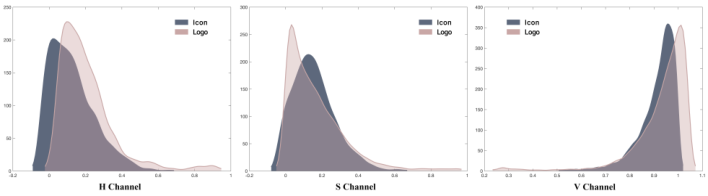
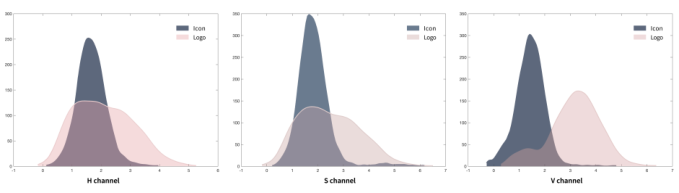
Finally, for the colour complexity feature, we calculated the information entropy distribution of the samples by the three channels in HSV colour space, as shown in Figure 7.
Figure 7. Colour complexity distribution of logo and icon.
Another way to quantify the difference in features is to use machine learning classifiers to perform classification based on extracted features. The study was based on SVM and random forest classifiers to classify log and icon-based colour features and used F1 scores as the judging index. The final classification results are shown in Table 1, which shows that the colour features extracted in the paper were able to classify both types of visual symbols well, with the SVM classifier having the best classification results with an F1 score of 97.4%. In addition, a comparison of the importance of the classification features by the random forest classifier shows that
Intelligent Human Systems Integration (IHSI 2022): Integrating People and Intelligent Systems https://openaccess.cms-conferences.org/#/publications/book/978-1-7923-8988-7 the V channel's colour complexity feature plays the most critical role in this classification task.
Conclusion
In this study, we have taken both logo and icon as the object of study for the first time and combined image processing and machine learning techniques to analyse them quantitatively. We have extracted 11 colour features such as brightness, colour moment and colour complexity in HSV colour space based on the colour features of the two types of visual symbol images. The results show that the brightness of the logo image is larger and more concentrated, while the variance and skewness of the logo and icon images' colour components and the colour information entropy features of the V-channel differ significantly. The quantitative comparison using machine learning classifiers shows that the colour features extracted in this study can distinguish the two images well, with the most significant difference in colour complexity between the two V channels.
This study can be used as a basis for future research on the comparison of logos and icons. In future research, the corresponding datasets can be expanded, and other features of the two types of visual symbols, such as texture features and shape features, can be compared. More importantly, how to integrate these quantitative analyses into the design task to genuinely assist designers in their design work.
REFERENCES
Henrietta Jylhä, Juho Hamari. (2019). An icon that everyone wants to click: How perceived aesthetic qualities predict app icon successfulness. International Journal of Human-Computer Studies. Jannick Bettels, Klaus-Peter Wiedmann. (2019). Brand logo symmetry and product
design: The spillover effects on consumer inferences. Journal of Business Research. Kiriaki M.Keramitsoglou, Robert C.Mellon, Maria I.Tsagkaraki, Konstantinos P.Tsagarakis. (2020). Designing a logo for renewable energy sources with public participation: Empirical evidence from Greece. Renewable Energy. Reinhard, Erik, Mike Stark, Peter Shirley, and James Ferwerda. (2002). Photographic
Tone Reproduction for Digital Images. ACM Transactions on Graphics (TOG), Proceedings of the 29th Annual Conference on Computer Graphics and Interactive Techniques (SIGGRAPH), pp. 267-276. New York, NY: ACM Press. María D.Bove, Pilar Quemades-Beltrán, Victori aPérez-Belis, et al. (2018). Options for labelling circular products: Icon design and consumer preferences. Journal of Cleaner Production. Stricker and Orengo, (1995). Similarity of Color Images, in Proc. SPIE Storage and
Retrieval for Image and Video Databases. Shannon, C.E. (1948). A Mathematical Theory of Communication. Bell Syst. Tech.
Intelligent Human Systems Integration (IHSI 2022): Integrating People and Intelligent Systems https://openaccess.cms-conferences.org/#/publications/book/978-1-7923-8988-7
TabassumRiaz, Muhammad Mudasar Ghafoor. (2019). Strategic Logo Placement on Packaging - Using Conceptual Metaphors of Power in Packaging – Evidence from Pakistan. Procedia Computer Science. Vera Bossel, Kelly Geyskens, Caroline Goukens. (2019). Facing a trend of brand logo
simplicity: The impact of brand logo design on consumption. Food Quality and Preference. Zhangfan Shen, Linghao Zhang, Rui Li, Jie Hou, Chenguan Liu, Weizhuan Hu.
(2021). The effects of color combinations, luminance contrast, and area ratio on icon visual search performance. Display.
Intelligent Human Systems Integration (IHSI 2022): Integrating People and Intelligent Systems https://openaccess.cms-conferences.org/#/publications/book/978-1-7923-8988-7
LISTED IN THE AHFE DIGITAL BOOKSTORE CATALOGUE
Explore the complete digital volume
Intelligent Human Systems Integration (IHSI 2022): Integrating People and Intelligent Systems
Read this individual research paper free through the original publisher, or explore the full digital proceedings book.
ISBN 978-1-7923-8988-7
Explore this ISBN in the AHFE Bookstore ↗Listed in the July 2026 bookstore catalogue; search by ISBN to confirm current availability · Digital book purchase optional