Puheng Shao, Zhenwu Fang, Jinxiang Wang, Zhongsheng Lin, Yin Guodong (2021). Modeling and Explanation of Driver Steering Style: An Experiment under Large-Curvature Road Condition. In: Human Systems Engineering and Design (IHSED2021): Future Trends and Applications. AHFE Open Access, vol. 21. https://doi.org/10.54941/ahfe1001207
Before the maturation of vehicle’s self-driving, human-vehicle shared control would be a dominant solution in a certain period. Understanding driver’s maneuver behavior is an important prerequisite for providing drivers with different levels of assistance in the collaborative driving system. This research aims to classify the characteristics of drivers’ maneuver modes and establish a general model of driver steering styles.Firstly, an experiment is designed to collect the behavioral data under a certain circumstance of the drivers. As driving simulating has significant advantages over the real vehicle, for instance, the replicability and stability of the testing scene, this experiment is conducted on a driving simulator platform with six degrees of freedom (6-DOF). 38 participants (21 males, 17 females) with different personalities and driving experiences are required to drive through a U-shaped testing scene. Meanwhile, data such as velocities, lateral deviations, and steering wheel torques are recorded at a frequency of 60Hz. Secondly, in the data processing part, the Principal Component Analysis (PCA) is utilized to extract key features from original data, aiming to reduce redundancy between steering characteristics. Two principal components are calculated to represent the original features. And then, determining the clustering number as three by both Elbow Method and Silhouette Coefficient, three types of driving styles are classified by the K-means cluster. Finally, after the explanation based on the corresponding original data of lateral deviations, steering wheel torques, and its change rate, the drivers’ proficiencies and path tracking abilities are compared, and the three styles are defined as moderate, radical, and conservative types. In the result analyzing, the driver’s path tracking ability is reflected by smaller lateral deviation, a middle steering wheel torque represents higher proficiency, and the change rate of the torque can show the extent of radicalness. The results show that the moderate driver type has high proficiency in vehicle control, who has more direction adjustments and strong path tracking accuracy. The radical type drivers also manipulate the steering wheel a lot, but their routes have relatively violent fluctuations. While the conservative drivers operate the steering wheel carefully, which displays their lack of driving adeptness.This study identifies the specific characteristics of drivers’ steering behaviors and obtains the parametric boundary of driving styles. In further work, the results can be used as a design basis for customizing shared steering controllers for different driver types in collaborative driving. After identifying the driving style by measuring certain steering indexes, a personalized co-drive mode can be confirmed, which makes the driver feel “the vehicle drives like him/herself”, then the human-vehicle trust and driving experience can be greatly improved.
Human Systems Engineering and Design (IHSED 2021) https://openaccess.cms-conferences.org/#/publications/book/978-1-7923-8987-0
INTRODUCTION
As the key technologies of self-driving are not totally mature, human-vehicle collaborative driving is still the most feasible way to realize intelligent driving in a certain period. In this system, the coordination between the human and machine (H-M) is one of the key studies, as the H-M trust or conflict has a great influence on driving comfort and safety. To achieve a shared controller that can fully coordinate with the driver’s driving preference, it is essential to identify the characteristics of the driver, like driving styles and behaviors.
In previous studies, several classification methods have been performed. For example, a Random Tree classifier of driving features was designed, which was extracted from 51 onboard sensor indexes (Martinelli et al. 2020). Another research divided driver behavior into five classes (normal, aggressive, distracted, drowsy, and drunk) based on vehicle data such as acceleration, gravity, engine speed, vehicle speed, and throttle (Shahverdy et al. 2020). Similarly, by analyzing driver maneuver behavior and vehicle status signals, driving styles such as steady, radical, and general can be clustered through Hidden Markov Process (Sun et al. 2017). Considering the automated driving, overtaking maneuvers data can also be classified to evaluate the divers’ risk level (Figueira and Larocca, 2020).
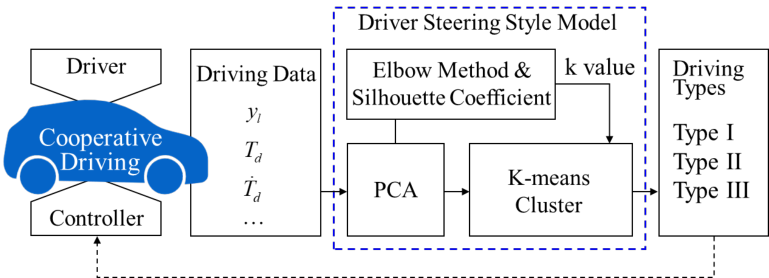
Related works indicated that vehicle parameters and driver physiological data are the main classification index of driver’s behavior. Meanwhile, the performances of path tracking and vehicle dynamics, such as lateral vehicle speed and deviation, are efficient enough to explain driving behaviors. Although the driving behaviors have been effectively classified in previous researches, results of the classification have not been refined to specific control technologies. With the purpose of developing a personalized controller, this research aims to classify different steering behaviors and identify the driving styles. The technological framework of this research is shown in Figure 1.
Figure 1. The framework of classifying driver’s steering behavior
Human Systems Engineering and Design (IHSED 2021) https://openaccess.cms-conferences.org/#/publications/book/978-1-7923-8987-0
In this research, a typical experiment is designed on a driving simulator platform. The original data are analyzed by PCA to reduce their dimensions and redundancy, and then, the k-means clustering algorithm is applied to realize the classification of driver steering styles. Finally, the differences of categories are compared and explained.
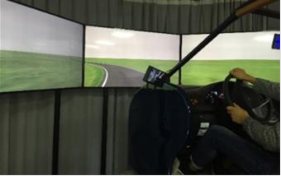
EXPERIMENTAL SCHEME By using a driving simulator with six degrees of freedom (see Figure 2(a)), driving data can be gathered at a frequency of 60 Hz. The hardware and built-in vehicle dynamics model are all from UC-win/Road®, FORUM8 Company®. To research the path tracking maneuver on a large curvature section, a typical U-shaped road is chosen as the test site. The relation of curvature and distance is shown in Figure 2(b).
(a)Driving Simulator (b) Road Curvature
Figure 2. Experiment Scene Construction
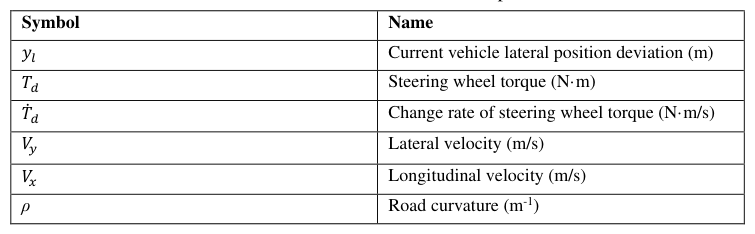
38 adults (21 Males,17 Females, 22-50 years old) with driving licenses are invited as experimental samples, whose driving ages range from 1 to 10 years, with an average of 3 years. The experimental task is driving through the road as their daily driving custom with a constant speed of 45km/s, which is tested as the most significant and stable speed to show the driving style in pre-experiment. Each driver is required to operate the driving simulator platform under normal mental status, which means not feeling nervous or fatigued, and not driving casually because of the virtual scene. Before gathering the drivers’ behavior data, enough practices are ensured for each driver to get familiar with the simulator platform. The whole process lasts about half an hour. The main variables collected in the experiment are displayed in Table 1.
Human Systems Engineering and Design (IHSED 2021) https://openaccess.cms-conferences.org/#/publications/book/978-1-7923-8987-0
Table 1: Main Variables Collected in Experiment Symbol Name
FEATURE EXTRACTION PCA is a multivariate statistical method used to reduce dimensions, replacing the original features with a small number of features that are linearly unrelated. PCA has been widely used in the driving mental status fields, such as fatigue degree analysis and distraction determination (Juboori 2017, Ma et al. 2018). Besides, PCA is an unsupervised dimension reduction method, which has a good dimension reduction effect for data sets without labels. Therefore, it is feasible to extract the driver’s steering behavior features based on the PCA method.
The steering wheel torque and its change rate directly reflect the steering behavior of the driver, and the lateral vehicle position deviation can also indirectly reflect the driving style and driving ability. However, the lateral acceleration and yaw velocity only represent the vehicle’s dynamic performance, so they are not input in this section. The mean value, variance and the maximum absolute value of the test data 𝑦𝑙, 𝑇𝑑 and 𝑇̇𝑑of 38 drivers are calculated as the main characteristics of the driver’s steering behavior: 𝑉= [𝑚𝑒𝑎𝑛(𝑦𝑙), 𝑠𝑡𝑑(𝑦𝑙), max(|𝑦𝑙|) , 𝑚𝑒𝑎𝑛(𝑇𝑑), 𝑠𝑡𝑑(𝑇𝑑), max(|𝑇𝑑|) , max(|𝑇̇𝑑|)]𝑇
Since there exist great differences between the variables’ units of V, the Z-score method is applied to normalize the features. Then, the Kaiser-Meyer-Olkin (KMO) and Bartlett Spherical tests are applied to the features. The KMO value is 0.728, sig. <0.05, meanwhile the approximate chi-square and df values are relatively large, so the test samples can be subjected to principal component analysis.
Through PCA, the eigenvalue and corresponding variance contribution rates of extracted behavior characteristics are shown in Table 2. It can be seen from the table that the cumulative contribution rate of variables 1 and 2 is over 80%, so these two indexes are taken as the principal components of the test samples in this paper.
Table 2: Extracted features and variance explanation
Table available in the original PDF paper.
Human Systems Engineering and Design (IHSED 2021) https://openaccess.cms-conferences.org/#/publications/book/978-1-7923-8987-0
The loading matrix of primary features corresponding to principal components P1 and P2 is shown in Table 3. It can be seen from the table that in features I4, I5, and I6, the first principal component P1 accounts for a large proportion. Similarly, the principal component P2 is mainly explained by the features I1, I2, I3, and I7. Therefore, P1 and P2 can better represent all the features of the original steering behavior data, with their correlation coefficient is calculated as 0.000.
Table 3: Load matrix of principal components Features I1 I2 I3 I4 I5 I6 I7
DRIVING STYLE CLASSIFICATION Clustering is an unsupervised learning method, which is usually used to process low- dimensional data (LeCun et al. 2015). The main reasons for the selection of k-means unsupervised learning algorithm in this section are as follows: firstly, few researchers have made a classification label focusing on drivers’ steering styles, and secondly, defining data labels manually is relatively subjective.
Determination of Clustering Number Applying the k-means algorithm needs to determine an appropriate amount k of clustering, in order to obtain the optimal clustering effect. In general, there are two methods to determine the value of k: the Elbow Method and the Silhouette Coefficient (Yuan and Yang, 2019). The sample characteristics may not be obvious when using a single method, therefore, this paper combines the two mentioned methods to obtain the optimal number of clustering.
On the one hand, in the Elbow Method, the sum of squared errors (SSE), also known as the
Human Systems Engineering and Design (IHSED 2021) https://openaccess.cms-conferences.org/#/publications/book/978-1-7923-8987-0 degree of distortion, decreases with the increase of clustering number k. When reaching a certain critical point, where the decline rate of the distortion degree slows down obviously, the k value here can get a better clustering performance. It can be seen from Figure 3(a), obviously, k=3 can be chosen as the clustering number. On the other hand, the Silhouette Coefficient is an index to define the density and dispersion degree of the clustering. The larger the value, the better the clustering effect. Figure 3(b) displays the variation of the average silhouette coefficient with the amount of clustering. Excepting the k=1 point (no clustering), when k=3, the average silhouette coefficient gets the largest value.
Considering the results of the two methods, k=3 can be input as the clustering amount of the k-means clustering.
(a) Elbow Method (b) Silhouette Coefficient
Figure 3. Results of Elbow Method and Silhouette Coefficient K-means Clustering
Figure available in the original PDF paper.
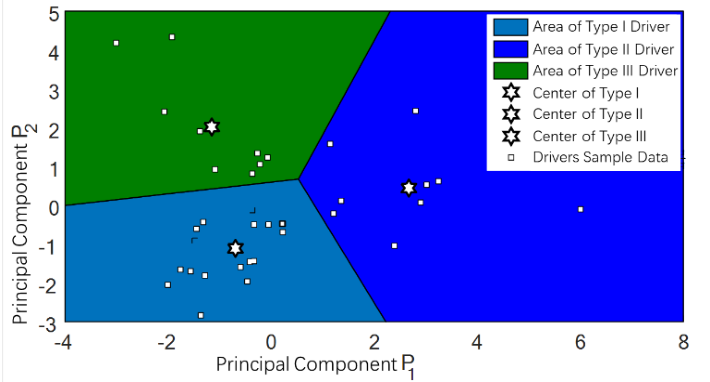
As mentioned above, through the comprehensive analysis of the elbow method and average silhouette coefficient method, the optimal number of clustering for the test data k=3 is determined. Applying the steps of the k-means algorithm, the test data of 38 drivers’ steering behaviors after dimensionality reduction are grouped into three categories, as shown in Figure 4.
Human Systems Engineering and Design (IHSED 2021) https://openaccess.cms-conferences.org/#/publications/book/978-1-7923-8987-0
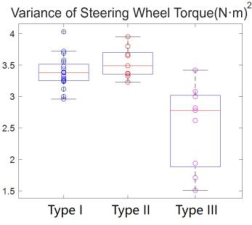
Figure 4. K-means clustering of drivers’ steering behaviors The box diagrams of the maximum lateral deviation, the mean value of steering wheel torque, and the steering wheel torque variance of the three types of drivers are obtained, as shown in Figure 5.
The maximum lateral deviation reflects the driver’s path tracking ability, see Figure 5(a). All values of Type I drivers are below 1.3m, indicating that drivers of Type-I have stronger path tracking ability. On the contrary, both Type-II and Type-III drivers’ values are over 1.27 m, meaning that the path tracking abilities of these two types of drivers are relatively poor.
Combined with Figure 5 (b), the driver’s proficiency can be described. When the mean value
Human Systems Engineering and Design (IHSED 2021) https://openaccess.cms-conferences.org/#/publications/book/978-1-7923-8987-0 of the steering wheel torque is in the medium range, the driver’s proficiency level is higher, as their driving task is not too labored nor cautious for them. Therefore, the proficiency of Type-I drivers is the highest, while that of Type-II and Type-III drivers decreases in turn.
The variance of steering wheel torque depicts the driver’s radical level (Figure 5(c)), which indicates the intensity that the driver modifies the steering wheel, tracking the path ahead. The values of Type-I and Type-II drivers attribute similar, but those of Type-III drivers are significantly lower than the former two groups.
Thus, it can be concluded that the Type-I drivers have a moderate driving style, while the driving style of type-II drivers is the most radical; drivers of Type III are relatively conservative. As mentioned above, in the large-curvature steering process, the overall driving style, proficiency, and path-tracking ability of the three types of drivers can be shown in Table 4.
Table 4: Explanation of three clustering types Driver Type Driving Style Proficiency Path Tracking
Overall, the results show that the moderate driver type has a high proficiency in vehicle control, which has more direction adjustments and strong path tracking accuracy. The radical type drivers also manipulate the steering wheel a lot, but their routes have relatively violent fluctuations. While the conservative drivers operate the steering wheel carefully, which displays their lack of driving adeptness.
CONCLUSIONS
This study identifies the specific characteristics of drivers’ steering behaviors and obtains the parametric boundary of three driving styles by k-means clustering. By analyzing the lateral deviation and steering wheel torque indexes respectively, the three styles are defined as moderate, radical, and conservative. In further work, the results can be used as a design basis for customizing shared steering controllers for different driver types in collaborative driving. After identifying the driving style by measuring certain steering indexes, a personalized co-drive mode can be confirmed, which makes the driver feel “the vehicle drives like him/herself”, then H-M trust and driving experience can be greatly improved.
Human Systems Engineering and Design (IHSED 2021) https://openaccess.cms-conferences.org/#/publications/book/978-1-7923-8987-0
ACKNOWLEDGMENTS
This work is partially supported by the National Natural Science Foundation of China (NSFC) under Grant 52072073, 51675099, U1664258, and the Qing Lan Project of Jiangsu Province. All correspondence should be sent to J. Wang (Email: wangjx@seu.edu.cn).
REFERENCES
Figueira, A. C. Larocca, A. P. C. (2020). Proposal of a driver profile classification in relation to risk level in overtaking maneuvers. Transportation Research Part F: Psychology and Behaviour Volume 74 p.375-385. Juboori, H. (2017). A Real-Time Monitoring System for the Drivers Using PCA and SVM.
International Research Journal of Engineering and Technology Volume 4 No. 6. LeCun, Y. Bengio, Y. Hinton, G. (2015). Deep learning. Nature Volume 521 No.7553. Ma, Z. Yao, S. Li, J. Heled, J. and Yuan, A. (2018). A study of integrated driver fatigue judging algorithm based on principal component analysis. MATEC Web of Conferences Volume 173 p. 02011. Martinelli, F. Mercaldo, F. Orlando, A. Nardone, V. Santone, A and Sangaiah, A.K. (2020).
Human behavior characterization for driving style recognition in vehicle system, Computers & Electrical Engineering Volume 11 p.102504. Shahverdy, M. Fathy, M. Berangi, R. and Sabokrou, M. (2020). Driver Behavior Detection and Classification Using Deep Convolutional Neural Networks, Expert Systems with Applications Volume 149 p.113240. Sun, B. Deng, W. Wu, J. Li, Y. Zhu, B. and Wu, L. (2017). Research on the Classification
and Identification of Driver’s Driving Style. proceedings of the Tenth International Symposium on Computational Intelligence and Design, Hangzhou, ZJ. Yuan, C. Yang, H. (2019). Research on k-value selection method of k-means clustering algorithm. J—Multidisciplinary Scientific Journal Volume 2 No.2.
Human Systems Engineering and Design (IHSED 2021) https://openaccess.cms-conferences.org/#/publications/book/978-1-7923-8987-0
LISTED IN THE AHFE DIGITAL BOOKSTORE CATALOGUE
Explore the complete digital volume
Human Systems Engineering and Design (IHSED2021): Future Trends and Applications
Read this individual research paper free through the original publisher, or explore the full digital proceedings book.
ISBN 978-1-7923-8987-0
Explore this ISBN in the AHFE Bookstore ↗Listed in the July 2026 bookstore catalogue; search by ISBN to confirm current availability · Digital book purchase optional