Karl Tschurtschenthaler, Axel Schulte (2023). Clustering to Determine Interconnected Activities in Supervisory Control Tasks of Pilots. In: Application of Emerging Technologies. AHFE Open Access, vol. 115, pp. 321–330. https://doi.org/10.54941/ahfe1004329
We propose a method that allows pilot activity determination. Such systems are of great interest for assistance systems that adapt to pilot performance. However, the determination of supervisory control tasks is non-trivial since they can only be observed indirectly through pilot actions. Our previous work to determine activities based on evidential reasoning resulted in a highly fragmented pattern of recognized tasks over time. To address this, we suggest clustering these scattered patterns into partitions which better reflect the activities of the pilot. To evaluate the proposed approach, we conducted an experiment in a fast-jet simulator with 11 participants. Using our former approach, we attempted to determine the activities and then applied k-Means clustering to find partitions of interconnected activities. Lastly, we evaluated whether the results could be compared to the activities as reported by the participants. Our results indicate that clustering may not be an effective activity determination method for adaptive assistance systems in Manned-Unmanned Teaming applications.
Aerial Manned-Unmanned Teaming (MUM-T) plays a key role in future mil- itary operations. In these missions, unmanned aerial vehicles (UAVs) are guided by manned aircraft. Accordingly, the pilots’ tasks are broadened by a large number of supervisory control tasks in the cockpit. These tasks include planning, monitoring, and guidance of highly automated vehicles (Chen, Barnes and Harper-Sciarini, 2011). It is known that various prob- lems related to human factors occur in such human-machine interactions (Parasuraman et al., 1992; Parasuraman and Riley, 1997). To resolve these problems, human-centered automation systems incorporate human factors in their design (Billings, 1991). These can also be referred to as adaptive assistance systems.
The working principle of adaptive assistance systems is based on the eval- uation of the pilots’ mental states (e.g. situation awareness or workload) (Feigh, Dorneich and Hayes, 2012). This is required since assistance agents are designed to sense a demand for assistance and then initiate an adequate
intervention strategy. To do this adaptively, the agent must also be aware of the context (Colman et al., 2014).
One key context variable for an appropriate decision on the application of an intervention strategy: what are pilots doing and what goals are they trying to achieve? In the literature, this is often referred to as pilot activity (Schulte, Donath and Honecker, 2016). Moreover, the determination of the activity must be carried out in real-time. Therefore, assistance agents continuously estimate the task context of the pilot and utilize it as a decision criterion for assistance.
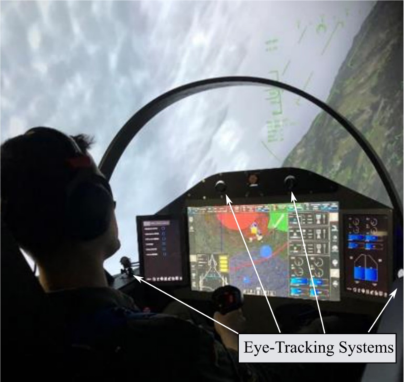
Figure 1: A Pilot operating UAVs interacts with the cockpit interface during an experiment. The touch-sensitive tactical map is used to task the UAVs. Each gaze interaction is tracked and passed by the eye-tracking system. Then, the observa- tion generation in the aircraft interface uses the semantics of each gazed instru- ment to infer what information the pilot perceived at a given time, according to (Mund and Schulte, 2017).
There are several methods for generating observation data for activity recognition. However, activity recognition systems for adaptive assistance require context-rich observations. In this work, we capture manual interac- tions (e.g., button presses) with a touch-sensitive display and gaze interac- tions (e.g., looking at a cockpit instrument) with a gaze-tracker. From this, semantic observations are generated that contain information about which instrument was touched or looked at. This mechanism makes them context rich. Figure 1 shows our setup (cockpit of a fast-jet simulator) in which we apply this mechanism.
Evidential Reasoning Approach for Pilot Activity Determination (Honecker and Schulte, 2017) developed a method that recognizes the tasks being performed by the pilot in real-time. They consider this set of tasks as the pilot activity. They used evidential reasoning for the determination of tasks. For the recognition, each context-rich observation is interpreted as evidence in the sense of the Dempster-Shafer theory. The degree of belief, doubt, and
Clustering to Determine Interconnected Activities 323
ignorance (Dempster-Shafer Triplet) for each evidence was evaluated experi- mentally or defined by expert knowledge. The recognition model considered task dependencies in a hierarchical task model.
Motivation for This Study
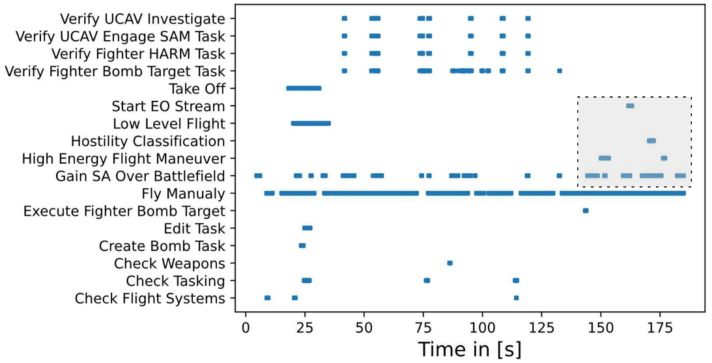
Figure 2 shows results using the described approach in a combat situation in form of a task-time plot. The vertical axis lists the performed tasks. The results were generated by the activity recognition in one of our fast- jet simulators. In the scenario, the task was to suppress a hostile SAM-Site (surface-to-air missile) using an unmanned vehicle. Therefore, the pilot delegates the UAV and monitors the automation task.
The pattern of recognized tasks in Figure 2 appears heavily fragmented in a temporal representation. This mostly originates from the switching of visual attention during the supervi- sory control tasks. These tasks can hardly be performed concurrently and are therefore characterized by fast attention shifts.
Moreover, the approach by (Honecker and Schulte, 2017) can only deter- mine tasks which are directly observable by human-machine interactions. Thus, the results solely show granular, low-level tasks (e.g., button-presses indicate the task Start EO Stream). However, mostly higher-level tasks can be associated with mission tasks and are thus relevant for pilot assistance. According to (Tschurtschenthaler and Schulte, 2023), they occur in the pilot’s working memory and are therefore hidden from the observer. The importance of the determination of higher-level tasks from the evidential-reasoning data approach was also addressed in (Brand and Schulte, 2021).
Figure 2: Activities recognized over time in form of a task-time plot. Data was generated using evidential reasoning. Degree of belief > 0.75 is colored blue. The data shows a typical multitasking situation in MUM-T: The pilot delegates a UAV to attack a SAM- Site and controls the aircraft in parallel (data was collected as part of this study). Tasks in the grey area occur in the context of a superordinate sensor classification task.
324 Tschurtschenthaler and Schulte
We observed that activity recognition results are fragmented, especially for supervisory control tasks. Due to their high number in MUM-T missions, the evidential-reasoning approach misses a higher-level reasoning of the output data. For an expert, some of the scattered tasks are interconnected and repre- sent an occurring superordinate task. Partitioning the task-time plot could be a solution to overcome the issue with supervisory control tasks. For instance, the tasks in the grey section of Figure 2 represent a single classification task of the SAM-Site. This suggests that the scattered tasks share interconnectivity in context of a higher-level task.
This paper presents a method to tackle the determination of the inter- connected partitions by unsupervised clustering. For this, we conducted a data collection experiment and used cluster methods on recognized tasks by (Honecker and Schulte, 2017). Lastly, we compared the resulting clusters with the reported activities of the participants.
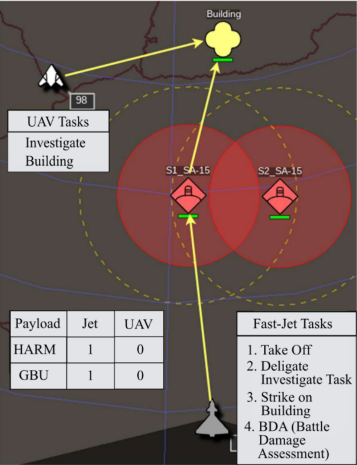
Figure 3: Tactical situation of the experiment block 1a. The map shows the jet (bot- tom), the hostile SAM-Site (red), and the UAV (white). The tasks of the participant and automation are shown in the info boxes (added for this figure and not visible to the pilot).
EXPERIMENT Experimental Setup
For the study, we used a fast-jet simulator as shown in Figure 1. It covers flight, UAV guidance and mission planning tasks within a MUM-T Scenario. It has an exterior view with a heads-up display and three touchscreens as main display elements. Manual interaction with the fighter cockpit is carried out by HOTAS (Hands on Throttle and Stick) for flight control. All other manual
Clustering to Determine Interconnected Activities 325
interaction with the system is done using touchscreens. A four-camera, 60 Hz eye-tracking system from SmartEye® was used for data acquisition. The system can capture gaze on the external view and touchscreens. For activity data generation, we used semantic observation generation and the activity recognition from (Honecker and Schulte, 2017).
Experimental Design The experiment consisted of six experiment blocks. The duration of each block was around 5 minutes and included a main objective to be achieved. It was either the suppression of a hostile building or SAM-Site. The main objective demands execution of several tasks which are relevant in the context of MUM-T. Thus, task performance was kept as naturalistic as possible.
In addition, the difficulty of achieving the main goal increased with each block. The difficulty was intended to be mentally demanding through time and payload constraints rather than complexity. It was decided not to ran- domize the order of the blocks among participants, because we wanted to ensure that every participant experienced the same increase in difficulty. Figure 3 gives an overview of the goal, tasks, and the tactical situation of experiment block 1a.
While designing the experiment, a hierarchical task model for the activity recognition was created. It includes all directly observable and non-directly observable, superordinate tasks. These tasks were relevant for achieving the main objectives of the experimental blocks. Hereby, hierarchically 12 (first level), 4 (second level) and 1 (third level – root) superordinate tasks were created.
Participants We conducted an experiment with 11 participants (male: 10; female: 1) aged between 20 and 34 (mean age 23.6 y; SD: 3.9y). All participants had a high level of experience either in video games (mean hours per week of video games: 6.9h; SD: 7.8h), flight simulators (mean total hours in a fight simula- tion: 42.9h; SD: 83.1h) or flight experience (mean hours of flight experience: 3.9h; SD: 3.1h). Questionnaires showed that all study participants demon- strated a high level of motivation during the study (mean motivation [0; 10]: 9.0; SD: 0.9). To further increase motivation, pilot performance was assessed with a score. Several factors were included in the score, such as resource consumption (payload, fuel, etc.), asset loss and total mission time. For gaze measurement, each participant was calibrated with the eye-tracker just before the start of the experiment. Two of the participants wore contact lenses for the experiments. Eye-tracking calibration data were found to be good (mean accuracy for left and right: 1.71
; SD: 0.35
). All participants provided written informed consent.
Procedure Training for each participant took between two and three hours. Each train- ing consisted of scenarios to train the basics of flying, UAV guidance, sensor- and mission-management. Each participant had to successfully complete
326 Tschurtschenthaler and Schulte
each task (required in each block) at least once. This was to ensure that each participant was sufficiently familiar with the functions required for the experiment.
Before each experiment block, the participant received a short briefing about the mission objective and if constraints applied for the block. The participant was not able to see the tactical map of the block until the simula- tion started. We chose this approach to capture gaze during first sight of the tactical situation. After each block, the score was reported to the participant.
After the experiment, a debriefing was conducted with the participants to protocol what tasks were executed during the block experiments. For this, we asked them to set labels in a task-time plot. During the debriefing, the replay of the simulation was shown to the participants.
Data collection was followed by cluster analysis using the Python pack- ages Pandas and SciKit-Learn (McKinney and others, 2010; Pedregosa et al., 2011).
CLUSTERING OF PILOT ACTIVITIES There are different known methods in clustering for activity recognition, as reported in (Colpas et al., 2020). We decided to use k-Means clustering (kMC) (centroid-based clustering method). It appears to be the most used method in unsupervised activity recognition and a good starting-point for this study. For the clustering itself, we used a two-staged clustering proce- dure: (1) Sorting the tasks on the vertical task scale (as in Figure 2), and (2) applying kMC.
The preprocessing step of sorting is imperative: kMC groups data points together based on the minimized distance to the cluster centroids. However, this cannot be natively applied to nominal scales (see alphabetically sorted vertical task scale in Figure 2). For this, one needs a sorting and distance assumption for the tasks in the vertical scale. For the first stage, we chose two sorting strategies:
1. Model-based sorting (MBS): (Honecker and Schulte, 2017) used a task model to group tasks. Thus, it is plausible to use the task model structure as a basis for sorting the task scales. Sorting was done manually. 2. Connectivity-based sorting (CBS): Reordering of task scales can also be done by searching for connectivity using agglomerative clustering. Such approaches can be used without prior knowledge and reorder items on a scale based on the minimal distance to each other. Using this heuris- tic, tasks which occur simultaneously are grouped together. We used hierarchical clustering as an agglomerative clustering method. Thus, the sorting was done by computation.
kMC requires a predefined cluster number for clustering. We associated the clusters with superordinate tasks from the task model. Therefore, we decided to use 4 and 12 as number of clusters. The Elbow method suggested an optimal number of 4 clusters for most of the data plots.
After the preprocessing with MBS/CBS and clustering with kMC with the cluster number of 4 and 12, we inspected the quality of the cluster results.
Clustering to Determine Interconnected Activities 327
Inspection was done by visually comparing the task-time plots of the debrief- ing protocols with the clustered plots. Subsequently, the quality was then scored.
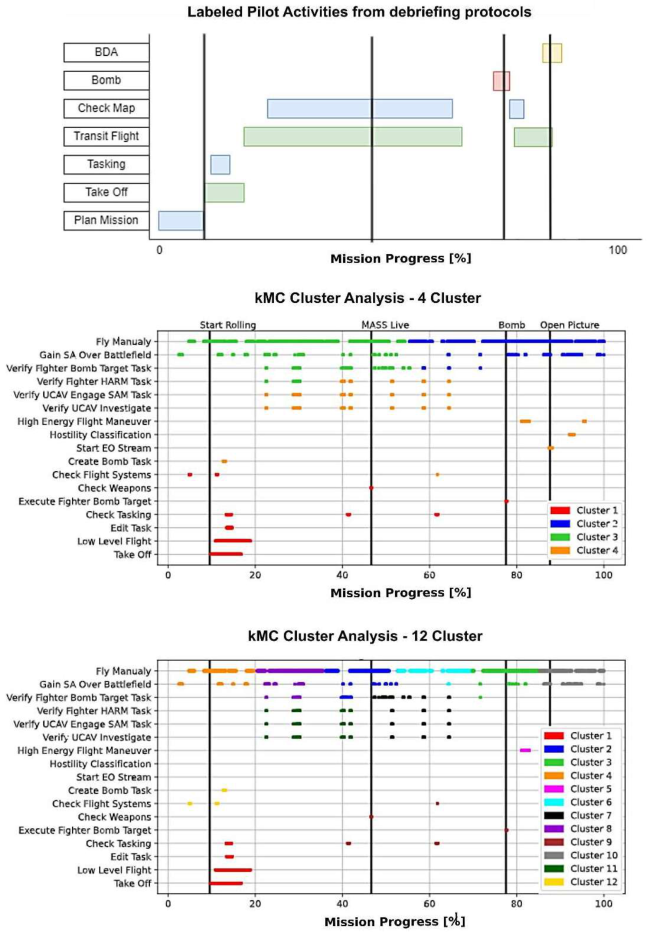
Figure 4: Clustering results from a single participant in experiment block 1a: Task-time plot from the debriefings (top), results of the kMC task-time plot for 4 (mid) and 12 clusters (bottom). Prior to the kMC, CBS was applied to the activity recognition data. The black vertical lines are considered as events (e.g., Start rolling: Begin of Take Off). The long duration task Check map and Transit Flight are determined by the green and yellow clusters in the 4-cluster-plot.
328 Tschurtschenthaler and Schulte
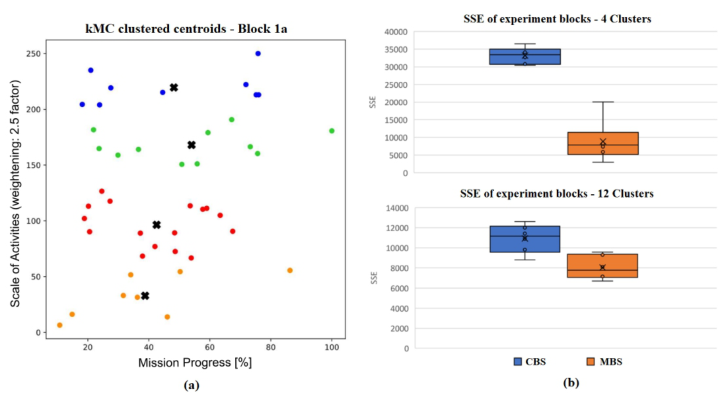
We also wanted to see if the activity data of all participants led to com- parable cluster results to assess reproducibility. To do this, we clustered each participant’s cluster centroids of for each experiment block. Then we used the Cluster-Sum-of-Squares (SSE) to determine the scattering magnitude of all centroid points. We had the assumption that participants showed more similar results which a lower SSE.
RESULTS
Figure 4 demonstrates the clustering results for a single participant in the block experiment 1a as an example. Data was processed using CBS and kMC (4 and 12 clusters). Note that the tasks on the vertical axis are sorted by connectivity when CBS was used (compared to Figure 2).
Table 1. Scores of clustering results created by visual inspection. Score ranges from 0 to 10 (10 is the best, 0 is the worst).
Table available in the original PDF paper.
Clustering Methods Mean Score Standard Deviation CBS and 4 Clusters 6.8 1.9 (27.4 %) MBS and 4 Clusters 9.4 0.9 (10.2 %) CBS and 12 Clusters 6.9 1.8 (25.5 %) MBS and 12 Clusters 9.0 1.2 (13.1 %)
By visual inspection, someone can see that long-duration-tasks (LDTs) show a better match using kMC with 4 clusters (e.g., LDTs like Transit flight). We found that this is mostly true for all participants and blocks. Short-duration-tasks (SDTs) in kMC with 12 clusters slightly better matched with the reported activities. However, SDTs are often grouped together in the plots using kMC. In addition, we found that larger clusters (e.g., in LDTs like Transit flight or Check Map) are often sliced into smaller clusters.
In all approaches, concurrent multitasking for SDTs is difficult to capture by clusters. This can also be seen in the BDA, Bomb, Check Map and Transit Flight tasks at the end of the experiment block in Figure 4.
The scoring of the results by visual inspection can be seen in Table 1. The MBS showed better agreement between the debriefing protocols and the clus- ter results. Also, the score standard deviation in MBS was much lower. The use of expert knowledge in form of a task model seems to be more reliable for grouping tasks than an agglomerative clustering approach. This originates mostly from the grouping assumption by CBS which is based on connectivity by time. However, this connectivity assumption is not fully satisfied in mul- titasking situations: In these situations, CBS groups tasks even though they may be different in contrast of the task context (see Fly Manually and Gain SA Over Battlefield in Figure 4).
Figure 5 shows the SSE values for all clustered centroids. The MBS with 4 clusters is much less dispersed than the CBS with 4 Clusters. This can be explained by the more reasonable task sorting using a task model. Both SSEs in terms of the 12 clusters are much less dispersed. This is mainly due to the reduction of data point outliers by increasing the number of clusters. Overall,
Clustering to Determine Interconnected Activities 329
it can be said that 12 clusters seem to show a high uniform quality of clusters among all participants.
Figure 5: Comparison of clustering results between participants for each experiment block: (a) kMC of the clustered centroids of each participant and experiment block 1a. (b) SSE of all clustered centroids over all experiments for 4 and 12 clusters.
CONCLUSION
The kMC results show that the approach is not able to identify SDTs (e.g., tasks in the task context of UAV guidance or mission planning). This is especially true when two or more tasks are executed in parallel. Greater weaknesses are seen in tasks that exhibit a high degree of task switching (like supervisory control tasks). Also, kMC algorithms solely use data points to determine cluster boundaries. Therefore, time periods with multiple data points are preferred over partitions with fewer data points. LDTs, such as flight tasks (constant usage of HOTAS), are therefore much more repre- sented in the cluster charts. Overall, results show that the clustering approach can provide plausible results but is not suitable to identify tasks as intercon- nected clusters with certain reliability. Moreover, interpretable results usually involve a very high modelling effort.
With the presented clustering approach, it is also very difficult to incorpo- rate the method in a real-time activity recognition. The partition into clusters requires already completed task executions, which does not meet the require- ments of an adaptive assistance system. However, this might be overcome by dynamic clustering. Another approach would be to apply supervised learning methods like support vector machines (SVMs) to the activity data. They can also be used for real-time classification. Labelled data from the debriefing protocols could then be applied as training data. SVMs can lead to reliable classification results even with small data sets. However, this still needs to be tested.
We see that CBS can provide meaningful grouping of tasks in cases where human performance in a human-machine interaction is not fully understood.
330 Tschurtschenthaler and Schulte
Therefore, it could be a viable method to support a hierarchical or cognitive task analysis based on experimental data.
ACKNOWLEDGMENT
The author would like to thank Axel Schulte for his support in the experi- mental design. Furthermore, the author wishes to thank Finn Jensen for the great master thesis that led to this publication.
REFERENCES
Billings, C. E. (1991) ‘Human-centered aircraft automation: A concept and guidelines’, Nasa Technical Memorandum, (February). Available at: https://hdl.handle .net/2060/19910022821. Brand, Y. and Schulte, A. (2021) ‘Workload-adaptive and task-specific support for
cockpit crews: design and evaluation of an adaptive associate system’, Human- Intelligent Systems Integration, 3(2), pp. 187–199. doi: 10.1007/s42454-020- 00018-8. Chen, J. Y. C., Barnes, M. J. and Harper-Sciarini, M. (2011) ‘Supervisory control of multiple robots: Human-performance issues and user-interface design’, IEEE Transactions on Systems, Man and Cybernetics Part C: Applications and Reviews, 41(4), pp. 435–454. doi: 10.1109/TSMCC.2010.2056682. Colman, A. W. et al. (2014) ‘Context in Computing’, Context in Computing,
(December). doi: 10.1007/978-1-4939-1887-4. Colpas, P. A. et al. (2020) ‘Unsupervised human activity recognition using the clustering approach: A review’, Sensors (Switzerland), 20(9). doi: 10.3390/s20092702. Feigh, K. M., Dorneich, M. C. and Hayes, C. C. (2012) ‘Toward a characterization
of adaptive systems: A framework for researchers and system designers’, Human Factors, 54(6), pp. 1008–1024. doi: 10.1177/0018720812443983. Honecker, F. and Schulte, A. (2017) ‘Automated online determination of pilot activity under uncertainty by using evidential reasoning’, Lecture Notes in Computer Science (including subseries Lecture Notes in Artificial Intelligence and Lecture Notes in Bioinformatics), 10276 LNAI, pp. 231–250. doi: 10.1007/978-3-319- 58475-1_18. McKinney, W. and others (2010) ‘Data structures for statistical computing in python’,
in Proceedings of the 9th Python in Science Conference, pp. 51–56. Parasuraman, R. et al. (1992) ‘Theory and design of adaptive automation in aviation systems’, Report No. NAWCADWAR-92033-60, (July 1992), pp. 1–44. Parasuraman, R. and Riley, V. (1997) ‘Humans and automation: Use, misuse, disuse, abuse’, Human Factors, 39(2), pp. 230–253. doi: 10.1518/001872097778543886. Pedregosa, F. et al. (2011) ‘Scikit-learn: Machine learning in Python’, Journal of
machine learning research, 12(Oct), pp. 2825–2830. Schulte, A., Donath, D. and Honecker, F. (2016) ‘Human-System Interaction Analysis for Military Pilot Activity and Mental Workload Determination’, Proceedings - 2015 IEEE International Conference on Systems, Man, and Cybernetics, SMC 2015, pp. 1375–1380. doi: 10.1109/SMC.2015.244. Tschurtschenthaler, K. and Schulte, A. (2023) ‘Concept of an automated activity
determination in the temporal domain for adaptive pilot assistance’, International Symposium on Aviation Psychology.
LISTED IN THE AHFE DIGITAL BOOKSTORE CATALOGUE
Explore the complete digital volume
Application of Emerging Technologies
Read this individual research paper free through the original publisher, or explore the full digital proceedings book.
ISBN 978-1-958651-91-9
Explore this ISBN in the AHFE Bookstore ↗Listed in the July 2026 bookstore catalogue; search by ISBN to confirm current availability · Digital book purchase optional