Márcio F. Catapan, Maria Lucia Okimoto, Mateus Villas Boas, Roberto Waldhauer (2022). Statistical Analysis of the Height of Human Head in the Use of Ballistic Helmets. In: Advances in Ergonomics In Design, Usability & Special Populations: Part III. AHFE Open Access, vol. 20. https://doi.org/10.54941/ahfe1001309
The adequacy and improvements of the artifacts have been the concern of ergonomics, where the focus is the preservation of the physical, mental and social human being. This is the view of the anthropometry which is the measurement science and art of human knowledge of geometry, so it can be defined as the part of anthropology that studies the proportions and measurements of the human body. To defining a new measure anthropometric a statistical study is required with the correct number of samples for the experiment, definitions of the standard deviation and its variance, identification and comparison of means between groups, as the size for example, among other studies as design of the experiment. Knowing that the ballistic helmets used by national armed forces show up discomfort for many users, you must define new measures in the human head for a better dimensioning of the correct helmet proposing a new artifact for that function. Thus in this study a human head anthropometric survey of some potential users ballistic helmets, following a defined statistically, through its basic measures such as circumference, width and height of the head, as well as a new measure that is the height of human head for use of ballistic helmets. This new measure is statistically analyzed for its proof. It is in this scope that fits the purpose of this work that statistically analyzes the height measurement of the human head, based on the sizes of helmets S, M and L and verifies what is the required height for better seating of the product in question. So be correlated which of the measures of the head that is related to this point, in order to check whether it is necessary to analyze this measure for all users or you can check out other measures that are directly related.
Anthropometric analysis of a given population is an essential tool in ergonomic studies of the population . This provides subsidies is essential to measure and evaluate machines , equipment , tools and jobs and also check their suitability to the anthropometric characteristics of users in appropriate ergonomic criteria for the activity performed does not become a factor discomfort and damage to health.
To properly apply the data , it is important to assess the factors that are called anthropometric data , which may vary according to the individual and population physical ( biotype , gender, age ) ( origin, ethnicity , age ) , and other variables as job positions , range limits , technological interface devices , among others ( IIDA , 2005).
As it is not possible to design workspaces, garments of clothing and other products that meet extreme, higher or lower people, one has to focus on satisfying the needs of the vast majority of the population. According to Grandjean (1998 ), ergonomics , working with the share of 95 % of the community , sometimes even 90 % . This portion is called a confidence limit of 95% or, where appropriate, 90%. When choosing a confidence level of 95 % means that 2.5 % of children and 2.5 % of those (the confidence limit) are excluded. The individual percentages are called percentile. It can then say, in this example, which are only considered the values of percentiles 2.5% and 97.5.
Problematic According to Iida (2005) , some products currently produced in certain countries , are marketed throughout the world, eg, planes, computers, television sets, weapons, cars and others, who have virtually worldwide standards . In terms of military alliances such as the Organization of the North Atlantic Treaty - ONAT - and the Warsaw Pact, they demanded certain international standardization of military products , with several implications for industry in general.
Lopes (2005) defines as scarce anthropometric surveys of the Brazilian standard, hindering work on adapting the projects. Thus, in Brazil many of the personal protective equipment are imported from other countries or when produced here, follow the anthropometric standards of the country of origin of the project. This is the case of ballistic helmets that are used by the Brazilian armed forces, the PASGT model (Personal Armor System for Troops Gound) of U.S. origin. (ALVES ET AL., 2011).
Objectives The general objective of this work is to demonstrate a statistical method to analyze anthropometry of the human head for use ballistic helmets.
To achieve this goal, are performed:
Analysis of current experiments anthropometry of the human head;
Experiment and statistical analysis of the human head;
STATE OF THE ART Anthropometry
According to Iida (2005) in the field of anthropometry there are tendencies of global standardization, though no reliable anthropometric measurements for the world population. Most measures available is contingent of the armed forces, because almost all refer to the measure of adult males in the 18 to 30 years. However, the factor that most contributes to these measures differ from the measures of the global population, are the selection criteria adopted by conscription, which exclude, for example, people below a certain height.
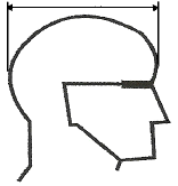
Anthropometry of the head (Cephalometric) Being the main dimensions of the head, Mandeira (2008) mentions that this is divided into the skull and face. As for the skull, focus of this research, one can summarize the main measures:
a) Head length (anteroposterior diameter): It is the distance between the glabella and opistocrânio (external occipital). Corresponds to the anteroposterior diameter of the head.
b) Head width (transverse diameter): It is the distance between êurio on one side and the other on the opposite side. Corresponds to the transverse diameter of the head.
c) head circumference: Is the measurement of the circumference of the head using the plane passing through the glabella and the opistocrânio (external occipital).
These measures can be seen in Figure 1.
a) b) c)
Figure 1. Measurements of the human head region. (Adapted from ABNT NBR 15127, 2008) As seen in Figure 1 and also observed by Ball et al. (2010), traditionally the anthropometric measurements of the human body are one-dimensional, since the use of tape and caliper is common to survey demographics.
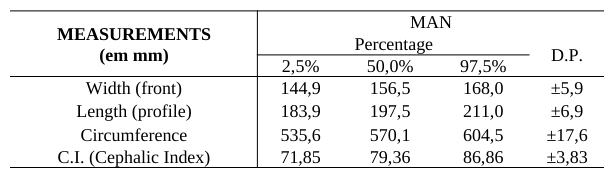
More recent studies on this subject in Brazil is done by Catapan et al. (2014) which reports the anthropometric measurements of the human head as shown in Table 1.
Table 1: Measures of human head Brazilians. (Adapted from Alves, 2012) MEASUREMENTS
With these measures of human heads, just compare the values of ballistic helmets to check the dimensional change and what needs to be improved / studied Combat Helmet
According to Alves (2012) , the combat helmet is also known as ballistic helmet being used in personal shield fighter , following the standards of preparation and approval of the Brazilian Army Command . According to Samil and David (2012), ballistic helmet is a standard infantry equipment that provides ballistic protection from projectiles to the head , ear and neck of the soldier. Moreover, Carey et al. (2000) reports that the head and neck account for only 12 % of the body area that is typically exposed in a battlefield. However receive up to 25 % of all views and nearly half of all combat deaths are caused by head injuries.
Thus, one might suspect that the ballistic helmets are not being used as often as they should in combat troops. A starting point is to analyze whether this artifact is meeting their need to protect the soldier's head, while ensuring an adequate comfort for usage situations.
According to Alves et al. (2011), in Brazil many of the personal protective equipment are imported from other countries or when produced here, follow the anthropometric standards of the country of origin of the project. This is the case of ballistic helmets that are used by the Brazilian armed forces, the PASGT model (Personal Armor System for Troops Gound) of U.S. origin. This helmet is made of four parts: 1) hull, 2) suspension system, 3) fixation system, and 4) pillows for comfort and protection.
The total mass (or weight) of installed combat helmets must meet the standards detailed in the Ministry of Defence (2008), by size, with a tolerance of plus or minus 10%. Table 2 shows these values of weight in relation to the helmet size.
Table 2: Weight of helmets on the size, (Ministry of Defense, 2008).
Table available in the original PDF paper.
DESCRIPTION SIZES S M L XL Total mass of helmets (Kg) 1,30 1,40 1,50 1,70
Importantly, the mass of helmets, presented in Table 3, is statically. That is, in a situation where the user is in movement, for example running, there is an increase in the force of gravity, generating a pressure / force greater than the weight statically. According Samil and David (2012), analyzing simulation done of a soldier running at a speed of 8 km/h (2.2 m/s) over a treadmill, after 180 seconds, the pressure it exerts on the helmet head arrives or 132.56 kPa to 1.3 kgf/m2. According to this author, the helmet has an internal area of 0.14 m2. Therefore, one can estimate that the generated weight is approximately 182,06 N, ie considering gravity 9.81 m/s 2, an additional mass is 18.56 kgF.
Also according Samil and David (2012) in their study with 70 users PASGT ballistic helmet model, it was found that the soldiers feel this added pressure in different regions of the head. In Table 3 we can observe these with their percentage of responses.
Table 3: Regions of discomfort ballistic helmets and their percentages. (Adapted from Samil and David,
Table available in the original PDF paper.
2012)
Region answer number Perceptual (%) Frontal Area 16 21,9 Occipital Area 4 5,5 Parietal Area 40 54,8 Temporal Area 13 17,8
We note that the region that the soldier feels a greater discomfort in the use of ballistic helmet is the parietal area. That is, the top of the head.
If you compare the anthropometric measurements of the ballistic helmet, PASGT model, it is known there is some dimension of helmet that is compromising the ergonomics of users. Table 4 shows these measures. We notice that the circumference values are divided into minimum and maximum values, this is due to the adjustment ballistic helmets have to leave them more or less tight as you need it.
Table 3: Anthropometric measurements in relation to the PASGT helmet sizes. (Adapted from Ministry of defense, 2012)
Table available in the original PDF paper.
DESCRIPTION/SIZE HELMET SIZES(cm) SIZE S M L Width 16,0 16,0 17,0 Length 19,0 20,0 22,0 Internal Circunference: Minimum 47,0 50,0 54,0 Maximum 52,0 56,0 59,0 Cephalic index helmel 84,21 80,0 77,27
Note also that all measures of the helmet also limit the width, length, circumference and cephalic index. However, no one is the height of the helmet as a necessity measure, which contradicting current studies, as the Samil and David (2012) reported that most of the problems of discomfort on the part of users PASGT Helmet, is related to height the head relative to the helmet.
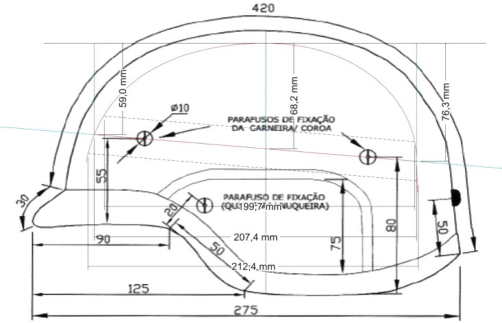
Analyzing the Figures and Tables in this session, we attempted to analyze the rule governing such measures PASGT Helmet of the Ministry of Defence (2008). Using the helmet design size "M" and, knowing the measurements of the positions of fixations, as the chamois and the thicknesses of foam for protection, it is possible to identify other measures the helmet with the use of CAD programs. These are shown in Figure 3, which shows the side view with its main steps and made some highlighted by computational analyzes.
Figure 3: Measurements of height PASGT Helmet. (Adapted from Alves, 2012) Looking at Figure 3, we note that an arch was designed to represent a useful outline of the human head in ballistic helmet. That arc was developing through some information, such as , according to the Ministry of Health (2008), the PASGT helmet has a protective foam from the top of the head to the base of the helmet 10mm thick, and other information of this standard. Using an imaginary line of the fixing points of the headband on the helmet, it is possible to identify these points for the collection of measurements.
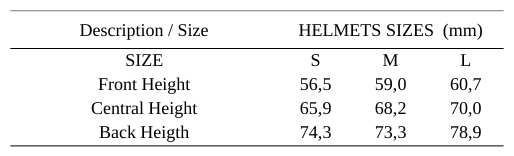
Thus, it appears that the height of the center of the fixing support the top of the head to the center line of the headband is approximately 68 mm for the helmet PASGT "M". Knowing that the width of the ribbon chin guard illustrated in Figure 3 with a dashed line is 25 mm, it is possible to identify the location of the attachment area of the helmet on the user's head. The same analysis was also done for the P and helmets G. The final values of these analyzes are shown in Table 5.
Table 5: Measurements of distances from the heights of PASGT helmets.
In Table 5 it can be seen that the heights are critical in the use of ballistic helmets, since they are directly related to the fixation of the helmet on the human head.
According to the Ministry of Defence (2008) the governing standard specification of this helmet stresses that there is a height adjustment of the helmet, which is approximately 8mm for more and less.
METHODOLOGY AND APPLICATION Here the methodology and its application for the statistical analysis of the height of the human head for use in ballistic helmets through photogrammetry is displayed.
Determination of Sample and Pilot Experiment As there are variations of anthropometric measurements of the human head and knowing that there are no national standards for anthropometric measurements of artifacts, such as ballistic helmet here in Brazil, it takes a matter of necessity for this study.
For the selection of the samples will be randomly selected humans aged 18 to 34 years of any ethnicity and occupation , which is in apparent normal conditions and that do not have lesions in the skull . The WHO - World Health Organization (1995 ), anthropometric dimensions should be based on a minimum sample of 200 people, however, for applications in ergonomics , as it does not require degrees of confidence greater than 95 % , 30 samples 50 subjects are generally satisfactory (measuring separately men and women , adults and children or adolescents ) . As this study is only a pilot experiment , where from this analysis will be pre- determined, statistically , the correct value of the number of samples , 44 samples were analyzed with the conditions mentioned in this article .
The choice of sample size or the number of replicas is essential in any problem of design of experiments. You can use the operating characteristics curves to assist in selection. The characteristic operating curve is a graph of the probability of type II error (β), which is to refuse the hypothesis when it is right, for various sample sizes against values of the parameters under test (MONTGOMERY, 2009) .
Calegare (2009) presents an alternative option for determining the minimum number of replicas so that α and β do not exceed certain values established for the case of the fixed effects model. According to this author, the steps for determining the minimum number of replicas are: a. Establish the maximum permissible errors:
Type I error = α (accepting the hypothesis when it is wrong); Type II error = β (refuse hypothesis when this is right);
The errors of type I and II, α and β, respectively, are defined as 5% each. This value is the most used in such studies.
b. Estimate the variance of the process. In the absence of more precise data, use the QMR (Mean Square Residual) ANOVA (Analysis of Variance) in a pilot experiment. Note here is a very important step for this work, because no need to perform this pilot experiment, since it is not known in this study population variance.
As there are no precise data for this population, seo used QMR (Mean Square Residual) ANOVA (Analysis of Variance ) in a pilot experiment.
As it is not known what is the required number of samples for the experiment to determine the variance, so it is necessary to use the value of the mean square of the ANOVA. For this, one must make a pilot experiment.
To generate this pilot experiment should be made to test any number of samples, provided that at least 30 samples to be significant. (MONTGOMERY, 2009).
Thus this experiment was generated in the work presented Catapan et al. (2014). In this UFPR 42 students were selected from several courses, aged 18 to 34 years and with normal physical appearances. Thus the value of "N" was defined for this study as follows.
According Catapan et al. (2014), the height defined previously took an average of 87.20 mm, with the value of 2.5 % to 78.625 and 98.985 to 97.5 %. To generate groups of divisions between the values for defining the averages of these groups are equal or not, the values of the PASGT ballistic helmet, for setting these values were used. The measure that was used for this separation size was the length of the profile of the head where the following sizes as S (small) to 190mm, M 191 to 200mm and up to size L. Thus, this experiment using ANOVA pilot, Table 6 , as can be seen from this analysis were the values.
Table 5: ANOVA Test Pilot for identification of QMR.
As can be seen in Table 16, the value of the QMR (Mean Square Residual) was 37.09. Ie, this number is used to identify the number of samples needed for this experiment.
c. Calculate the value of the expression is necessary to obtain the values of the "D" of each part of the experiment group (P, M and L), where this value is the square of subtracting the group mean minus the overall average. Thus the value of "D" in this pilot experiment is 80.407.
d. Calculate the value of the expression . Using the value of the item "c" of 80.407 plus the value of "a" (the number of analysis items), which in this case is 3 (sizes S, M and L) and by substituting the value of the σ2 QMR is the value of ϕ2 is 0.0756.
e. Calculate the value of the expression . Extracting the square root of the value of the item d, it follows that ϕ is 0.275.
f. Obtain the value of ϕmin in Table 7, using the degrees of freedom by the equations ʋ2 = a-1 and ʋ2 = a*(n-1) in Table 6, using the degrees of freedom. Used the equations, we have that ʋ1 = 3 and ʋ2 = 3 * (n-1) where “n” is the value you want to find. This case will be assigned values of "n" to know the value of the table and query the value ϕmin.
Table 6: Minimum values of ϕ for values of 5% α and β.
Table available in the original PDF paper.
g. Compare the value of Φmin with Φ. If Φ < Φmin, the number of replicas is insufficient and should be increased. For a better understanding for the analysis of values Φ and Φmin, Table 7 shows what the value of "n" assigned for determining the number of samples in this experiment.
Table 7: Determination of the experimental samples.
Table available in the original PDF paper.
n Φ2 Φ Φmin
67 5,062 2,250 198 2,27
68 5,138 2,267 201 2,27
69 5,213 2,283 204 2,27
70 5,289 2,300 207 2,27
As you can see in Table 7 the value of "n" with the Φ is greater than Φmin is 69. The 69 samples from each group (S size M and L) for determining the value of the height of the human head, for the use of ballistic helmets ie, is necessary. Thus a total of 256 samples, where all men aged 17 to 34 years to make the necessary measurements and analyzes their heads were selected. This study will be described below.
ANALYSES AND RESULTS As described above, using dimensional analysis Catapan et al. (2014), and the steps stated above, the value obtained in the previous step is converted to the actual measurement value.
Taking advantage of this way of measuring human heads with photogrammetry, the view that measures the length of the head, it is possible to analyze the head height to the use of ballistic helmets. This measure is due to the fact that the size of the ballistic helmet is given to your user through its greatest diameter of the head. That is, if a line drawn between the region's largest overhang front and the nape of the person, that coincides with the measurement of the diameter of the head.
Thus the height corresponds to the midpoint of this line profile of the person described in the preceding paragraph, to the top of the head by a vertical line. The graph of distribution of heights is seen in Figure 4.
Figure 4: Distribution of measurements of the heights of the head.
Figure available in the original PDF paper.
Mean height of human heads is 94.55 mm with a standard deviation of 7.2. In order to check this point in relation to helmets P, M and G groups were generated to determine the means of these measures .
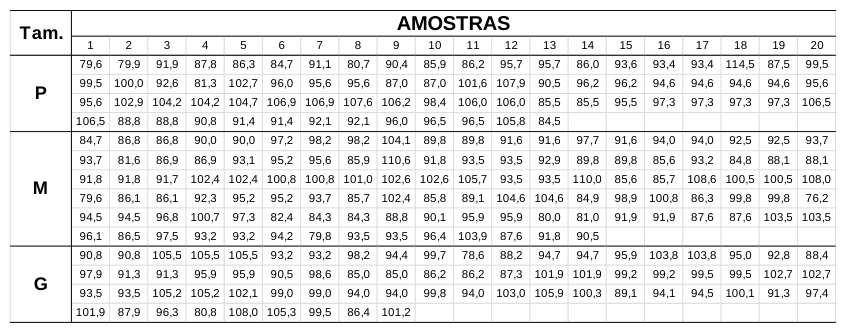
The division of groups were performed using the maximum measurements of ballistic helmets. As shown in Table 13 of this work, the maximum lengths of these devices are limited to 190mm size P, M 200mm and 220mm G. That is, the measures of the heads were arranged in order of increasing length and defined 3 groups with these limitations. Thus, 73 samples with a length of up to 190mm heads, 114 heads related to the size M, and other 69 were analyzed size L.
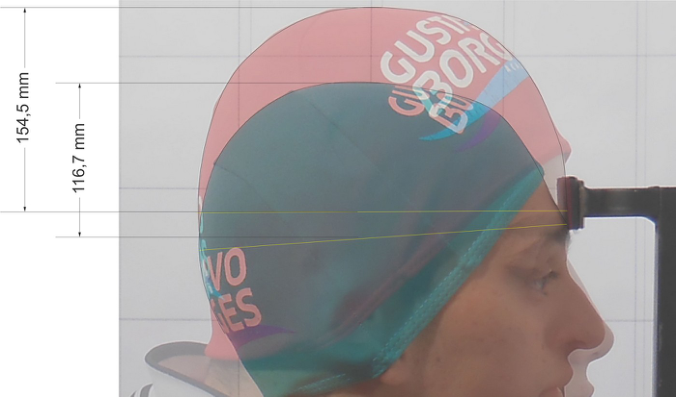
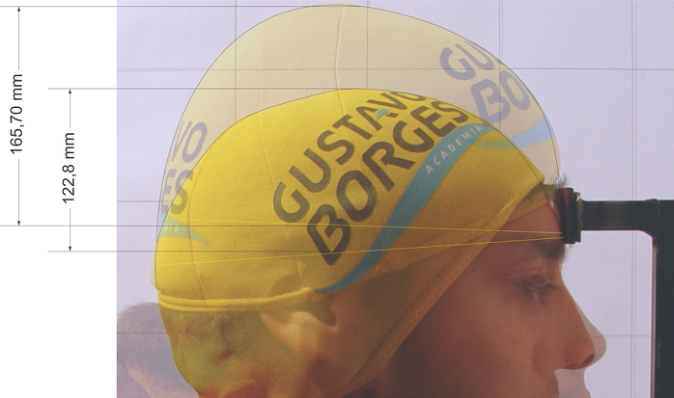
Another analysis was made by overlapping the CAD images. These were made with some groups of individuals, where it can be seen clearly that the human heads have their heights quite anthropometric variations. Figures 5 and 6 show some of these discrepancies in the sizes M and L groups (size Medium and Large) respectively.
Figure 5: Superimposed two heads size "M" Photography.Figure 6: Superimposed two heads size "G" Photography.
Importantly, the measures presented in Figures 5 and 6 still need to go through the adjustment of the values described in the previous section of this paper. Thus, it is possible to make some statistical comparisons for the analyzes presented in this section, as well as a comparison of the measures of current helmets.
Comparison of experimental data This task aims to determine the heights found in the experiment correspond to the height of the current ballistic helmet. For this, the first activity to do is check if the means of the groups sizes S, M and L are the same or different. Thus there is generated a variance analysis in this experiment.
Before the generation of ANOVA, it is necessary to emphasize that this study aims to analyze the values of head height explained in the previous task, where they had three groups that are differentiated by the size of the maximum length divided by S, M and L. These separations are shown Table 8.
Table 8: Division of heights heads of the groups in length AMOSTRAS Tam.
The analysis will verify that the heights of the heads are different within a limit of 95% reliability. First it is necessary to describe the hypotheses of solutions, where: H0: μ1 = μ2 = μ3.
It is noted that in this experiment ANOVA is found the value of "F calculated" whose value is 3.73. Searching in Montgomery (2009) table for this situation the value of the "Tabulated F" is 3.03. Ie, as the fest is bigger than Ftab rejects the hypothesis H0 where the averages are equal. That is, it can be said that the at least one medium S, M or L are different within the reliability limit of 95%.
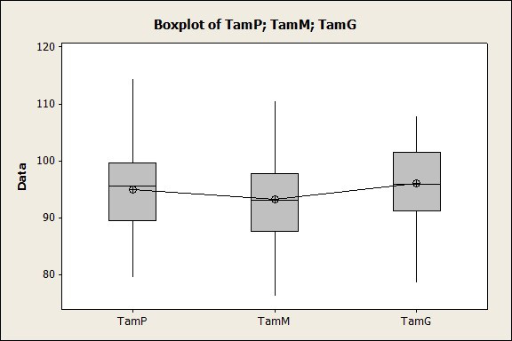
This way you can verify through testing to verify the normality of residuals, homogeneity of variances among others. The following will be presented a graph showing the Box plot to check for extreme values for the models presented. This is seen in Figure 7.
Figure 7: Boxplot of the measures of the heights of the head.
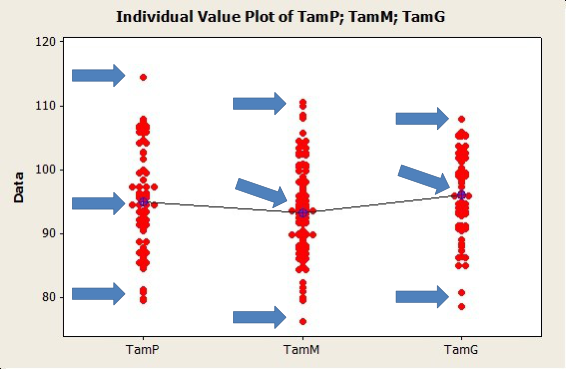
We notice that the graph of Figure 7 is not necessary to extrapolate the boxes containing the measures. This means that all values are properly distributed within the expected range. However, the risks within boxes are displaced from the centers of the groups P and L sizes, which means that there is no normal in these groups.
One can be more precise about these graphical analyzes. This is the case with the Tuckey test demonstrates that some values are extrapolate the other. This demonstrates that these values are lower or higher in each group. This can be seen in Figure 8.
Figure 8: Tuckey test measures the heights of the head
Checking over the sink in Figure 8 minitab program, you can check what those measures are furthest from the other measurements in each group. Well, with a shift to a more detailed analysis of these samples, eg the three- dimensional analysis. In this same figure were highlighted with a blue arrow which samples continue the analyzes with 3D scanning will. We notice that samples reached the average of each group will also be analyzed, so that they can make better comparisons.
CONCLUSIONS
In the study presented in this article stood out initially that the ballistic helmets have heights determined for P, sizes M and L. However, if we compare these values whose average is 94.2 mm and the standard deviation is 7.2 mm, with measures heights helmets shown in Table 14, are well above the values of 59, 68.2 and 73.3 mm from the heights of helmets S, M and L, respectively.
This demonstrates that the ballistic helmets need to be redesigned to use the military here in Brazil and the world. Thus concludes an issue that still needs to be further this line of research. However, it is important to note that work is already being made in a doctoral thesis, which will heal all these unknowns shown in the above topics.
REFERENCES
Alves, H. A., et al.. Análises dos Parâmetros Antropométricos da Cabeça dos Militares da Força Aérea Brasileira no Projeto de Capacetes Balísticos. Revista Brasileira de Biomedicina, V.29, n.3, p. 472-492. 2011. Alves, H. A., Análise dos Parâmetros Antropométricos no Projeto de Capacetes Balísticos. Tese de Doutorado do Programa de
Pós-Graduação em Engenharia Biomédica da Universidade do Vale do Paraíba. São José dos Campos, SP. 2012. Barroso, M. P., et al. Anthropometric study of a Portuguese workers. International Journal of Industry Ergonomics, n. 35, p. 401- 410, 2005. Catapan, M. F., Okimoto, M. L. R, Villas Boas, M. N., Waldhauer, R. Análise Antropométrica da Cabeça Humana Para
Identificação da Altura Adequada no Uso de Capacetes Balísticos. 14º ErgoDesign. Congresso Internacional de Ergonomia e Usabilidade de Interfaces Humano-Tecnologia. Joinville - SC. 2014 Iida, I. Ergonomia – Projeto e Produção.2. Ed. São Paulo: Editora Edgard Blucher, 2005. Kouchi, M., Mochimaru, M., Analysis of 3D face forms for proper sizing and CAD of spectacle frames. Ergonomics 47. (2004), 1499–1516. Meunier, P.; Yin, S. Performance of a 2D image-based anthopometric measurement and clothing sizing system. Applied
Ergonomics, n. 31, p. 445-451, 2000. Ministério da Defesa – Norma do Exército Brasileiro – Capacete Nível III A. Norma (DMI) DS / C1 II, nº 009/2008 – Elaborado pela Sec. Sup. C1 II / DS, 2008. MONTGOMERY, D. C. Design and Analysis of Experiments. New York: John Wiley & Sons, 2009. OMS - Organização Mundial de Saúde. Physical status: the use and interpretation of anthropometry. In: Report Of A Who Study
Group, 1995, Genebra. Thecnical Report Series. Rodrigues-Añez, C. R. Antropometria e sua aplicação na ergonomia. Revista Brasileira de Cineantropometria & Desenvolvimento Humano, v. 3, n. 1, p. 102- 108, 2001. Samil, F., David, N. V., Na Ergonomics Study of a Convencional Ballistic Helmet. International Symposium on Robotics and
Intelligent Sensors 2012 (IRIS 2012). Malaysia. Engineering Procedia. Pag 1660-1666. (2012). Silva, K. R. et al. Avaliação Antropométrica em industrias do pólo moveleiro de UBÁ, MG. Rev. Árvore, Viçosa, v. 30, nº 4, p.
613-618, jul./ago. 2006. Yokota, M., Head and facial anthropometryof mixed-race US Armymale soldiers for militarydesign and sizing: a pilot study.
Applied Ergonomics 36, (2005). pag. 379–383.
LISTED IN THE AHFE DIGITAL BOOKSTORE CATALOGUE
Explore the complete digital volume
Advances in Ergonomics In Design, Usability & Special Populations: Part III
Read this individual research paper free through the original publisher, or explore the full digital proceedings book.
ISBN 978-1-4951-2108-1
Explore this ISBN in the AHFE Bookstore ↗Listed in the July 2026 bookstore catalogue; search by ISBN to confirm current availability · Digital book purchase optional