Dimitris Spiliotopoulos, Athanasios Dalianis (2022). Technically Challenging Human Factors Issues for a Policy Argumentation Approach. In: Advances in Ergonomics In Design, Usability & Special Populations: Part I. AHFE Open Access, vol. 18. https://doi.org/10.54941/ahfe100786
This work addresses the user requirements of an authoring environment interface for creation and appraisal of policy domains and models. This paper focuses on the technical considerations and challenges for the design phase requirements and modeling solutions during the first iterations for the user-driven development lifecycle. It presents the results of the focus group sessions as well as the main interaction tasks tested with the prototype version of the user interface. The technically challenging issues regarding the modeling of the interaction with complex visual structures such as tree-based hierarchies, mindmaps and graph representations are presented.
Ontologies have been used extensively over the recent years for semantic web data. Visualizing ontologies has unavoidable been in the center of research since it has been used by developers and end users in order to visually access the relations between the data. Several tools exist that provide this functionality based on the different methods of visualization depending on the actual needs (Katifori et al., 2007).
As part of the NOMAD1 research project, a toll was designed to allow the user to create, modify, and test ontology domains and policy models. In general, NOMAD aims to aid modern politicians, political researchers and consultants in testing, detecting and understanding how citizens perceive their own political agendas, by analyzing data on the informal web (e.g. forums, social networks, blogs, newsgroups and wikis), so as to gather useful feedback for immediate action and reaction. In this way, politicians and other target users can create a stable feedback loop between information gathered on the Web and the definition of their political agendas based on this contribution.
The necessity derived from the above process is an interface that should, not only facilitate but also, actively drive the users to successfully author - collaboratively create, test, deploy and validate - policy formulation. The original aim was to design a visually driven approach that would act as a continuous input provider to the analysis processing tools by feeding information in a hierarchical form. The authoring process gives to the domain expert or the policy maker, the opportunity not only to create a new domain/policy or edit one of his own by simply creating or updating the model’s components (entities, arguments, etc.), but also to reuse components belonging to other domains or 1 NOMAD, Policy Formulation and Validation through Non-moderated Crowdsourcing, http://www.nomad-project.eu Ergonomics In Design, Usability & Special Populations I (2022) policies owned by the user or publicly available by other users of the policy argumentation platform, thus providing more collaborative characteristics to the tool.
Existing research reports on the tools and methods for creating ontologies (Corcho et al., 2003). The domains and models used in this work are partially created by public sector users who traditionally are part of the decision making and need to access the information on several levels (Brusa et al., 2008). Especially relevant to this work is the fact that among several options that exist in the literature on visualizing ontologies, the main chosen approaches are hierarchy trees and graphs (Fu et al., 2013).
This paper presents the user requirements for the above task and the results from the user evaluation during the first iteration of the design phase. Examples of visualizations for the domains and policies are examined and the user feedback is presented. The technical considerations
USER REQUIREMENTS Collection
Initially an on-line questionnaire survey was compiled and focus group discussions were organized to collect feedback and opinions, in order to better identify the necessary features of the proposed approach. The focus groups involved policy makers, policy communication experts and technology researchers and providers. This way a large data sample providing initial information about what the users need about domains and policy formulation was swiftly gathered. The user requirements process was assisted with an early monitoring and analysis of existing systems and relevant approaches aiming to enable the design team to cross check what the users reported they needed with what they were really looking after during the interaction with the system.
Prototyping After the participant observation, the analysis of the data initiated the brainstorming phase that lead to the creation of storyboards and prototypes focusing on the needs of the users. It also enabled the identification of the most representative user types that would be used later on to refine the requirements of the system. A series of visualization tools can be used to represent domains and policies. The initial prototypes mainly used combinations of trees and mind maps as solutions for the needs for representing ideas in a structured form.
Ergonomics In Design, Usability & Special Populations I (2022)
Figure 1. Policy domains as hierarchy trees and mind maps VISUALIZATION – USER EVALUATION
Figure available in the original PDF paper.
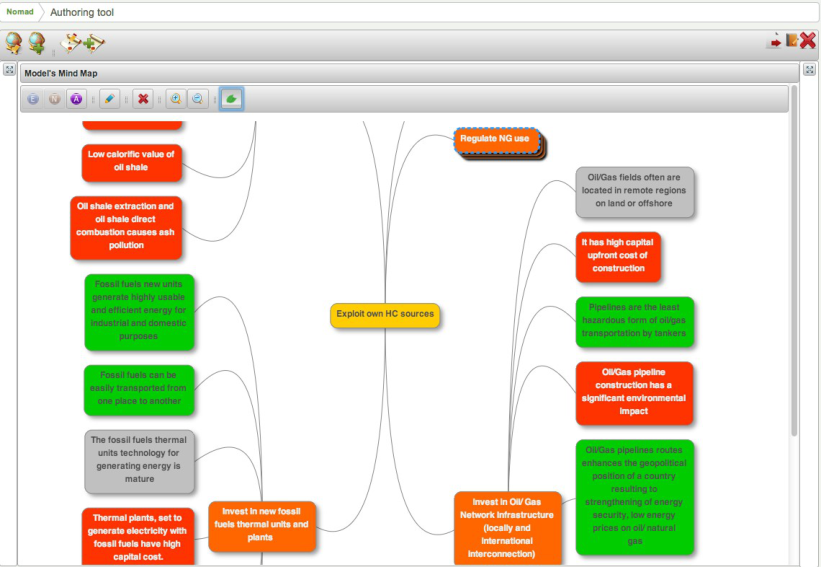
Thirty participants evaluated the initial approach where the domains (fig.1) and models (fig.2) were visualized as hierarchy trees and mind maps. They are both used at the same time in order to provide a simple solution for editing the domains.
The root concept of the mind map, depicting the police or domain, was placed at the center of the page. This allowed the users to depict different concepts, like policy components or arguments and their associations moving towards in all directions, thus making it easier to review and recall the produced domain or policy. Editing of the nodes and providing additional functions like zoom in/out and toggle/ collapse were also added to support the prototype environment. Tree hierarchies were used to provide high-level representation of the information and enabled the reuse of the components by dragging and dropping the nodes from the public/private trees to the tree of the model under construction.
Figure 2. Policy model as mind map.
The issues that were identified had to do with the interaction itself. Although, the combined use of hierarchy trees and mind maps provided a well received approach on ontology domain authoring, it was limiting in two ways. First, the interchangeable, free editing functionality between trees and mind maps that was aiming to cover both inexperienced users, although it was well received, had a limiting factor by design. It cluttered the interface for larger domains. Trees we long and mind maps would become to large to follow. The second and most deciding factor was the flattened description that hierarchy trees and mind maps inherently support. The nodes have to follow hierarchies, while the more elaborate policy models are more complex, a perfect requirement for a graph-based solution.
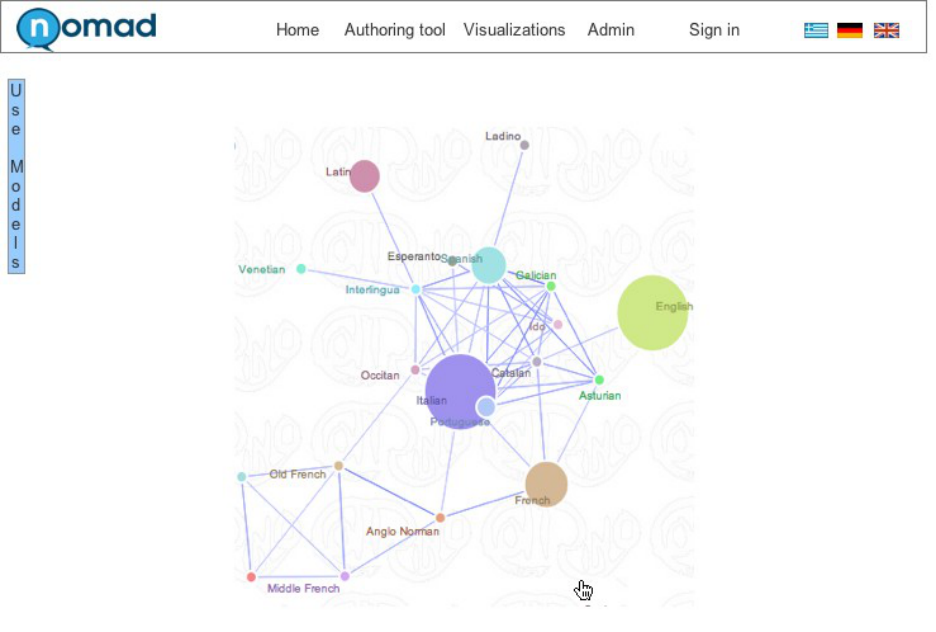
The second round of focus groups and interviews of the representative users using the initial interactive prototype, revealed additional, follow-up requirements that lead to a more enhanced design of the system. This design, among Ergonomics In Design, Usability & Special Populations I (2022) others, finds more suitable for policy main representation tool the graph instead of the mind map (fig.3). Graphs share all the advantages of the mind maps in terms of clarity and can also support the more complex relations between the data. As a result the interaction design changed to allow the users the flexibility of rapid creation of the policy domains and models. Significant improvement of the user interaction was achieved by eliminating unnecessary process steps and apply additional UX heuristics.
Figure 3. Policy domain as graph.
CONCLUSIONS
This paper presented the prototypes and evaluation results of a policy modeling authoring environment. The participants interacted with the prototypes and provided feedback on the use of hierarchy trees, mind maps and graphs for the specific domain dependent use case. Earlier research findings on the arguments in favour of using trees or graphs for ontology visualization were verified and extended in the case where users not only view but also create the domains.
ACKNOWLEDGEMENTS
The work described here was partially supported by the EU ICT research project NOMAD, FP7-ICT-288513.
REFERENCES
Brusa, G., Laura Caliusco, M., & Chiotti, O. (2008). Towards ontological engineering: a process for building a domain ontology from scratch in public administration. Expert Systems, 25(5), 484-503. Corcho, O., Fernández-López, M., & Gómez-Pérez, A. (2003). Methodologies, tools and languages for building ontologies.
Where is their meeting point?. Data & knowledge engineering, 46(1), 41-64.
Ergonomics In Design, Usability & Special Populations I (2022)
Fu, B., Noy, N. F. & Storey, M.-A. D. (2013). Indented Tree or Graph? A Usability Study of Ontology Visualization Techniques in the Context of Class Mapping Evaluation. In H. Alani, L. Kagal, A. Fokoue, P. T. Groth, C. Biemann, J. X. Parreira, L. Aroyo, N. F. Noy, C. Welty & K. Janowicz (eds.), International Semantic Web Conference (1) (pp. 117-134), Springer. ISBN: 978-3-642-41334-6 Katifori, A., Halatsis, C., Lepouras, G., Vassilakis, C., & Giannopoulou, E. (2007). Ontology visualization methods—a survey.
ACM Computing Surveys (CSUR), 39(4), 10.
Ergonomics In Design, Usability & Special Populations I (2022)
LISTED IN THE AHFE DIGITAL BOOKSTORE CATALOGUE
Explore the complete digital volume
Advances in Ergonomics In Design, Usability & Special Populations: Part I
Read this individual research paper free through the original publisher, or explore the full digital proceedings book.
ISBN 978-1-4951-2106-7
Explore this ISBN in the AHFE Bookstore ↗Listed in the July 2026 bookstore catalogue; search by ISBN to confirm current availability · Digital book purchase optional