SungHak Chung (2018). Development of BAC Consumption and Related Structure Equation Model on Korean Driver. In: Advances in Physical Ergonomics and Human Factors: Part I. AHFE Open Access, vol. 1. https://doi.org/10.54941/10022
This study is to provide the criteria necessary for justification on any administrative measure possible to revoke ones driving license or to legally punish any person who has been under the influence whilst driving. The alcohol concentration in blood/breath was measured in this research through the drinking culture habits. The conclusion of this study estimates per hour, the average consumption rate of BAC (β) -0.0178g/kg and SD was 0.00497. Then, a consumption rate of the BAC will be calculated out through the multiple regression analysis thereof. A structural equation model of the effect that the drinking culture habit and the consumption rate of the BAC have on unsafe human behavior tendency factor is expressed in a model. In this study, a questionnaire on behavioral response whilst under alcohol influence, physical characteristics and personality test was conducted, also included was the alcohol test of NHTSA and the WHO alcohol test.
The objective of this study is to provide material for legal punishment on drunk driving by estimating the consumption rate of blood alcohol concentration (BAC) and to understand the structure between drinking culture habits (DCH), personality, behavior response under alcohol influence (BRAI) and unsafe human behavior tendency factors (UHBT). Also this study can be utilized as a rationale for legal disciplinary measures or penalties if a driver has caused an accident while driving under the influence and needs to take the responsibility or if the BAC at the time of driving needs to be estimated because of the refusal to allow use of a breathalyzer or fleeing for the scene of incident or time delay.
NHTSA (1981) had been considered the case as drunk driving when the BAC was over 0.8mg/ml. Widmark (1922) provided an alcohol consumption recommendation that defines 0.68mg/ml/h (±0.085) for male, 0.55mg/ml/h (±0.055) for female. Jones and Anderson (1996) verified Widmark’s study. Jones (1999) analyzed the consumption rate of BAC(β) by taking blood samples with intervals of approximately 60min(average 68min, 30 to 120min) from 1,090 subjects who were identified as drunk driving. The subjects included 976 male (BAC average 1.88mg/ml/h) and 114 female (BAC average 1.86mg/ml/h). While female’s average consumption rate of BAC (β) was -0.214 mg/ml/h (±.0.053), male’s average was -0.189 mg/ml/h (±0.048) and total average of consumption rate of BAC (β) was -0.191mg/ml/h (±0.049) with 95 percentile confidence interval from 0.09 to 0.29 mg/ml/h. β value declined sharply at a definite point and was not influenced by age. The reduction rate of BAC depends on personal variables, but it changed in accordance with alcohol consumption, setting an upper and lower limit of consumption rate. To analyze drunk driver’s behavior relationship, research has been conducted into drinking culture habits (amount of drinking, frequency of drinking, type of alcohol, frequency of drinking per week, age, gender, weight, height, marriage status, education, occupation, type of vehicle, type of license, driving experience), NHTSA alcohol test, human error and character(Jones, 1989, Eysenck and Eysenck, 1991, Cloninger et al., 1991, Stuster and Burns, 1998, Babor et. al., 2001, Brinkmann et. al. 2002).
METHOD
Table 1: Subjects Inject level
The BAC was measured after fasting the subjects for six hours. The injection amount was divided into three portions and each portion was taken within 10min with total alcohol injection not exceeding 30min. After taking the alcohol, blood was drawn 6-8 times at 30min intervals. Depending on the injected amount, it continued for 180min to 240min.Blood was collected to measure BAC through GC analysis. Breath alcohol concentration was measured with a SD-400 Breath alcohol analyzer by Lion Inc. of the UK. This device is currently used by the police force, at intervals of 10~15 min up to 180~240 min depending on the injected amount. In order to understand the BAC relative to the injected amount, the BAC was measured every hour for each injected amount and the group was marked in a graph as points representing alcohol consumption, which drop from the peak BAC. Then, a regression analysis was conducted on each individual’s result based on the slope.
Also, NHTSA alcohol test, WHO alcohol test, drinking habit survey, and personality scale (TPQ/ESP/Safety Character) were conducted. These Alcohol tests examined three tendencies: damage to ones reputation and social functions, behavioral problems, and damage to family and inter-personal relations. In a personality scale, the questionnaire included 21 tendencies as follows: Psychoticism (P), Extraversion-introversion (E-I), Neuroticism (N), Deceit (L), Novelity seeking (NS), Harm avoidance (HA), Reward dependence(RD),High exhaustiveness (EE), Weak-willed (WW), Impatient (I), Loose-fitting (LF), Lacking self-control (SL), Rashness (R), Uncooperative (UC), Nervous temperament (NT), Information acceptance confirmation error (IACE), Habitual behavior confirmation error (HBCE), Conscious discontinuance error (CDE), and Oblivion error (OE). Verification and validation (V&V) was measured (Eysenck and Eysenck, 1991, Cloninger et. al., 1991, Masada, 1989). Based on these measurements, inter-relations of unsafe human behavior amongst drivers attributable to drunk driving were presented in a structural equation.
RESULT
The results of BAC for the 0.35g per bodyweight group are shown in figure 1. Although it was similar with the 0.35g/kg group, its declining slopes were greater than those of the 0.35g/kg group. Also 1.05g/kg group are presented in figure 2. While the 0.68g/kg group reached its peak between 30 and 35min, the 1.05g/kg group marked its peak between 40 and 45min. The consumption rate of BAC (β) was calculated one hour after drinking as described below. The per hour average consumption rate of BAC (β) was -0.0178g/kg and the standard deviation (SD) was 0.00497.
BAC 0. 35 G roup
B AC
0. 19 0 0. 20 0
1 2
0. 17 0 0. 18 0
0. 16 0
3 4
0. 14 0 0. 15 0
5 6 2
0. 12 0 0. 13 0
6 2 7
0. 10 0 0. 1 0
0. 09 0
2 8
0. 07 0 0. 08 0
3 0 3
0. 05 0 0. 06 0
1 3 2
0. 03 0 0. 04 0
0. 02 0
4 0
0. 0 0 0. 01 0
1 0 20 30 6 0 90 130 1 60 19 0
Ti me
Figure 1: Result for BAC 0.35g/kg Group
Figure available in the original PDF paper.
BAC 1.05 Group
21
2
B AC
23
0 .2 0
24
0 .1 80
25
47
0 .1 60
48
0 .1 40
50
52
0 .1 20
54
0 .1 0
5
57
0 .0 80
58
0 .0 60
59
60
0 .0 40
61
62
0 .0 20
64
0 .0 0
72
10 2 0 3 0 60 9 0 1 20 1 5 0 18 0 1 90
Tim e
Figure 2: Result for BAC 1.05g/kg Group
Figure available in the original PDF paper.
Result of ANOVA is shown in table 2. Due to the difference of the comparison analysis by gender, age, and result of the average consumption rate of BAC. Difference by gender and age groups were not significant but difference by the injected amount was significant (p<0.01). Interaction showed no significant difference. But, interactions of gender and injected amount, age group and injected amount, and gender, age group, and injected amount showed significant difference (p<0.01).
Table 2: Result of ANOVA for BAC Source d.f. SS MS effect F p-level Gender (1) 1 0.00001116 0.00001116 1.05 n.s. Age group (2) 1 0.00001207 0.00001207 1.14 n.s. Alcohol level (3) 1 0.00029800 0.00014900 14.02 P<0.01 (1)×(2) 2 0.00004209 0.00004209 3.96 n.s. (1)×(3) 2 0.00019273 0.00009636 9.07 P<0.01 (2)×(3) 2 0.00014921 0.00007460 7.02 P<0.01 (1)×(2)×(3) 2 0.00008088 0.00004044 3.81 P<0.05
The result of calculating per hour average consumption rate of BAC by gender and by age based on the average consumption rate of BAC is shown in table 3.
Table 3: Average consumption rate of BAC
Table available in the original PDF paper.
The subjects were divided by gender and multiple regression analyses were conducted on the inter-relations of BAC against age, time, and injection amount per bodyweight.
Total BAC = -0.01429*T+0.00031*A+0.09667*Al-0.00327*Gender+0.01337 R-sq. 0.6446 T(time; hour), A(age), Gender(male;1, female; 0), Al(inject alcohol amount per bodyweight; g/kg)
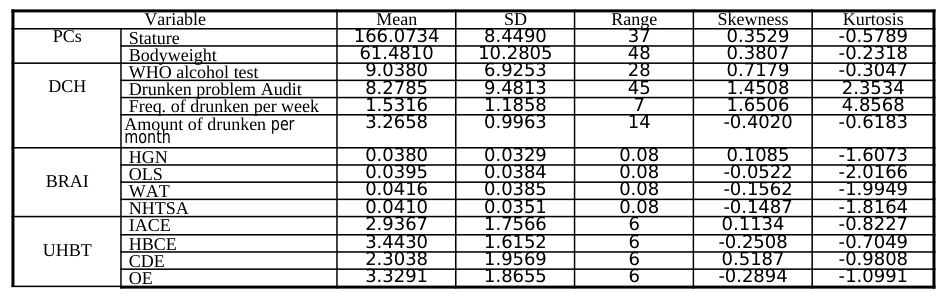
Also, this study provided a structural equation model of the effect that the drinking culture habit and the consumption rate of the BAC had on unsafe human behavior tendency factor was expressed in a model. Results of these measurement statistics is shown in table 4.
Table 4: Descriptive statistics Variable Mean SD Range Skewness Kurtosis PCs Stature 166.0734 8.4490 37 0.3529 -0.5789 Bodyweight 61.4810 10.2805 48 0.3807 -0.2318Table 5: Test of hypothesis No Hypothesis 1 Physical characters (PCs) affect consumption rate of BAC 2 Physical characters (PCs) affect Unsafe human behavior tendency factors (UHBT) 3 Drinking culture habit (DCH) affect NHTSA alcohol test results 4 Physical characters (PCs) affect behavior response under alcohol influence (BRAI) 5 Consumption rate of BAC affect behavior response under alcohol influence (BRAI) 6 Unsafe human behavior tendency factors (UHBT) affect behavior response under alcohol influence (BRAI)
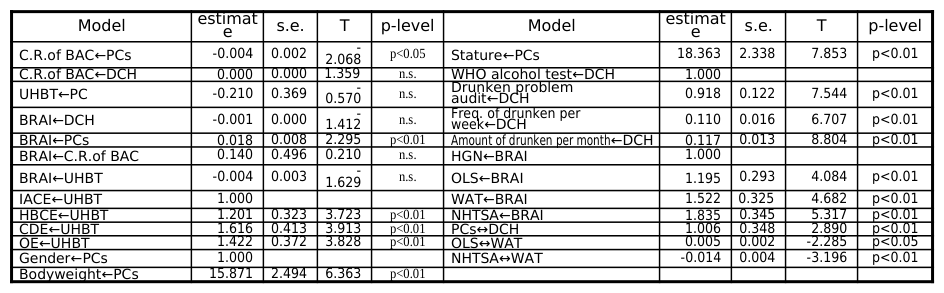
Hypothesis 1 (PCs affect consumption rate of BAC), the null hypothesis was rejected since p-level between PCs and consumption rate of BAC was significant at 0.039. Hypothesis 2 (PCs affect UHBT) and hypothesis 3 (DCH affect NHTSA alcohol test results) were not significant. Hypothesis 4 (PCs affect BRAI) showed significance (p<0.01) between PCs and BRAI. Hypothesis 5 (Consumption rate of BAC affects BRAI) and hypothesis 6 (UHBT affect BRAI) turned out to be insignificant.
Table 6: Fitness of optimal model
Table available in the original PDF paper.
Table 7: Result for optimal model Model estimat e s.e. T p-level Model estimat e s.e. T p-level
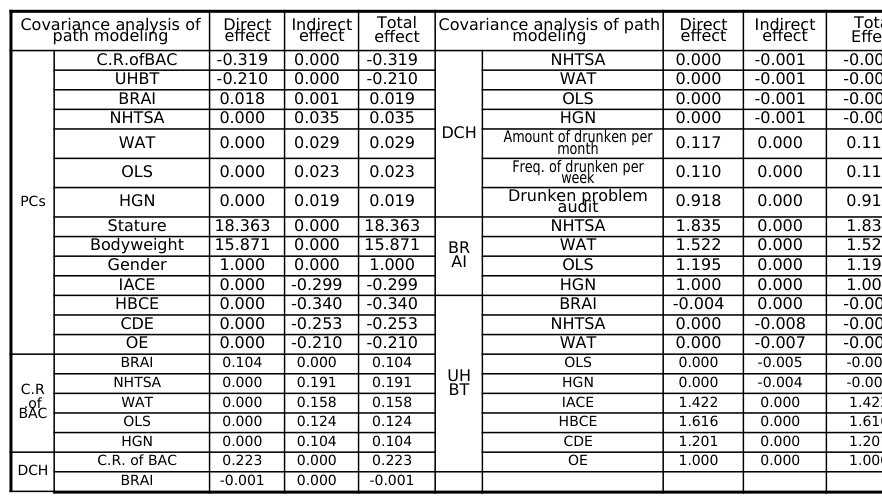
As shown in (Table 6), UHBT and consumption rate of BAC had direct effect only on BRAI. Their effects were 0.104 and -0.004. Also, as for indirect effects on individual variables, HGN was 0.104 and -0.004, one leg-standing test (OLS) was 0.124 and -0.005, WAT was 0.158 and -0.007, and NHTSA alcohol test was 0.191 and -0.008. PCs had a total effect of 0.019 on BRAI. Its direct effect was0.018 and indirect effect was 0.001. Also, as for indirect effect of physical characters on the individual variables of behaviors under influence, HGN was 0.019, OLS is 0.023, WAT was 0.029, and NHTSA alcohol test was 0.035 (See Figure 3).
In this study, a relation structure on the impact of DCH and consumption rate of BAC on UHBT is presented in a form of an equation. The summary of result is shown in (Table 8). In addition, the result showed that in case of hypothesis 1 (Physical characters (PCs) affect consumption rate of BAC), the null hypothesis was rejected since p- level between PCs and consumption rate of BAC was significant at 0.039. Hypothesis 2 (PCs affect UHBT) and hypothesis 3 (DCH affect NHTSA alcohol test results) were not significant. Hypothesis 4(PCs affect BRAI) showed significance (p<0.01) between PCs and BRAI. Hypothesis 5(Consumption rate of BAC affects BRAI) and hypothesis 6 (UHBT affect BRAI) turned out to be in significant.
Consumption
Consumption rate of BAC rate of BAC
1
1
1
1
e18
e18
- 0.004
- 0.004
Gender Gender
1
1
e2
e2
16.027
16.027
1
1
e3
e3
PC
PC
Body weight
Body weight
1
1
e41
e41
IACE
IACE
18.477
18.477
1
1
- 0.245
- 0.245
Stature Stature
1
1
e4
e4
1 1.237
1 1.237
e42
e42
1.667
1.667
HBCE UHBT
HBCE UHBT
1
1
1
1
WHO alco WHO alco
e43
e43
CDE
CDE
e11
e11
0.140
0.140
_hol test _hol test
1.450
1.450
1
1
1
1
1
1
e44
e44
OE
OE
0.025
0.025
1
1
Alcohol Alcohol
0.925
0.925
e12
e12
e50
e50
Audit Audit DCH DCH
0.110
0.110
Freq. of Freq. of
1
1
- 0.014
- 0.014
drunken drunken
e14
e14
1
1
week week
e22
e22
HGN
HGN
0.118
0.118
- 0.001
- 0.001
Amount of Amount of
1
1
1 1
1 1
drunken drunken
1.309
1.309
e23
e23
e16
e16 month month
- 0.014
- 0.014
OLS BRAI
OLS BRAI
1.520
1.520
1
1
e24
e24
WAT
WAT
1.710
1.710
1 1
1 1
e25
e25
NHTSA
NHTSA e52 e52
Figure 3 A structural equation model on the impact of DCH and the consumption rate of BAC on unsafe human
behavior drivers
Table 8: Effects of optimal model Covariance analysis of path modeling Direct effect Indirect effect
CONCLUSIONS AND DISCUSSION The objective of this study was to provide the criteria data for judging on any administrative measure to revoke driver license or to legal punish any person under the under the influence whilst driving. The result of this study estimates per hour average consumption rate of BAC (β)-0.0178 g/kg and SD was 0.00497. Difference by gender and age groups was not significant but difference by injected amount was significant (p<0.01). Interaction showed no significant difference. But, interactions of gender and injected amount, age group and injected amount, and gender, age group, and injected amounts showed significant difference (p<0.01). These results shown drew a similar conclusion to that of Jones (1996).
This research into a consumption rate of the BAC calculated out through the multiple regression analysis thereof. Also based on the measurements, inter-relations of unsafe human behavior that attributes to drunk driving were presented in a structural equation. Also, a structural equation model of the effect that the drinking culture habit and the consumption rate of the BAC had on the unsafe human behavior tendency factor was expressed in a model (See figure 4). It was significant between PC and consumption rate of BAC (p<0.05) and between PC and BRAI (p<0.01). Also, PC and DCH (p<0.01), HGN and WAT (p<0.01), and IACE and WAT (p<0.01) have shown significant results.
Drunk driving is often the secondary cause for bringing about other large-scale traffic accidents, and since it is an accidental offence, various problems relating to compensation and indemnity for damages to any specific individual and group involved. This is completely different from other violations of the regulations. That is to say, drunk driving brings about a very adverse chain rippling effect on all people in society, not limited to any part of the society, and therefore, there is a need to establish specific and practical countermeasures. For traffic safety, prevention for and countermeasures to drunk driving should not be limited to any specific section, and should be prepared in advance so that the essential objective thereafter may be accomplished with the whole balance thereof being maintained. Also, the related legal system should be harmonically complemented and established as a whole. This legal system should be systematically set up through broad participation by traffic policemen, safety engineers, forensic scientist, health experts, and prison officers and so on. Further, an appropriate supportive system for the legal system should be established. For this system, various experts shall collect and analyze related data in consideration of proper national and local conditions and approach multilaterally and effectively towards the prevention of accidents caused by drunk driving.
REFERENCES
Babor T. F., Higgins J. C., Saunders J. B., and Monteiro M. G., (2001) “The alcohol use disorders identification test(AUDIT), Guidelines for use in primary health care 2ed”, Geneva. Brinkmann B., Beike J., Kohler H., Heinecke A., and Bajanowski T., (2002), “Incidence of alcohol dependence among drunken
drivers”, Drug and Alcohol Dependence 66, pp.7-10. Cloninger C. R., Przybeck, T. R., and Svrakic D. M. (1991), “The Tridimensional personality Questionnaire”: U.S. normative data Psychological Report 69, pp.1047-1057. Eysenck H. J., and Eysenck S. B. G. (1991), “The Eysenck Personality Scale”, LondonHodder and Stoughton, 1991. Jones A. W., and Anderson L. (1996), “Variability of the blood/breath alcohol ratio in drinking drivers”, Journal of Forensic
Science 41, pp.916-920. Jones A. W. and Anderson L. (1996), “Influence of age, gender, and blood alcohol concentration on the disappearance rate of alcohol from blood in drinking drivers”, Journal of Forensic Science Vol. 41, pp.922-930. Jones A. W. (1999), “Disappearance rate of ethanol from the blood of human subject: Implication in Forensic Toxicology”,
Journal of Forensic Science Vol.44, No.1, pp.104-118. Jones A. W. (1989), “Enforcement of Drink-Driving laws by use of 'Per Se' Legal alcohol limits: Blood and/or breath concentration as evidence of impairment”, Alcohol, Drugs and Driving Vol. 4, No.2. Masada W. (1989), “Industrial and Organizational Psychology”, SaSaKi. NHTSA, (1981), “Report on a National Study of Preliminary Breath Test(PBT) and Illegal per se Laws - Effectiveness of PBT &
IPS Laws”, U.S. DOT NHTSA. Stuster J. W. and Burns M. (1998), “Validation of the standardized field sobriety test battery test, at BACs below 0.10 percent”, FINAL REPORT NHTSA DTNH 22-95-C-05192. Widmark E. M. P. (1922), “A micro-method for the estimation of alcohol in blood”, Biochem Z Vol.131: pp.437.
LISTED IN THE AHFE DIGITAL BOOKSTORE CATALOGUE
Explore the complete digital volume
Advances in Physical Ergonomics and Human Factors: Part I
Read this individual research paper free through the original publisher, or explore the full digital proceedings book.
ISBN 978-1-4951-2104-3
Explore this ISBN in the AHFE Bookstore ↗Listed in the July 2026 bookstore catalogue; search by ISBN to confirm current availability · Digital book purchase optional