Claudia Camargo, Enrique J. de la Vega, Jesús E. Olguín, Juan A. López (2020). Application of Sensory Thermography on Workers with Carpal Tunnel Syndrome of a Textile Industry in Mexico. In: Advances in Social and Organizational Factors. AHFE Open Access, vol. 9. https://doi.org/10.54941/ahfe100360
This research study deals with the application of sensory thermography on workers of the textile industry who are working in areas where they do Highly Repetitive Movements (HRM). Objectives: To analyze those with variations of temperature generated in the wrist area during a period operation of 2 hours 30, showing the feasibility of the implementation of the sensory thermography in this area evaluated. Methodology: A total of the workers of the workstation called high risk were evaluated, where 3 men and 3 women (they showed Carpal Tunnel Syndrome CTS of their dominant hand), who carried out their normal activity using a defined protocol for this experiment. Results: The maximum temperature was obtained in the experiment of the worker 3 in the right wrist with 35.586°C attained in the time of 1 h 34 min 21; and in the worker 6 was obtained in the left wrist with 34.633°C for a period of 1 h 34 min 56. Conclusions: We conclude that in 86% of the cases analyzed in both wrists, there was similarity in patterns of temperature from a wrist to another regardless of the gender and of their dominant hand. All data adjust to the distributions of the three parameters Weibull and Weibull for the wrists.
Musculoskeletal disorders (MSDs), including those localized to the Upper Extremity Musculoskeletal Disorders (UEMSDs) such as CTS and forearm tendinitis, are common, widespread and disabling. They comprised 29% of the approximately 1.2 million total workplace illnesses and injuries resulting in lost days from work in 2007 in the United States (BLS, 2008). In a general European working population (Andersen et al., 2007), found neck/shoulder pain prevalence of approximately 30–50% and arm pain prevalence of 11–28%. In service sector workers, slightly lower prevalence’s prevailed. 51% of workers in the European Union used a computer at work in 2005, with an annual growth rate ranging from 3% to 4% (Demunter, 2006).
It has long been known that repetitive motions of the different anatomical structures of the hand and upper extremities can cause injury and disability of one or both limbs. The National Institute of Occupational Safety and Health. Estimates that over 20% of the labor force involved in jobs of repetitive nature is at risk of developing Cumulative Trauma Disorder (Mallory and Bradford, 1989). The most common forms of Cumulative Trauma Disorder (CTDs) are: Tendonitis, tenosynovitis, epicondylitis, bursitis, and CTS. The latter is disabling condition of the hand(s) that can be caused, precipitated, or aggravated by repetitive motions combined with forceful and/or awkward postures (Putz, 1988; Tichauer, 1986). CTS are a specific form of neuropathy in which nerve injury results from compression of neighboring anatomical structures. It occurs up to 10 times with more frequency in women than men, and it is often seen concomitant to hysterectomy, diabetes mellitus, ophorectomy, and pregnancy (Armstrong, 1983; Benson and Dermott, 1987; Cannon et al., 1981; Hymovich et al., 1966; Phalen, 1966).
Although CTDs are believed to occur in a relatively large segment of the population, they generally go underreported in industry because workers may not associate the symptoms with their jobs, especially when there occur at night after they have left their jobs. In addition, some workers may not report their symptoms for fear of loosing their jobs, or being placed in another area if they complain (Armstrong and Graffon, 1979).
Thermography is a noninvasive technique without biologic hazard. It detects, measures, and converts invisible, surface body heat into a visible display, which is then photographed or videotaped as a permanent record. It graphically depicts temperature gradients over a given body surface are at a given time and has been used to study biologic thermoregulatory abnormalities directly or indirectly influencing skin temperature (Feldman, 1991). Infrared thermography (IR) is widely used to display temperature patterns on the surfaces of the skin by taking pictures (Zontak et al., 1998), unlike thermography sensory which bases its operation as its name says in sensors. This technology has its historical basis in the development of underwater digital temperature recorders used to measure the temperature under the water in natural environments, and with potential applications in areas such as oceanography, marine ecology, and industry, among others (López, 1992).
The contribution of this paper is to analyze and evaluate the variation in body temperature generated in the wrist area with RW and LW through sensory thermography and potential symptoms, emulating an operation of the textile industry with repetitive motion. Also, prove if the data adjusts to a normal distribution and/or what type of distribution, carrying out tests for normality and distribution adjustments based on the data. This investigation allowed the making of questions as: What is the behavior of the temperatures of workers to perform highly repetitive motion over a period of time of 2 hours and 30 minutes? What are the maximum temperatures (Tmax) achieved and its symptoms? Do the temperatures show a similarity on the patterns? Data fit a third order polynomial? What type of distribution data stick?
A review of the state of the art research or sensory thermography applications so far not has been found, but the IR which serves as reference for this research study.
Changes in body surface heat have interested physicians since the days of Hippocrates (Feldman, 1991). It took another 100 years to develop infrared technology, but in then became a classified World War II priority not to be released until 1960s (Accairri et al., 1978; Berthold, 1986; Brelsford and Uematsu, 1985).
Therefore it look over 4000 years-from heat estimation by touch when “fingers did the scanning,” to sixteenth century thermometry, and then another three centuries before thermometers became a staple of medical practice-to arrive at thermography, today’s thermometry of the skin surface. The body’s thermal homeostasis and central control of surface temperature is maintained by a hypothalamic regulating center operating through feedback mechanisms (AMA Council Report, 1987). Both sides of the body are affected uniformly and simultaneously; thus, thermal symmetry is the hallmark of normality, whereas skin surface asymmetry strongly suggests abnormality (Feldman, 1991).
The skin is one of the body’s chief thermoregulators via its large vascular network and associated complex of nerve fibers which together control blood flow within millimeters of the body surface. Superficial perfusion is largely influenced by the sympathetic nervous system. When stimulated by nerve root or peripheral nerve irritation, the sympathetic nervous system causes active vasoconstriction and decreased skin temperature, whereas it greater compromise or complete interruption causes vasodilatation and increased skin temperature. Up to date, the two most commonly used heat detection systems in clinical practice include infrared telethermography and liquid crystal contact thermography (Feldman, 1991).
A review of the state of the art research or sensory thermography applications so far have not been found, but only for the IR which serve as reference for this research study.
The thermography scan can calculate temperature changes in small parts of the body surface. They illustrated the contribution of the IR in diagnosing and corroborating acute, recurrent and chronic clinical symptoms (Feldman, 1991). A study was published to characterize the effect of exercise (balance for 15 min) and responses in the skin temperatures in people with and without carpal tunnel syndrome (Tchou et al., 1992). It was also published a study characterizing the effect of exercise (on an ergonomics bike) and responses in the skin temperatures due to controlled levels of exercise and temperature conditions (Zontak et al., 1998).
A study was published on the detection of breast cancer by thermography, which has become a powerful tool in conjunction with mammography for diagnostic purposes. Breast cancer is one of the most common diseases among women around the world in these times and is caused by epithelial cells (Dixon et al., 1999). In recent times, its applications have extended to fields such as engineering and in particular to medicine. It is passive in nature and because of that, will not emit any radiation that could harm the patient or put him in some kind of risk. The ideal temperature for making thermal images is between 20 and 25˚C, and as to the percentage of moisture, this must be between 40% and 60% (Ng and Kaw, 2005).
Another study which was aimed to characterize the differences in skin temperatures of between three groups of office workers assessed by dynamic thermography (writing of 9 min). Post-typing differences in skin temperature in response to a 9 min typing challenge were detectable through infrared thermography in three groups of office workers: asymptomatic controls, those with distal UEMSDs without cold hands, and those with distal UEMSDs with cold hands (Gold et al., 2004).
Another study aimed to examine the suitability of using mean dorsal hand skin temperature, before and after a short typing task as an indicator of UEMSD severity. It demonstrated a reliable physicologic method of determining UEMSD severity in office workers through the measurement of dorsal hand temperature using IR under a controlled ambient environment from 18 to 22˚C recommended (Wolf et al., 2009).
A study was published about an analysis of carpal tunnel syndrome developed in the military population of the United States which showed a predominant significance of the group of military women. The unadjusted incidence rate of carpal tunnel diagnoses in our population was 3.98 per 1,000 person-years. The adjusted incidence rate ratio for >= 40 year-old group with the < 20 year-old group as the referent category was 11.63 (95% CI, 10.90, 12.41) (Gold et al., 2009).
A study was published to estimate the temperature conditions that could cause mental stress, this by immersing both hands in a container of water at a temperature of 3˚C (Kim et al., 2006). In addition, a study was published about a professional swimmer, and reflected the skin temperature analysis, in which temperatures were analysed with regard to the swimming styles developed in the experiment (Zaidi et al., 2007).
A study was published to determine the thermographic changes in temperature associated with the elderly and young people. Which consisted of knee flexion with weight of 1 kilogram added to it during 3 minutes? The results contribute to improve the understanding about temperature changes in elderly people (Ferreira et al., 2008). Note that it is mentioned that for a cumulative trauma disorder can be detected, this must have developed well in advance. It's so that a clinical criteria has limited use in developing a model of prevention, in early detection, and the minimization of days lost due to disability (Young et al., 1995).
The contents of this paper are organized as follows: initially presents a general introduction to CTD, IR. Then it shows the materials and methods. Then, results are presented, and finally the conclusion and future research on the topic.
MATERIALS
The material and equipment used in this research study were the following: Digital Sköll thermograph with 4 sensors with a temperature range of 0˚C to 40˚C, precision ±0.3˚C, and a resolution of 0.1˚C (López, 1992); micropore tape; adhesive tape; stop watch; personal computer. For programming the thermographers, the Akela program was used. Lastly, Minitab®16 and Microsoft® Office Excel 2008 statistical packages were utilized.
METHODS
The experiment was applied to 6 workers of a textile industry in Mexico, one of the pre-requisites for the experiment was that the workers did not perform any physical activity during the 20 minutes prior to the start of this experiment (Gold et al., 2004; Gold et al., 2009), this interval was derived based on previous research, in which it was stated that the required time to stabilize the body temperature after undertaking physical activity was approximately 20 minutes (Ng et al., 2001). On the other hand, it was also asked to the workers to avoid the consumption of alcohol or tobacco (Gold et al., 2009; Wolf et al., 2009), due to the fact that smoking induces a reduction in body temperature (Puig, 1993), in contrast, alcohol rises the body temperature (Kim, 2006; A. A. Puig, 1993).
The following step consisted of keeping the company temperature between 20ºC and 25ºC (Ng et al., 2001), controlled by their system of air-condition. After that, the workers sat in the ergonomic chair and the sensors of the thermograph were placed in both wrists (in nerve region). Once the thermographs were in position, both arms were laid down on an entirely horizontal table, in line with the height of the ribs (Ng and Kee, 2008), this position was adopted for the 20 minutes prior to the experiment and after the experiment. Furthermore, a questionnaire was applied to the worker s, aiming to gather some general information related to the age, height, weight, previous injuries and/or traumas.
Then, the workers started a HRM operation for 2 hours and 30 minutes, given the fact that this corresponds to the maximum time a HRM is performed in this textile industry. The HRM operation involved the movements of reaching, taking, and dropping, among others. During the experiment anomalies were identified, discomfort and pain was also registered.
Finally, the after completing the cycle of 2:30 hours and resting for 20 minutes (Gold et al., 2009), the thermographs were detached, the data was downloaded in Microsoft® Office Excel 2008 for post processing, and finally the analysis and validation of data was done with Minitab®16.
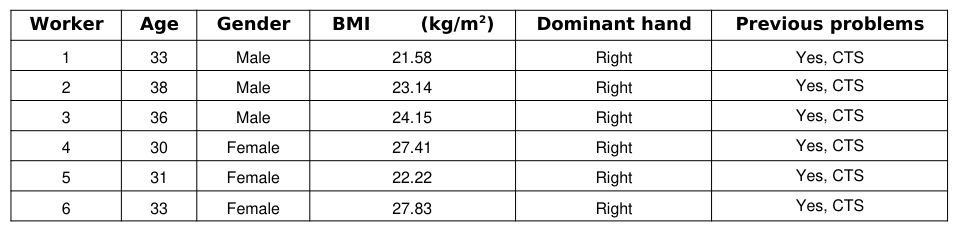
The workers that participated in this research were three men and three women work, they were not in normal physical condition, since they show inflammation in the middle nerve (CTS) of their right hand, who carried out their normal activity using a defined protocol for this experiment; during the development of the experiment the environment temperature in the facility was controlled between 20 and 25°C. The main anthropometric characteristics of the workers are summarized in Table 1. It is important to point out, that none of the workers presented lumbar problems, arterial pressure (high or low) problems; moreover, none reported to have any type of alcohol/tobacco addiction.
Table 1. Anthropometric characteristics of the workers
RESULTS
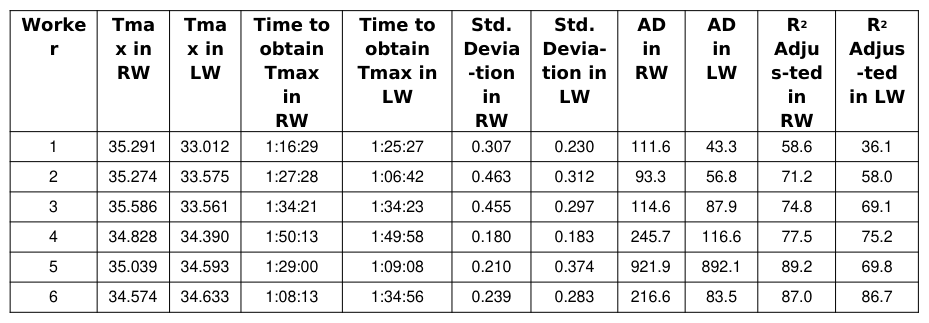
After carrying out the experiment, the results shown in Table 2 were obtained. For the experimental analysis of the results worker 3 was selected, given the fact that this worker presented the maximum temperature of the whole experiment sequence, because this presented the highest temperature (specifically in the right wrist).
Table 2 shows the results of the Anderson Darling analysis, which indicates the type of distribution followed by the data, in this case it was detected that a normal distribution was not trailed by any of the experiments applied. Table 2 also shows the determination coefficient that indicates the percentage of variation of the data.
Table 2. Temperature Patterns
The results of this experiment case can be observed in Figure 1 and Figure 2, for both wrists it was possible to apply a third order polynomial adjustment curve to represent the behaviour of the temperatures during the experiment, bearing in mind that the corresponding coefficient R Square shows this as a results of the experiment. For the right wrist, (Figure 1, temperature versus time) a coefficient R Square of 74.8% was obtained. Successively, it is possible to indicate that the maximum temperature was 35.586ºC, and it occurred after 1 hour 34 minutes 21 seconds. Since the beginning of this experiment until the time that the maximum temperatures are achieved, an increase of 2.862ºC was registered. It is relevant to point out that during the middle part of the experiment; this worker mentioned that he had right wrist discomfort, which prevailed throughout the last part of the experiment in a moderate level of discomfort. Additionally, after 30 minutes of this experiment the worker felt some type of numbness in the fingers.
Fig. 1. Worker 3 right wrist Polynomial Adjustment
For the left wrist (Figure 2, temperature versus time), a coefficient R Square of 69.1% was derived. In comparison with the right wrist, it can be observed that the patterns of temperature are very similar. A comparable behaviour was also detected in the results of the other worker, where it is clear that during the first hour there is a constant rise of temperature. Moreover, the maximum temperature reached during the experiment for the left wrist was of 33.561°C, after 1 hour 34 minutes 23 seconds of testing. Since the beginning of the experiment until the time that the maximum temperatures are achieved, an increase of 1.912ºC was registered. It is relevant to point out that during the final part of the experiment; this worker mentioned that he had left wrist discomfort.
Fig. 2. Worker 3 test day 2 left wrist Polynomial Adjustment
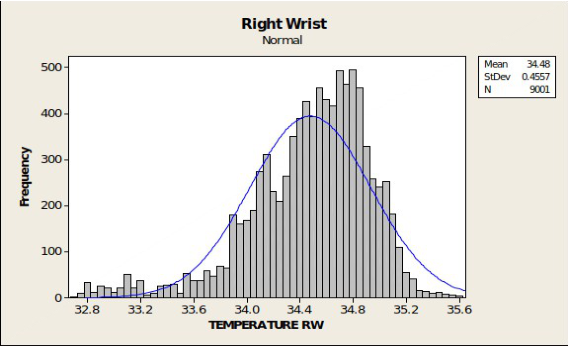
Another part of the analysis that served as evidence to prove that a normal distribution is not followed by the data is shown in Figures 3 and 4, RW and LW respectively; it is possible to visualize that the temperatures with the highest frequencies oscillate between 34.3 and 35.1ºC for the RW (see, Figure 3), and between 32.8 and 33.6ºC for the LW (see, Figure 4).
Figure 3. Worker 3 right wrist Histogram.Figure 4. Worker 3 left wrist Histogram.
Figure available in the original PDF paper.
Figure 5 and Figure 6 show the normality test. For every output dataset from the experiment the next hypothesis was followed: a) Null Hypothesis (H0) = the dataset follows a normal distribution; b) Alternative Hypothesis (H1) = the dataset does not follow a normal distribution.
Figure 5 shows the results of the Anderson Darling (AD) assessment, a value of 114.657 is obtained, meaning that the distribution is not normal; it is also visible that the resulting p-value is clearly lower when compared to the significant level that was previously established at 0.05, therefore we must reject the null hypothesis that indicates that the data follows a normal distribution, and follow the same procedure as before to find a distribution that more accurately fits the spread of the dataset showing temperature on the right wrist.
Figure 5. Worker 3 right wrist Normality test.
Figure available in the original PDF paper.
Figure 6 it can be visualized that for the left wrist the AD analysis produces a value of 87.917, which indicates that a normal distribution is not followed by the dataset, in this case we can confirm that a normal distribution is not followed by checking the p-value, which in fact is also lower than the significant level (set to 0.05, same as for the right wrist), furthermore, the null hypothesis is also rejected for the right wrist. Moreover, it can be concluded that in both AD analysis the statistical values are significantly large.
Figure 6. Worker 3 left wrist Normality test.
Figure available in the original PDF paper.
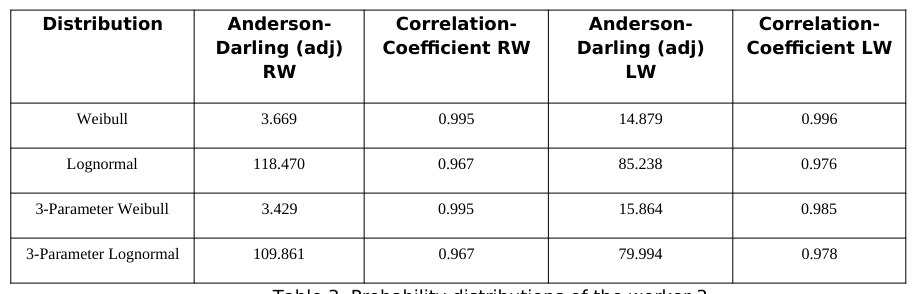
Table 3, it was showed that in both wrists was possible to set some kind of probability distribution, which was the 3- parameters Weibull distribution (3PW), the Weibull (W) and 3-parameter lognormal (3PL). In all tests, it was the 3PW distribution the best fit to the data (see table 4).
Table 3. Probability distributions of the worker 3
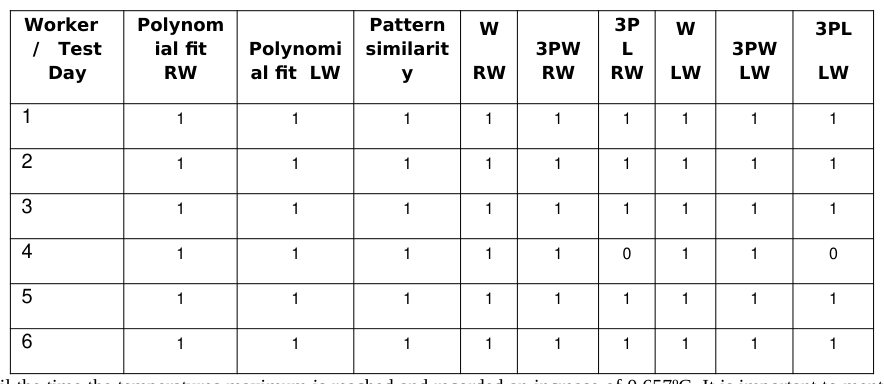
Table 4 shows the summary of the results presented in the experiments in three days. This table is approached from a viewpoint in binary code to represent whether or not the polynomial curve fitting of third order, whether there is similarity in the patterns of temperature, and if one or more probability distributions were present to discuss the RW or LW, as was the case. This is 1 is affirmative and 0 is negative.
Table 4. Probability distributions and settings for all tests
It can be summarized that the most representative distributions of the 6 workers during the experiment, show whether or not a similitude in temperature patterns was found, furthermore, they datasets can determine if the distribution of the data follows one or more probabilistic distribution for the right wrist or left. Based on the results, we were able to conclude that the dataset shows large resemblances in the patterns of temperature for all three distributions (Weibull and 3 parameters Weibull) for both wrists.
CONCLUSIONS
This research allowed to answer the questions in introduction, being the maximum temperatures reached for the worker 3 in RW 35.586°C over a period of 1 hour and 34 minutes, and 21 seconds (in the experiment 3 , explained in detail in results section) since the beginning of the experiment until the time the temperatures maximum is reached and recorded an increase of 2.86ºC; and the worker 6 in the LW 34.633°C for a period of 1 h 34 min 56.°C in a period of 1 hours and 34 minutes, and 56 seconds (in the experiment 6), since the beginning of the experiment Worker Polynom
until the time the temperatures maximum is reached and recorded an increase of 0.657ºC. It is important to mention that in all of the experiments detected discomfort in the right wrist in the time range where the Maximum Temperatures were identified.
It is concluded that temperatures show a similar pattern (see Table 4), that the data fit a polynomial of third order, and that it gets the type of distribution that would fit more the data, such as the parameters 3 Weibull distribution. The sensory thermography offers the early detection of cumulative trauma disorders and with it, it would be possible to prevent further injuries, and perhaps prevent CTD’s from occurring. Disorders like the Carpal tunnel disorder or tendinitis could be avoided by using an early monitoring system like the sensory thermography, which in fact provides a cost benefit acceptable relation It is concluded that the data does not fit a normal distribution for RW and LW, but the distribution fitted Weibull parameters 3 for RW and LW with a correlation coefficient between 0.96 to 0.99, with a significance level of 5%.
Future work is to evaluate a greater number of workers under the same methodological conditions, including the evaluation of elbow and shoulder. C. Camargo, E. J de la Vega, J. Olguín and J. López are currently exploring this research study. In addition to proposing predictive models for the detection and reduction of CTDs in the workplace.
REFERENCES
Accairri L., Cugola L., Maso R. (1978), “The thermographic hand”, Acta thermograph 3, p.p. 65-75. AMA Council Report. (1987), “Thermography in neurological and musculoskeletal conditions”. Thermology 2 p.p. 600-607. Andersen J. H., Haahr J. P., Frost P. (2007), “Risk factors for more severe regional musculoskeletal symptoms: a two-year prospective study of a general working population”. Arthritis Rheum 56, p.p. 1355–1364. Armstrong T. J. (1983), “An Ergonomic Guide to Carpal Tunnel Syndrome”, American Industrial Hygiene Association
publications. Armstrong T. J., Graffon B. B. (1979), “The Carpal Tunnel Syndrome and Selected Personal Attributes”, Journal of Occupational Medicine 21-7, p.p. 481-486. Benson P. G, Dermott W. (1987), “Textbook of Medicine” 1, fourteenth edition. W.B. Saunders Company. Berthold H. T. (1986), “Thermography of insensitive limbs, In Abernathy M, Uematsu S”, Medical Thermography: Theory and
Clinical Aplications. Los Angeles, Brentwood Publishing, p.p. 69-79. Brelsford, K. L. Uematsu S. (1985), “Thermographic presentation of cutaneous sensory and vasomotor activity in the injured peripheral nerve”, J Neurosurg 62 p.p. 711-715. Bureau of Labor Statistics, U.S. (2008), “Department of Labor. Nonfatal occupational injuries and illnesses requiring days away
from work” 2007, p.p. 08-1716. Cannon I. J., Bernacki E. J., Walden, W. D.(1981), “Personal and Occupational Factors Associated with Carpal Tunnel Syndrome”, Journal of Occupational Medicine 23-4, p.p. 255-258. Demunter C. (2006), “How skilled are Europeans at using computers and the Internet?”. In: Statistics in Focus, report KS-NP-
06-17- EN-N, European Communities, Luxembourg. Dixon, J. McDonald, M. C. Elton, R. A. Miller, W. R. (1999), “Risk of breast cancer in women with palpable breast cysts: a prospective study”, Lancet 353, p.p. 1742–1745. Feldman F. (1991), “Thermography of the hand and wrist: Practical applications”, Hand Clinics 7, p.p. 99–112. Ferreira J. J. A., Mendonça L. C. S., Nunez L. A. O., Andrade A. C. C., Rebelatto J. R Salvini,, T. F. (2008), “Exercise
Associated Thermographic Changes in Young and Elderly Subjects”, Annuals of Biomedical Engineering 36, p. p. 1420- 1427. Gold J., Cherniack M., Buchholz B. (2004), “Infrared Thermography for examination of skin temperature in the dorsal hand office workers”, Eur J. Apply Physiol 93 p.p. 245-251. Gold J., Cherniack M., Hanlon M. A., Dennerlein A., Dropkin T. J. (2009), “Skin temperature in dorsal hand of office workers
and severity of upper extremity musculoskeletal disorders’’, Int. Arch. Occup. Envior. Health 82, p.p. 1281-1292. Hymovich L. and Lindholm M., Hand. (1966), “Wrist and Forearm Injuries”. The Result of Repetitive Motions, Journal of Occupational Medicine 8-11, p.p. 211-228. Kim K. S., Shin S. W., Yoon T. H., Kim E. J. J, W. Lee, J. W. Kim, I. Y. (2006), “Infrared thermography in human hand”,
IFMBE Proceedings 14-4, p.p. 2584-2587. Mallory M. and Bradford H. (1989), “An Invisible Work Hazard Gets Harder to Ignore”, Business Week, p.p. 92-93. Ng, E.Y-K and Kaw, G.J.L (2005), “IR scanners as fever monitoring devices: physics, physiology and clinical accuracy”.
Biomedical Engineering Handbook: CRC Press, Florida, p.p. 1–24. Ng E.Y-K and Ke, E.C. (2008), “Advanced integrated technique in breast cancer Thermography”, Journal of Medical Engineering & Technology 32, p.p. 103-114 Ng E.Y-K., Ung L.N., Ng F.C., Sim L.S.J. (2001),“Statistical analysis of healthy and malignant breast thermography”.
International Journal of Medical Engineering & Technology 25, p.p. 253 -263. López O. (1992), ‘‘Digital submarine thermograph”, instrumentation and development 3, p.p. 92-97. Puig A. A. (1993), “Smoking influence in the variations of biochemical, physiological and performance parameters”, Barcelona. Phalen G. (1966), “The Carpal Tunnel Syndrome”, Journal of Bone and Joint Surgery 1-48A, p.p. 211-288. Phalen G. (1970), “Reflection on 21 years’ Experience with the Carpal Tunnel Syndrome”. JAMA 212-8, p.p. 1365-1367. Putz A. V. (1988), “Cumulative Trauma Disorders: A Manual for Musculoskeletal Diseases of the Upper Limbs”. Taylor & Francis. Philadelphia, Tchou S. F., Costich J., Burguess C. R., K. Lexington K., Wexler E. C. (1992), “Thermographic observations in Unilateral
Carpal tunnel syndrome”: Report of 61 cases, The Journal of the hand surgery 17A, p.p. 631-637. Tichauer E.R. (1986), “Some Aspects of Stress on Forearm and Hand in Industry”, Journal of Occupational Medicine. 82, p.p.
63-71. Wolf M.J., Mountcastle S., Owens, D.B. (2009), “Incidence of carpal tunnel syndrome in the U.S. Military Population”, Hand, Ed. Springer New York. Young V. L., Seaton M. K., Feely C.A., Arfken C., Edwards D. F., Baum, C. M. Logan S. (1995), “Detecting cumulative
trauma disorders in workers performing repetitive tasks”, American Journal of Industrial Medicine 27, p.p. 419-431 Zaidi H., TaÏar R., Fohanno S., Polidori G. (2007), “The influence of swimming type on the skin temperature maps of a competitive swimmer from infrared Thermography”, Acta of Bioenginnering and Biomechanics 9-1. Zontak A., Sideman S., Verbitsky O., Beyar, R. (1998), “Dynamic Thermography: Analysis of hand temperature”, Annals of
Biomedical Engineering 26, p.p. 998-993.
LISTED IN THE AHFE DIGITAL BOOKSTORE CATALOGUE
Explore the complete digital volume
Advances in Social and Organizational Factors
Read this individual research paper free through the original publisher, or explore the full digital proceedings book.
ISBN 978-1-4951-2102-9
Explore this ISBN in the AHFE Bookstore ↗Listed in the July 2026 bookstore catalogue; search by ISBN to confirm current availability · Digital book purchase optional