Guy Walker, Ailsa Strathie (2021). Combining Human Factors Methods with Transport Data Recordings. In: Advances in Human Aspects of Transportation: Part II. AHFE Open Access, vol. 16. https://doi.org/10.54941/ahfe100686
Flight Data Monitoring (FDM) is the process by which data from on-board recorders, or so-called ‘black boxes’, is analysed after every journey to detect subtle trends which, if allowed to continue, could lead to an accident. An opportunity has been identified to advance the state of the art in FDM processes by coupling recorder data to established Human Factors methodologies so that issues arising from the strategically important human/machine-system interface can be better understood and diagnosed. The research has also identified a significantly underused source of recorder-data within the railway industry. Taking this data, the paper demonstrates how key areas of driver performance can be quantified using a simple behavioural cluster detection method coupled to sensitivity and response bias metrics. Faced with a class of operational accident that is increasingly human-centred, an underused source of data, and methods that can join it to established human performance concepts, the potential for detecting risks in advance of an accident are significant.
The Spanish train crash in July 2013 reveals yet again that the interface of humans and machine systems is an area of strategic concern (Evans, 2011; CAA, 2011). Having closed off numerous other technical/engineering opportunities for accidents to occur what is left is a troubling class of accident which arises despite highly trained and motivated personnel, the presence of robust safety management practices, and fully functioning equipment. More worryingly, the methods and approaches that have helped us achieve the current high levels of railway safety seem to be less effective in the face of human/system problems such as these. Another feature of the press coverage around the Spanish rail accident was the presence of a black box data recorder. This paper describes a new way to deploy this data, new human-centered metrics for identifying trends and risks, and a predictive approach to accidents based on the concept of Human Factors leading indicators.
Regardless of measure, whether it takes into account exposure by distance or time, the risk to the travelling public and workforce of using and operating the railway is exceedingly low. In Europe the probability of a fatality is approximately 0.57 per billion miles (Evans, 2011), or two fatalities per 100 million person travel hours (EU, 2003). This figure arises despite the fact that exposure in time and distance have increased dramatically in some countries. In the UK, for example, between 1995 and 2012 the risk exposure by passenger distance rose by 25 billion kilometres or 58% (DfT, 2011). At the same time estimated mean fatal train accidents per billion train kilometres has fallen by approximately 9.1% annually (Evans, 2011). Risk exposure is accompanied by an increase in the overall intensity of operations. The UK railway system currently supports 1.3 billion passenger journeys (ORR,
2012) with 16% more trains timetabled in 2013 compared to 1995, most of which are running at higher passenger occupancy levels. This equates to 296.2 million train miles travelled in 2010/11 (ORR, 2012), all of which have at one point or another been recorded on an On Train Data Recorder (OTDR) device.
The act of automatically recording data on system parameters over time is referred to as ‘data logging’ or ‘data recording’. In the aviation industry the generic term data logging falls under the specific heading of Flight Data Recording, which itself comprises several individual procedures and devices. The most prominent of these is what is termed colloquially as the ‘black box’, which represents the combination of a Flight Data Recorder (FDR) and a Cockpit Voice Recorder (CVR). Other systems under the heading of Flight Data Monitoring include various Aircraft Condition Monitoring Systems (ACMS), such as engine health monitoring (e.g. the Rolls Royce EHM programme) and the wide range of parameters available from modern avionics (e.g. ARINC 573) via so-called ‘Quick Access Recorders’ (QARs). While the aviation sector has a long history with on-vehicle data recording devices for the purposes of safety and crash investigation, these are a much more recent innovation in the rail sector.
The Black Box Paradox There are three key paradoxes inherent in this wider picture. Firstly, because so few major rail accidents occur there is no longer enough data to construct reliable forward looking estimates (e.g. Evans, 2011). When safety performance data reaches the level of that achieved in the rail sector it instead starts to become characterised by unpredictable periodicities, cycles or discrete events. This is becoming evident in EU rail safety data, with one large scale rail accident occurring on average every six years (EU, 2003). Put simply, safety data is ‘levelling off’ with a persistent class of human/machine-systems accident now elevated to the status of a key strategic risk (RSSB, 2009).
Secondly, “there is widespread concern within the industry that the background indicators – rather than the headline grabbing ones – have remained worryingly stable” (Wolmar, 2012). An example of this is UK data on Signals Passed At Danger (SPAD) incidents. In the period since the introduction of a countermeasure called the Train Protection and Warning System (TPWS), after which there were initial improvements, there has been comparatively little variation in the overall SPAD rate. For example, the rate for Quarter 4 2012 is the same as Quarter 3, and indeed the same (or very nearly the same) as on seven previous reporting periods since 2005 (e.g. ORR, 2012).
Thirdly, and most paradoxically, is that the opportunities to use black box data for their original purpose (i.e. post- accident analysis) are diminishing at the same time as the technical capabilities of data recorders are increasing. What this means is that enormous quantities of non-accident data is being collected day in and day out, but not currently used.
Data Monitoring This paper is premised on best-practice techniques developed within the aviation domain, specifically a process called Flight Data Monitoring (FDM). This is a “a systematic method of accessing, analysing, and acting upon information obtained from digital flight data records of routine flight operations to improve safety. It is the pro- active and timely use of flight data to identify and address operational risks before they can lead to incidents and accidents.” (CAA, 2003). FDM is mandatory for operators of aeroplanes of a certified take-off mass in excess of 27,000 kg. In effect, it is a way of using data collected from routine operations to detect trends which, if allowed to continue, might eventually lead to an accident. Changes are made to address issues, and the changes themselves are monitored for their possible effects on other parts of the system.
The traditional approach to FDM is focused on exceedence or event detection. Events are defined as: “deviations from flight manual limits, standard operating procedures and good airmanship” (CAP 739, p16). Computer software is used to automatically scan FDR data for instances of these deviations, and a set of core events that cover the main areas of interest are quite standard across operators. Event detection is commonly based on simple statistical techniques and automatic algorithms that detect different phases of flight and events therein. FDM is a highly successful way of making use of black-box data in a pro-active manner, but it too is challenged by the emerging class of human-systems problem that is the focus of this paper. Indeed, while having systems that automatically detect events, it is still incumbent on so-called FDM analysts to manually interpret the lower-order ‘trace plots’ that data recorders produce in order to derive meaning from them. As such, there is considerable value in being able to robustly transform these trace plots into higher order representations, to detect psychologically meaningful patterns therein, and to automatically derive human performance metrics that can help to assess risk.
Human Factors Leading Indicators Leading indicators are measurable precursors to major events such as an accident. The indication of a precursor ‘leads’, or comes before, the actual event itself. Lagging indicators are the opposite. These are so called ‘loss metrics’ that can only become apparent after an event (Rogers, Evans & Wright, 2009). Leading indicators are said to be ‘proactive’ because they enable steps to be taken to avoid seriously adverse consequences. Lagging indicators are said to be ‘reactive’ in that a seriously adverse event needs to occur before it can be learnt from. For this reason, leading indicators are also sometimes referred to as ‘positive performance indicators’ and lagging indicators as ‘negative performance indicators’. The concept of leading and lagging indicators originally derives from the field of economics and the need to understand ‘business cycles’ (i.e. growth, recession, investment, divestiture etc.) and to predict when one phase of a ‘cyclical process’ such as this will change to another (Mitchell & Burns, 1938). The terms have been appropriated more recently by the safety and risk field, particularly in view of developments in Safety Management Systems (SMS) since the 1990’s. Leading indicators, in a Safety Management context, can be defined as “something that provides information that helps the user respond to changing circumstances and take actions to achieve desired outcomes or avoid unwanted outcomes” (Step Change, 2003, p. 3).
The basic ‘research problem’ can be stated thus: despite considerable improvements in safety performance in both rail and aviation sectors, a persistent class of accident/near accident continues to occur. This class of accident/near accident resides at the interface of people and machine-systems. What is required is a means to detect the presence/emergence of such problems before they manifest themselves as a serious operational incident. This paper describes how black box data can be coupled to existing Human Factors methods to provide leading indicators of trends residing at this interface. Specifically, it examines OTDR data on driver responses to an in-cab warning to reveal the types of errors that may be more likely to arise if the discovered trends are not addressed.
METHOD
Data File and Parameters The OTDR data file is a continuous download for a single traction unit. The recording started at 05:34:57 on the 6th July 2012 and ceased at 21:36.32 on the 11th July 2012. This is a period of 136 hours, 1minute and 35 seconds during which the train made 107 journeys and travelled 1638 miles. The raw data takes the form of a Comma Separated (CSV) file containing a data matrix 191,021 time samples (rows) deep by 72 parameters (columns) wide: a total of 13,753,512 data points. The mean sampling rate is 2.56 seconds. The logger itself scans the parameters for changes at a rate of 20mS but, in the present system, to economise on memory requirements data are only logged when one of the 72 parameters changes. The OTDR device itself was a UK Railway Group Standards compliant Arrowvale unit which recorded 72 parameters, 25 of which are in addition to those mandated. In terms of data classification four of the parameters; time, distance and two speed signals derived from a driven and non-driven axle, are continuous ratio data. The remaining 68 are nominal/binomial (i.e. on or off).
Rolling Stock The sample of OTDR data was obtained from a Class 153 ‘super sprinter’, unit number 153 306. This is a single- unit diesel powered railcar built between 1987 and 1988. Class 153s are 23.2 meters in length and have an un-laden weight of 41.2 tons. They seat 72 passengers, comprise a riveted aluminium body shell affixed to a steel under- frame, and are equipped with four electrically powered single-leaf Bode doors. The prime-mover is an under-slung turbocharged 6 cylinder Cummins NT855 diesel engine producing 285bhp. A Cummins-Voith T211r hydraulic transmission drives both axles of the leading BT38 bogie via a Gmeinder final drive. The Unit’s maximum operating speed is 75mph. It is fitted with electro-pneumatic clasp brakes, with cast iron brake pads acting directly on the tread of the wheel(s) via compressed air actuation. Air suspension is provided for additional passenger comfort and refinement.
Journeys and Routes Data collection took place on the Great Eastern (Route 7) and West Anglia (Route 5) regions of the UK’s rail network. The strategic ‘backbone’ of the Great Eastern region is the Great Eastern Main Line (GMEL) originating from London Liverpool Street and travelling North East to Norwich. There are numerous branch lines attached to the GMEL providing services to commuter areas and freight hubs. Data for the present analysis was derived from three journeys between the towns of Ipswich and Felixstowe, a distance of 25 km, over which there are 14 AWS sites.
Automatic Warning System The purpose of the Automatic Warning System (AWS) is described thus (McLeod, Walker & Moray, 2003):
"AWS serves two functions. The first function is to provide an audible alert to direct the driver's attention to an imminent event (such as a signal or a sign). The second function, linked to the first, is to provide an on-going visual reminder to the driver about the last warning. [AWS] is there to help provide advance notice about the nature of the route ahead, and thus communicate to the driver the need to slow down or stop" (p.4).
AWS alerts and reminders are triggered by an electro-magnetic device placed between the tracks approximately 200 yards prior to the signal, sign or other event to which it refers (although this distance can vary according to local circumstances). Sensors underneath the train detect the presence of magnetic fields and activate AWS accordingly. AWS has three system states:
State 1 – No Additional Action Required.
If the event to which an AWS activation is caused requires no action by the driver (such as a signal showing a green aspect) then a bell or simulated chime (at 1200Hz) will sound briefly. The visual display will also remain inactivated. The driver behaviour in this case is to proceed; there is no requirement to cancel AWS using the cancellation button nor is there any specific need to enact driving behaviours in addition to those that are current or planned.
State 2 – Attention is Required Towards Some Imminent Signal, Sign or Event.
If the event that activates the AWS requires (or potentially requires) the driver to slow down or stop then a steady alarm or horn sound (at 800Hz) will sound. The visual display will activate (turning from an all-black display to yellow and black, known as the ‘sunflower’).
State 3 – Acknowledge (and Continue to be Reminded of) the imminent or previous signal, sign or event.
The act of cancelling AWS (by pressing a button) stops the horn sound, and the sunflower continues to be displayed. Failure to cancel AWS within approximately 2 seconds leads to an immediate emergency brake application which cannot be cancelled (Railway Safety, 2001). This level of braking may cause some discomfort to passengers and the event will be logged on the OTMR equipment. Repeated failure to cancel the AWS within the time allowed is likely to lead to an investigation followed by some remedial training and coaching of the driver.
AWS is a legacy system that was originally conceived as a means to prevent Signals Passed At Danger (SPADs). Several major accidents resulted in the use of AWS, and the number of events it now refers to, being extended. AWS now provides warnings in six circumstances, for example, certain types of speed restriction, some level crossings, SPAD indicators and so on.
Unfortunately, the simple two state warning (bell/horn) and reminder (black/yellow) is unable to discriminate between these six different events. There are approximately 29,000 AWS sites around the UK railway network, which equates to a mean of 1.6 AWS indications received in the train cab every 1.6 route miles, or 2.7 activations (either a bell or horn sound) every minute when travelling at 100mph.
Many warning indications require no action from the driver, simply a press of the cancellation button. Many other warnings occur in situations when the correct behaviour at that time is to accelerate the train (it is moving at slow speed or departing from a station, for example). The task of the driver, therefore, is not a simple one of hearing the warning and pressing a button. It requires them to interpret the source of the warning and the context in which it is occurring, and then decide on the correct course of action. The confusion that this could cause for drivers has been cited in several accident inquiry reports (e.g. Cullen, 2001).
RESULTS AND DISCUSSION
Process charting techniques are used to represent complex real-world activity in an easy to read graphical format using standardised symbols and layout. The Process Chart methodology has a long application history, with early examples dating from the 1920’s (e.g. Gilbreth & Gilbreth, 1921). It has been used extensively in military and high hazard domains as a way of understanding the interaction between people and systems, particularly in terms of identifying human error potential. The method has been used in both rail and aviation settings before. In this application, process charts offer a novel way of converting raw ‘trace plots’ derived from data recorders into an alternative representation, one that makes it easier to:
Discern how larger journey phases break down into smaller component activities.
The order and timing that component activities occur.
Who is performing what activity.
The presence of distinct activity clusters.
The 72 parameters extracted from the data recorder were classified into:
Operator decision (e.g. proceed on basis of received information?)
Operator action (e.g. move control)
Information transmitted (e.g. to another part of the system via a communications medium)
Information received (e.g. from system interface or other actor/agent
Automatic action (e.g. an action performed autonomously by the system)
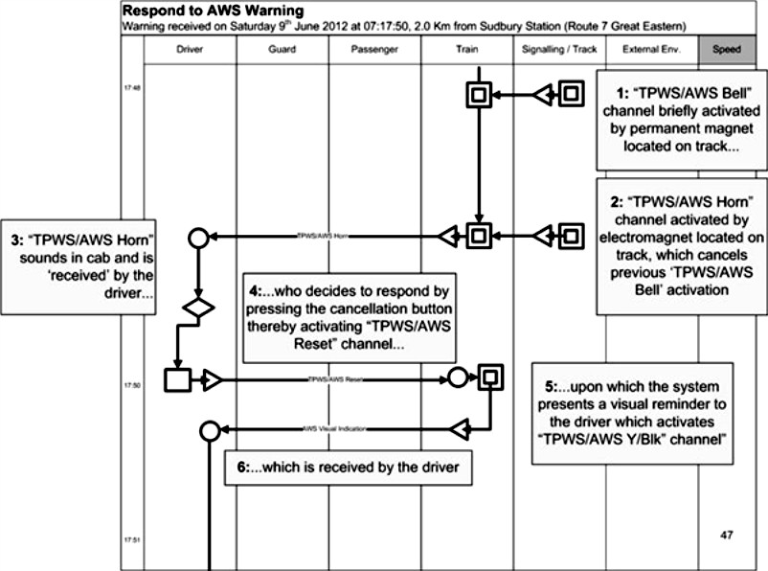
Once classified the process chart itself was constructed. This involved creating a timeline and columns for each ‘agent’ in the system. In the case of the railway example six such agents/columns have been used (Figure 1). As different recorder channels become active, the corresponding process chart symbol is inserted into the relevant column at the correct point on the timeline. The sequence of activities and their dependence on each other defines when these symbols are linked. Thus an activity/symbol that occurs after another activity/symbol becomes linked ‘vertically’. Activities that are performed concurrently are linked ‘horizontally’. Figure 1 shows the ’normative’ structure of operations associated with receiving and cancelling an Automatic Warning System alert.
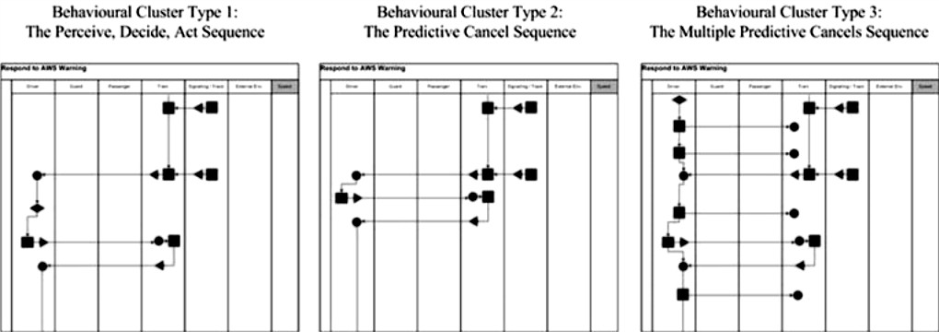
Having the ability to detect behavioural clusters grants the opportunity to assess whether such structures are typical or atypical. Indeed, whether they are one of a number of different behavioural responses within a wider repertoire, and whether one cluster of behaviour is implicated in risk outcomes more than another, and under what circumstances. From the collected data three different ‘clusters’ were detected. The first cluster is the normative ‘perceive-decide-act’ sequence. Here the infrastructure on the track triggers an in-cab warning horn. The driver perceives (hears) this, has enough time to classify it (0.89 seconds) and respond by pressing the cancellation button. The second cluster is the ‘predictive cancel’ sequence. In this case the infrastructure on track triggers the in-cab warning horn but the driver responds so quickly that it is not possible to have perceived, classified and responded to the warning. Instead, the driver has seen the track infrastructure and has anticipated the in-cab warning and timed their response to coincide with it starting. The third cluster is the ‘multiple predictive cancel’ sequence. As in cluster two, the driver can see the track infrastructure ahead and is pressing the cancellation button numerous times before hearing the in-cab warning horn, and several times after the warning has sounded and been cancelled.
Figure 1. Annotated process chart showing the type and sequence of operations required to correctly respond to an AWS warning
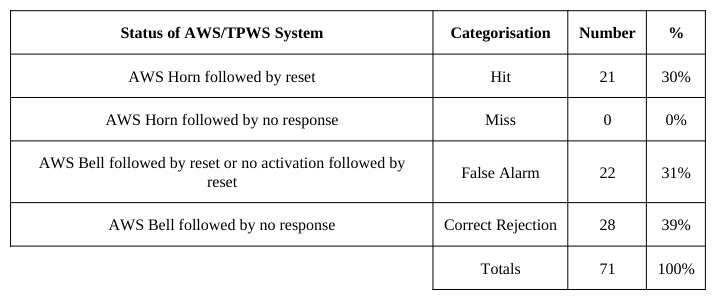
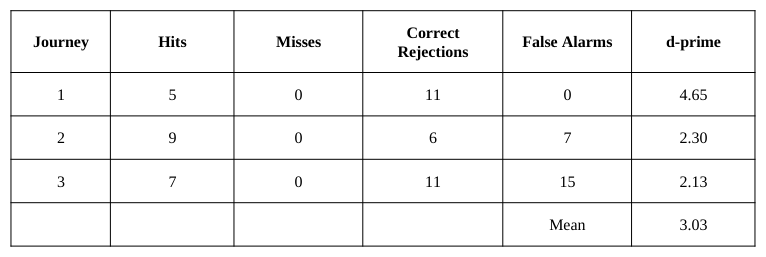
Response Bias Based on the analysis above it is clear, firstly, that cancelling an AWS warning is not merely a perceptual one of hearing and seeing the different system alerts and indications, it is also cognitive: drivers’ not only have to discriminate a ‘stimulus’ from within a ‘noisy’ environment, but correctly classify it and respond. Secondly, there are different strategies that drivers employ to perform this apparently simple task. Signal detection Theory (SDT) helps to untangle these different aspects by separating out a person’s sensitivity to stimuli (how easy it is to detect something) and their response bias (their preference for responding one way or another to the stimuli). SDT helps us to understand why a particular ‘stimulus’, which might be very loud, visible or unambiguous, is not always responded to in the ways we expect (or vice versa). Signal Detection Theory classifies human responses to stimuli in the environment in four ways. The responses that drivers made within each of these categories are shown in Table 1.
Figure 2. Three clusters of behaviour associated with cancelling an Automatic Warning System (AWS) alert were detectedTable 1. Driver responses to the Automatic Warning System (AWS) can be characterised according to the Signal Detection Theory (SDT) paradigm as follows
The ability to accurately detect stimuli in the environment and correctly classify them is the desired outcome. Under the Signal Detection Theory (SDT) paradigm this requires a high number of hits and a low number of false alarms. For example, if the reset button was pressed in response to ANY warning indication this will ensure a 100% Hit rate but will also increase the rate of False Alarms. Accuracy in this case is low. If, on the other hand, the driver is trying to do the opposite, to avoid False Alarms and instead maximise Correct Rejections, they would not respond to ambiguous ‘signals’. This would increase the number of Correct Rejections but it would also increase the number of ‘Misses’. Accuracy in this case is also low. Signal Detection Theory enables us to separate sensitivity (d’) from decision bias (C). Sensitivity is a measure of accuracy and tells us how easy it is to distinguish a particular environmental stimuli (e.g. an in cab warning). Decision bias tells us whether one response is more probable than another.
Human responses to certain stimuli vary because of incentives embodied in the environment. In train driving, for example, there is a strong incentive in normal operations to prevent unnecessary applications of the emergency brake because an AWS warning was missed. This is because an unwanted brake application cannot be cancelled and is highly inconvenient. On the other hand, the consequences of False Alarms are low because nothing happens when the cancellation button is pressed in error. Because of this it would be expected that train drivers might adopt a ‘liberal’ decision bias and be willing to accept False Alarms (redundant presses of the cancellation button) in order to achieve the maximum number of ‘Hits’ . Added to this is the discriminability of the ‘stimulus’ people are responding to, a stimulus that occurs in a ‘noisy’ real-world environment. By noise we refer to other stimuli, competing demands and distractions in the environment as well as the background noise inherent in human perceptual and cognitive processes. Decision bias and sensitivity interact with these ‘noisy’ transport environments to make some future responses more likely than others, in ways that are not always immediately apparent. For example, highly visible warnings that are apparently 'missed’, or control actions that are at odds with the situation.
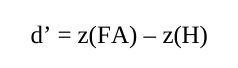
Sensitivity Sensitivity to a stimulus is given by the metric d-prime, which was calculated as follows:
Equation reproduced from the original PDF.
where z(H) is the number of Hits expressed as a z-value subtracted from the same Z-transformed False Alarm rate. The results obtained are shown in Table 2:
Table 2. Driver’s sensitivity to the Automatic Warning System (AWS) alerts Journey Hits Misses Correct Rejections False Alarms d-prime
The d-prime figure measures the strength of the stimulus, which in this case is an AWS warning. A value of 3.03 indicates that drivers are highly sensitive to it: in this situation it is unambiguous and easy to discriminate from the wider background of noise, distractions, other contextual factors etc. Expressed more formally, the responses drivers’ are providing when an AWS warning is overlain on top of the ‘contextual noise’ is 3.03 standard deviations ‘different’ from the responses they give when the signal is absent (and only the ‘contextual noise’ is present). Sensitivity provides an important leading indicator concerning the discriminability of information needed for driver’s to develop accurate situational awareness. The same ‘stimuli’ may yield different levels of sensitivity depending on external/contextual factors. A warning that was not expected, ambiguous, not fully understood or masked may lower sensitivity.
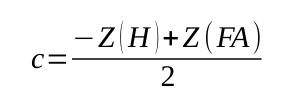
Decision Criterion Decision bias/criterion is given by the metric c, which was calculated as follows:
Equation reproduced from the original PDF.
2
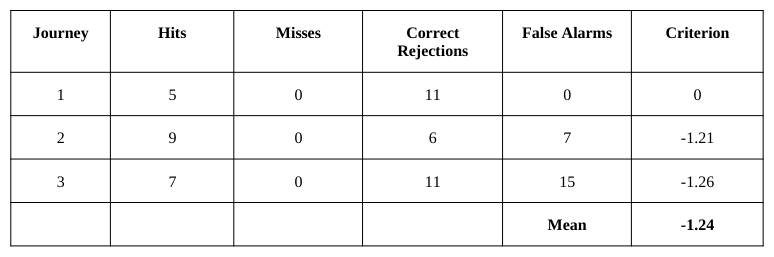
The results obtained are shown in Table 3. Decision Bias is independent of sensitivity and relates not to the discriminability of the ‘signal’ but to the payoffs involved in making one response in favour of another. Thus, regardless of how easy it is to discriminate a stimulus a counter intuitive response may still be favoured. This is because the consequences of False Alarms, Misses and Correct Rejections vary with the context. Psychological research shows that decision bias is more unstable and situationally dependent than sensitivity and, therefore, a potentially valuable Leading Indicator.
Table 3. Results of decision bias (c)
The mean decision bias value across the three sampled drivers was c = -1.24 which indicates a liberal bias. Driver’s make more responses that indicate the AWS signal is present than it is absent. In other words, they are prioritising False Alarms over Correct Rejections which, in turn, provides a clue as to the sorts of error that may be more likely to occur in future (i.e. warnings that are cancelled incorrectly). Assuming that drivers’ ‘internal responses’ to the AWS warning are normally distributed (as per Signal Detection Theory) it is possible to plot individual driver decision bias’ into the chart below which provides an important diagnostic tool in defining risky psychological/decision making states.
According to Figure 3, Driver 1 shows no systematic bias in their responses to the AWS warning. They respond correctly to the AWS warning on every occasion and his/her False Alarm rate is zero. Drivers 2 and 3 are different. They are exhibiting a strong ‘liberal response bias’ meaning that they are much more inclined to exhibit ‘false alarm’ responses (and behavioural clusters 2 and 3). With the ability to detect these changes in decision bias comes the possibility to analyse a) the extent to which different biases interact with accident/incident rates (i.e. is a liberal bias of this magnitude associated with particular types of risk) and b) how the context influences human decision making (and therefore how that context can be modified to ‘un-bias’ human responses).
Figure 3 – Cumulative probability plot showing the extent and direction of response biases exhibited by
the drivers.
CONCLUSIONS
This paper has described how the outputs from transport data recorders can be coupled to existing Human Factors methods to provide advanced indication of strategically important Human Factors risks. The ‘black box paradox’ is that the opportunities to use these devices for their original post-accident purpose are diminishing at the same time as their technical capability and data richness are increasing. In addition, the types of risks are changing, with progress in technical areas of reliability and performance exposing issues around human-machine system interaction. To continue to ensure safety in the face of increased risk exposure and operational intensity, better use of this data needs to be made. This paper demonstrates how black box data from the rail sector can be turned into useful ‘information’ in the form of Human Factors leading indicators of risks associated with the use of an in-cab warning device. Sensitivity provides a measure of how much useful information there is in the environment and the extent to which drivers can discriminate it from the background of contextual noise. Warnings, stimuli and so forth may, in an engineering sense, appear to be unambiguous, yet they may be considerably less so cognitively. Sensitivity provides a measure of this which can, in turn, be associated with changing risk. Decision bias reveals the likelihood that one type of driver response will be favoured and how this interacts with risk. In a wider application it would be possible to examine decision bias in a systematic way looking at differences between drivers and between particular routes. This could provide insight into driving styles and indicate whether particular aspects of a route result in a shift in decision bias. For example, a specific AWS signal on a particular route may result in a high level of predictive pressing (high false alarms) relative to most others, identifying this as a more risky section of journey. Relationships such as these would need to be established based on large-scale future research but even on a smaller sample of data the method was able to detect potentially important differences between drivers, with some adopting a much more liberal response bias than others. The principle, however, is a much more important one. Human Factors methods like these can accept recorder data as an input, are amenable to the kind of software implementation that would be required in a full-scale application, and point the way towards Leading Indicators of strategically important Human Factors risks.
ACKNOWLEDGEMENTS
This work was funded by the UK Economic and Physical Sciences Research Council (EPSRC) under Grant Reference: EPSRC EP/I036222/1. The involvement and support of the UK Civil Aviation Authority, the Rail Safety and Standards Board (RSSB), the Association of Train Operating Companies (ATOC), Greater Anglia Trains and Aerobytes Ltd. is also gratefully acknowledged.
REFERENCES
CAA (2003) CAP 739: Flight Data Monitoring. A Guide to Good Practice. UK: Civil Aviation Authority. CAA (2011) Safety Plan 2011 – 2013. UK: Civil Aviation Authority. Campbell, N. (2007). The Evolution of Flight Data Analysis. In: ASASI 2007: Proceedings of Australian Society of Air Safety Investigators conference, Civic Square, Australia. Available online at: http://asasi.org/papers/2007/The_Evolution_of_Flight_Data_Analysis_Neil_Campbell.pdf Clegg, C.W. (2000). Sociotechnical principles for system design. Applied Ergonomics, 31, 463–477. Cullen, W.D. (2001). The Ladbroke Grove Rail Inquiry: Parts 1 and 2 Report. London, UK: HSE Books. Department for Transport (DfT) (2011). Department for transport statistics. Retrieved 12 July 2012 from:
http://www.dft.gov.uk/statistics. European Transport Safety Council. (2003). Transport safety performance in the EU: A statistical overview. Brussels: European Transport Safety Council. Retrieved July 17, 2012, from: http://www.etsc.be/documents/statoverv.pdf. Evans, A.W. (2011). Fatal train accidents on Europe’s railways: 1980-2009. Accident analysis and prevention, 43(1), 391-401. Ford, M. (2012, February). FDM Technology and Data Recovery. Presented at FDM Short Course, Cranfield University, UK. Gilbreth, F. B. & Gilbreth, L. M. (1921). Industrial efficiency. New York: American Society of Mechanical Engineers. McLeod, R. W., Walker, G. H., & Moray, N. (2005). Analysing and modelling train driver performance. Applied Ergonomics,
36, 671-680. Mitchell, W.C., & Burns, A.F. (1938). Statistical indicators of cyclical revivals, NBER Bulletin 69, New York; reprinted as Chapter 6 of G.H. Moore (ed.) Business Cycle Indicators, Princeton, NJ, Princeton University Press, 1961. Morcom, A.R. (1970). Flight Data Recording Systems: A brief survey of the past developments, current status and future trends
in flight recording for accident investigation and operational purposes. Aircraft Engineering and Aerospace Technology, 42 (7)12 – 16. Office of Rail Regulation (ORR) (2012), National rail trends yearbook, 2010 -2011. London: ORR. Qureshi, Z.H. (2007). A review of accident modelling approaches for complex socio-technical systems. In Proceedings of the twelfth Australian workshop on Safety critical systems and software and safety-related programmable systems, 86, 47-60. Adelaide, Australia: Australian Computer Society. Rail Safety & Standards Board (RSSB) (2009). The railway strategic safety plan 2009 – 2014. London: Rail Safety and
Standards Board. Railway Safety (2001). Automatic warning system (AWS) GE/RT8035. London: Railway Safety Rasmussen, J. (1997). Risk management in a dynamic society: A modelling problem. Safety Science, 27, 183-213. Rogers, A., Evans, R., and Wright, M. (2009). Leading indicators for assessing reduction in risk of long latency diseases.
Greenstreet Berman Limited for Health and Safety Executive. Step Change (2003). Leading performance indicators: guidance for effective use. Aberdeen: Step Change in Safety. Uff, 2000 Warren, D.R., (1954). A device for assisting investigation into aircraft accidents. ARL-MECH-ENG-TECH-MEMO-142. Wolmar (2012, May) Rail Magazine, 697: safety is the hidden success story http://www.christianwolmar.co.uk/2012/05/rail-697safety-is-the-hidden-success-story Woods, D.D. & Cook, R.I. (2002). Nine steps to move forward from error. Cognition, Technology, and Work, 4(2), 137- 44.
LISTED IN THE AHFE DIGITAL BOOKSTORE CATALOGUE
Explore the complete digital volume
Advances in Human Aspects of Transportation: Part II
Read this individual research paper free through the original publisher, or explore the full digital proceedings book.
ISBN 978-1-4951-2098-5
Explore this ISBN in the AHFE Bookstore ↗Listed in the July 2026 bookstore catalogue; search by ISBN to confirm current availability · Digital book purchase optional