Dan Basacik (RSSB), Stephanie Cynk (TRL), Toni Flint, John McMorrow (RSSB) (2021). Evaluating an Advance Warning Sign for Level Crossings. In: Advances in Human Aspects of Transportation: Part I. AHFE Open Access, vol. 15. https://doi.org/10.54941/ahfe100650
Over 90% of the risk at level crossings is a result of the way members of the public can behave when using them. As part of a broader piece of work reviewing signs and signals currently used at public road level crossings in Great Britain, road users’ comprehension of the two level crossing advance warning signs was evaluated by questionnaire survey. Although most road users surveyed understood that both of the signs were about level crossings, the difference in meaning between the two signs was not widely understood. Based on these results and the findings of the wider study, prototype designs were produced for a single sign to replace the two existing signs. These were evaluated by questionnaire survey. The confusion that exists between the two existing signs was eliminated by displaying a single sign. Furthermore, road users found two of the prototype designs to be easier to understand than the current signs. The fact that new designs previously unknown to road users were found to be more easily understood suggests that these new designs are more intuitively recognisable. Work is on-going to carry out further user testing of the new designs.
In Great Britain, there are over 6,500 level crossings, and about one fifth of these are on public roads. Over 90% of the risk at level crossings is a result of the way members of the public can behave when using them, including making unintended errors, as well as embarking on wilful acts of violation (RSSB, 2010). This highlights the need to address the issue of road user behaviour at level crossings.
Traffic signs are important tools which give road users instructions, information or warnings about hazards, including level crossings. In 1968, the United Nations Economic and Social Council agreed the Vienna Convention on Road Signs and Signals (UNECE, 1995) which specifies the design of some traffic signs. The convention aimed to standardise the appearance of traffic signs, and in doing so, to help drivers travelling internationally to recognise the signs they encountered. Most European countries are now party to the convention (UN, 2012). The United Kingdom has signed the convention but not ratified it; nevertheless, traffic signs in the UK broadly conform to European norms.
The Vienna Convention sets out two warning signs for road users at level crossings:
1. A danger warning sign for ‘level crossings with gates’
2. A danger warning sign for ‘other level crossings’ In the United Kingdom, these two measures have been implemented as shown in Figure 1 (DfT, 2002). The design of the two danger warning signs is very similar to those used elsewhere in Europe.
Figure 1. Sign for level crossings with gates or barriers (left) and level crossings without gates or barriers (right).
Figure available in the original PDF paper.
Throughout the remainder of this paper, for simplicity, the ‘level crossing with gates or barriers’ sign will be referred to as the ‘gates’ sign, and the ‘level crossing without gates or barriers’ sign will be called the ‘train’ sign.
As part of the rail industry research programme, RSSB commissioned TRL to carry out a review of traffic signs and signals at public road level crossings, with a view to establishing whether the current signs are suitable and sufficient, and recommending improvements where necessary. The study was not constrained by signs that currently exist. Rather, the approach was to start by considering road user information needs at level crossings, and to work towards determining what measures are needed to address those needs. This paper focuses on an assessment of road users’ comprehension of the advance warning signs, which was one part of the broader study.
There have been previous studies which have evaluated traffic signs. Cooper (1989) carried out interviews with over 1000 road users in order to evaluate comprehension of a wide range of road signs. 83% of Cooper’s participants gave a fully or partly correct answer when asked what the train sign meant, and 73% were fully or partly correct about the gate sign. For each sign, approximately 10% of participants gave an incorrect answer when asked its meaning, 5% said they didn’t know the meaning of the train sign, and over 10% said they didn’t know the meaning of the gate sign. Thus, according to these research results from a quarter of a century ago, the train sign was better understood than the gate sign. When the 46 signs Cooper assessed were ranked based on the percentage of participants who gave fully or partially correct responses, the train sign came 15th and the gates sign came 17th. While the level crossing signs weren’t the worst-performers in terms of comprehension when compared with the other signs, the results did indicate some room for improvement.
The study carried out by Cooper did not report on whether people understood the differences between the two signs. Wigglesworth (2000) summarised a range of studies carried out in Australia from the 1970s onwards, and presented a rationale for having two different signs. In one of these studies the head movements of 92 drivers were covertly observed as they approached two level crossings along the same road. One of these crossings had light signals (an active crossing) and the other did not (a passive crossing). When approaching the active crossing, drivers should have looked towards the signal, whereas at the passive crossing they should have looked from side to side to check for approaching trains.
Of the 92 drivers who were observed, none made the appropriate response at both crossings. 52 drivers did not change their visual search strategy according to the type of level crossing, and of particular concern was the group of 34 drivers who did not look in either direction at either of the crossings. This group of drivers went over a passive level crossing without checking for approaching trains. Wigglesworth (2000) found similar results in later studies and concluded that “if there is a need for a different response at some points of the system, then a different stimulus should be provided at those points.” Thus, he argued for two different warning signs: one for active crossings where the crossing itself is designed to tell road users when it is safe/unsafe to cross, and another for passive crossings, where the road user must check for approaching trains and decide whether it is safe to cross. Since Wigglesworth’s earlier studies there has been a change in Australia, from having one level crossing advance warning sign, to having two different signs. Nevertheless, Wigglesworth (2000) does not present data on road users’ comprehension of these new signs.
As part of the rail industry research programme, RSSB has commissioned TRL to carry out a review of traffic signs and signals at public road level crossings. This paper describes work that was done to evaluate comprehension of the two advance warning signs currently used at level crossings, and to evaluate potential new designs.
METHOD
Comprehension of current signs Two separate questionnaire surveys were conducted to gauge road users’ understanding of the current advance warning signs used at level crossings.
The first survey presented a range of signs and signal aspects and asked open ended questions about what the participants thought they meant and what actions they must carry out in response to them. It was circulated by post and email to a sample of 1000 volunteers in TRL’s database of road users in Surrey, Berkshire and Hampshire. A semantic analysis was carried out to categorise responses according to their meaning, independently of the language structures used. For example, where people said ‘road crosses the railway’, this was taken to mean the same as those who responded ‘level crossing.’
In order to probe understanding of the differences between the two level crossing advance warning signs, two questions about level crossing signs were developed and included in AA’s (Automobile Association) online Populus Survey (the second survey), which covers a wide range of topics. Road users were presented with the train and gate advance warning signs and were asked, ‘Which of the following would you expect to see after this traffic sign?’ Participants were given a range of correct and incorrect options and were told that they could select more than one option. The response options for this survey were developed based on participants’ responses to the first questionnaire.
These surveys were part of a broader piece of work which evaluated level crossing signs based on road user information requirements and design good practice, comprehension surveys and virtual reality trials. Based on this broader piece of work, a rationale for signing was established, which concluded that a single advance warning sign would be more beneficial than the two existing signs. A range of potential designs were produced for this new sign.
Comprehension of design prototypes A structured, face-to-face interview survey of road users was administered by researchers to determine the extent to which the refined designs for advance warning signs were understood. Conducting the surveys in this way allowed researchers to evaluate the finer points of what people understand in relation to different design alternatives and probe the reasons for this.
The survey included 185 volunteers. Most of these were from TRL’s database which is described above, but additional participants were recruited from a range of organisations such as language schools and trucking companies, in order to target particular groups that were not well represented in TRL’s database. The sample included a variety of different road users such as car drivers (including some foreign drivers), HGV and PSV drivers, motorcyclists, cyclists, horse riders and pedestrians. Participants of the previous survey were not eligible to take part.
The survey probed what participants thought the signs meant and how they should respond to them. The scope also included risk ratings and compliance ratings. After these data were collected, the meaning of the sign was revealed and participants were asked to rank the signs in order based on their clarity and understandability. For comparison purposes, participants were questioned about the current signs as well as the new designs, all of which were presented in a randomised order.
In all of this work the signs and signals were presented to participants out of the context of the level crossing environment (ie on a white background) so that the research could evaluate comprehension of and self-reported responses to the design of the signs, without the findings being confounded by the design of the road environment which can vary from one crossing to another.
RESULTS AND DISCUSSION
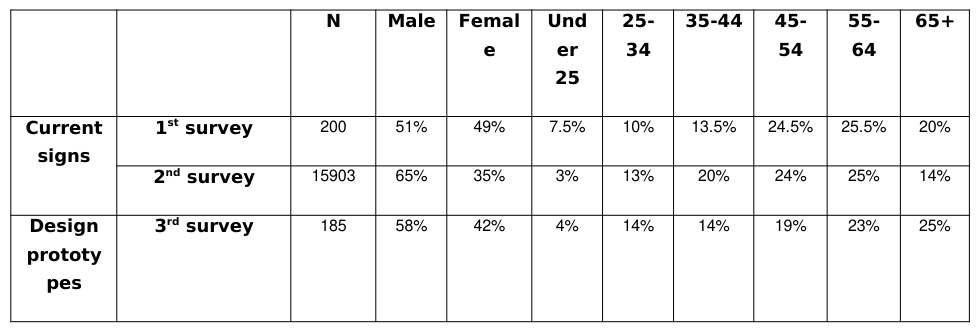
Participants Summary data on participants’ gender and age is given in Table 1, for each of the three surveys.
Table 1. Participants’ demographic data N Male Femal Und 25- 35-44 45-
The second (larger scale) survey had proportionally more males but fewer participants in the youngest and oldest age categories. The first and third surveys were circulated to participants within easy access of Wokingham, Berkshire (where there are a number of level crossings in the vicinity). The second survey was circulated nationally, and may have included proportionally more responses from people who do not regularly encounter level crossings.
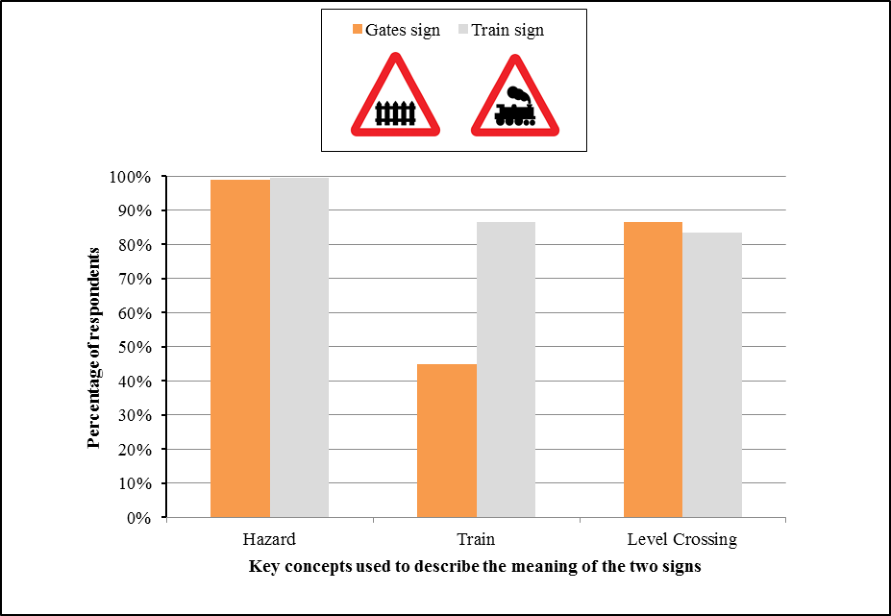
Evaluation of current signs by questionnaire Participants were shown images of the two level crossing advance warning signs and were asked what the signs mean. Figure 2 shows the percentage of participants who thought the sign meant hazard, train or level crossing.
Figure 2. High level comprehension of advance warning signs Almost all of the participants identified that the signs warn of a hazard ahead, and over 80% of participants reported that they thought that the signs are for level crossings. There were no statistically significant differences between the two signs in these respects, and on the whole, the fact that most participants reported the signs as being for level crossings is promising. Nevertheless, for each sign, more than one in ten participants failed to identify it as relating to a level crossing. Qualitative evaluation of participants’ full responses suggests that there are issues in communicating that the hazard ahead is a level crossing. Some examples of these responses include:
“There’s a farm nearby”
“Hedge or fence”
“Train station” Even within the group of participants who correctly identified that the signs refer to level crossings, there were some misconceptions. Some examples of these include:
“Railway level crossing – manual gates” (with subsequent description of how the road user would open the gates)
“Vintage locomotive crossing”
“Steam trains crossing the road slowly ahead” This survey asked open ended questions regarding the signs so that participants would not be led in their response. Many of participants did not comment on whether the sign was for a level crossing with or without gates. Thus, the first survey was not able to evaluate whether participants understood the difference between the two signs.
Second (larger) survey on current advance warning signs A second survey was conducted to investigate what expectations each of the two advance warning signs evoke in respondents, and to explore whether participants understood the difference between the two signs. Participants were asked what features they would expect to see after the sign, and given a range of response options. They were told to select as many as applied to the sign. For example, when presented with the gates sign, they were expected to select both ‘level crossing’ and ‘gate or barrier’.
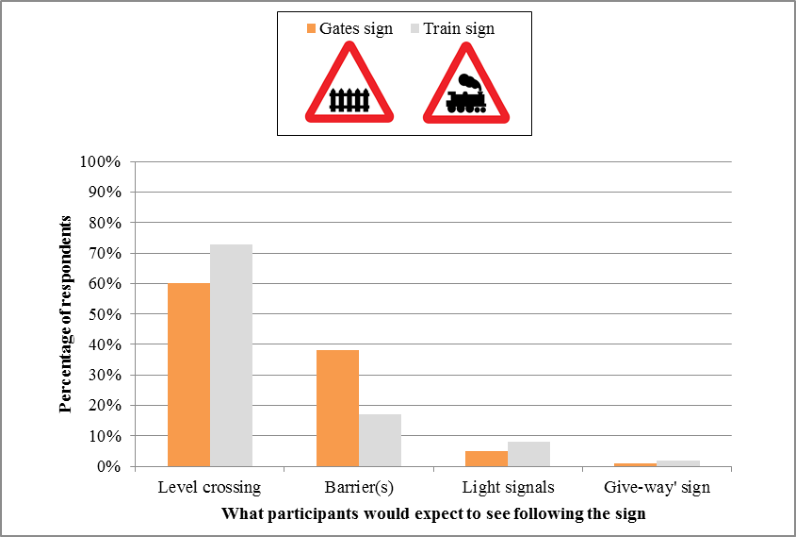
Figure 3. Results of AA Populus Survey
The results presented in Figure 3 show that 73% of participants would expect to see a level crossing after the train sign. Only 60% of participants said they would expect to see a level crossing after the gate sign. This is a statistically significant difference between the two signs (z=35.067, p<.001). It is particularly interesting because level crossings with gates or barriers are more common than those without, and road users are more likely to come across the sign that they are less likely to associate with level crossings.
Another interesting aspect of these results is that 17% of respondents incorrectly said that they would expect to see barriers after the train sign, whereas only 38% said that they would expect to see barriers after the gates sign. While this is a statistically significant difference (z=61.021, p<.001) between the signs, and the results are in the right direction (ie the correct sign is invoking the presence of barriers), the difference between the two is small. This provides evidence that the distinction between the two signs is not well-understood.
Discussion of survey results about current signs Two questionnaire surveys were conducted to evaluate road users’ comprehension of road traffic signs that are currently used on the approaches to level crossings. This work was carried out as part of a broader evaluation of signs and signals at public road level crossings.
Over 16,000 respondents took part in the two surveys evaluating the current signs. The results of these surveys were broadly encouraging in that the majority of participants understood the signs to be about a train or level crossing. However, detailed investigation of the results revealed that more than one in ten participants did not understand the signs to be about trains or level crossings. Responses such as ‘steam train’, ‘farm’ and ‘hedge or fence’ suggest that the pictograms may be ambiguous.
In the second survey, a lower proportion of participants said that they would expect to see a level crossing after either of the signs. There are two possible explanations for this. One possible explanation is that participants were asked a different question in the second survey when compared with the first. A second and potentially more plausible explanation is the difference in sampling:
Participants in the first survey were drawn from the vicinity of Wokingham in Berkshire, where there are a number of level crossings, and the sample for the second survey was drawn from a national panel. Participants of the first survey may, therefore, have been more likely to have encountered level crossings.
In both surveys not all participants targeted by the mail out returned responses; so there is a possibility that interest in the subject of the survey played a role. The first survey was very clearly only about traffic signs, and the second included a much broader range of topics. Therefore, each of the two surveys may have attracted participants with a different level of knowledge about traffic signs.
When compared with Cooper’s (1989) results, the first survey carried out during the current study found higher comprehension levels, and the second survey found lower comprehension levels. Although there are some differences between the results of the various surveys, their overall conclusions are the same. Most participants understood that the signs were for level crossings, though there were some respondents who clearly didn’t understand what the signs meant. Furthermore, the train sign was more successful than the gates sign in conveying the message that there is a level crossing ahead.
A key feature of the current signing schemes at level crossings is that a different sign is used depending on whether the crossing has gates and barriers. Thus, this research also needed to determine whether road users understood the differences between the two signs. The first questionnaire was unable to evaluate this issue thoroughly as, by necessity, open ended questions were used and many participants did not comment on whether they would expect barriers to be present. The second survey showed that that fewer than two in five people said they would expect to see a gate or barrier after the gates sign, and more than one in five people stated that they would expect to see one after the train sign. These results strongly suggest that the current model of having two signs to convey two different meanings is not working as intended.
Given that road users do not seem to understand that the two signs are for two different types of level crossing, it is important to ask whether it is beneficial to have two warning signs. Wigglesworth argued, based on his studies of road user behavior, that if road users must alter their behavior depending on the type of protection at the level crossing, this warrants different signs. He makes a distinction between active crossings (where the lights or barriers tell road users whether to cross or stop) and passive crossings (where people have to look left and right to determine whether they can cross).
Wigglesworth’s argument for having different signs for active and passive level crossings is compelling, but it is important to understand the two signs defined by the Vienna Convention do not satisfy Wigglesworth’s criterion. The train sign can be used both at crossings where the road user is provided with light signals, and at crossings where they have to check for approaching trains by looking left and right. Thus, there is a mismatch between the stimulus (sign) and the response expected from the road user (look for the signal, or look for trains). This casts doubt over the benefit of the current dual signing arrangement at level crossings in the UK.
It is also important to consider that information about whether the crossing is active or passive does not necessarily have to be conveyed by the advance warning sign. Indeed, in the UK, there are other signs which fulfil the role envisaged by Wigglesworth, by distinguishing between active and passive level crossings. Drivers approaching level crossings with light signals are shown a sign that states ‘Stop when lights show’, and those approaching an open crossing are shown a ‘Give way’ sign. These are used in addition to the current advance warning signs.
Traffic signs must be simple in terms of design, legible at a glance from a distance, while travelling at speed and under a wide range of lighting conditions, and be universally understood. In the case of level crossing signs a key conclusion from the broader study was that the simplicity, legibility and universal comprehension of any designs would be compromised by attempts to distinguish between passive and active level crossings, or the behaviours required from road users. Thus, based on the results of the survey activities and the findings of the wider study, a rationale for signing was established, which concluded that a single advance warning sign for all level crossings would have a better chance of being understood than the two existing signs. This new, universal, warning sign would be supplemented by other existing signs which instruct road users about how to behave at the crossing (for example, ‘Stop when lights show’, or ‘Give way).
Background information on the redesign of the signs A range of potential designs were produced for this new sign. The design alternatives were initially evaluated by road user focus groups. The focus groups and design refinements are not the subject of this paper, but it is useful to understand some of the activities that took place at this stage of the research. The focus group sessions were designed to obtain information rich feedback on the designs, to determine which measures should and should not be taken forward for further evaluation, and for those to be taken forward, to decide what refinements should be made. In order to facilitate the discussion, audio-visual aids were prepared, including images of existing signs and the new designs out of context, and other images of the designs inserted into a bird’s eye view schematic diagram of a level crossing. A total of 20 road users took part in this phase of the research, including drivers and non-drivers. Following the focus groups some of the designs were dismissed and others were refined.
Questionnaire evaluation of refined prototypes The refinements that were made following the focus groups resulted in the four prototype advance warning signs shown in Figure 4.
Figure 4. Prototype advance warning sign designs
Figure available in the original PDF paper.
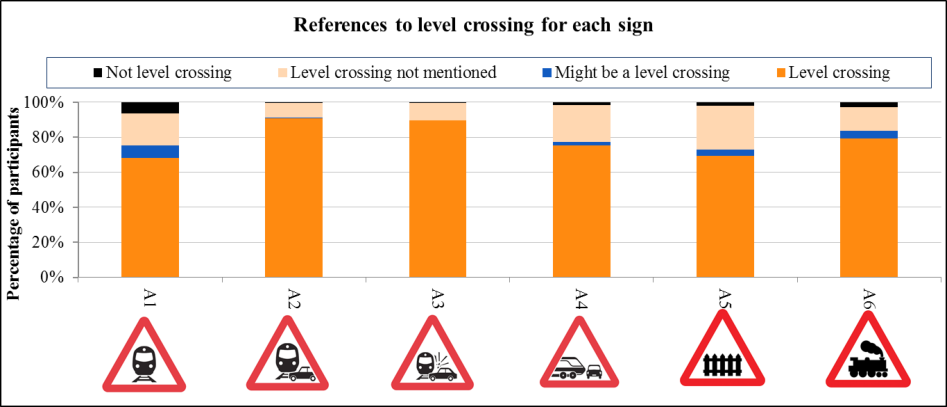
As part of the evaluation of these prototypes, road users were surveyed to gather data on the extent to which the intended meaning of these designs was understood. The survey was administered as a structured interview, in which participants were presented with each of these four design prototypes, and also the two current signs in Figure 1, in randomised order. For each of the signs, they were initially asked to describe what they thought it meant. Figure 5 shows the percentage of participants who made a reference to the presence of a level crossing when describing the meaning of each sign.
Figure 5. Number of participants who made a reference to the presence of a level crossing Signs A2 and A3, followed by A6, were the most likely designs to elicit responses which included the presence or
possible presence of a level crossing ahead. Sign A5, the gate sign, was least likely to be associated with a level crossing. This shows that the new designs are no worse than the current sign in terms of being understood as level crossing signs.
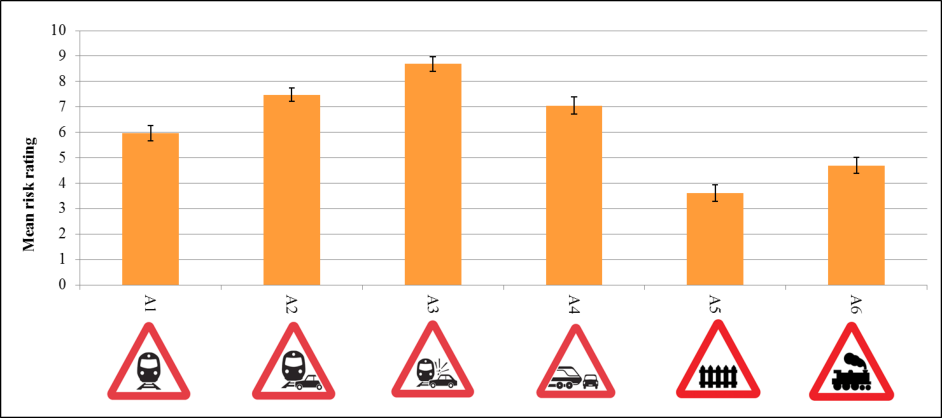
In order to gather information on the effect of the pictograms used in each of the signs on risk perception, participants were asked to rate the level of risk they thought each sign conveyed on a scale of 1 to 10, where 1 meant no risk and 10 meant extreme risk.
For this question half of the participants were shown the advance warning sign with a white background and half of the sample saw the sign with a yellow background (see Figure 6).
Figure 6. Example of a pair of signs, one with a white background and one with a yellow background Interestingly, independent samples t-tests found no significant differences within each pair of signs, suggesting that use of a yellow background did not affect participants’ risk ratings. Therefore the data were combined for each pair of signs showing the same pictogram (ie data for yellow and white background equivalents of the same pictogram were pooled). These data are shown in Figure 7.Figure 7. Mean risk rating for each sign
There was a significant effect of the sign on participants’ risk ratings (F(5,915)=202.424, p<0.001). Pairwise comparisons using the Bonferroni adjustment showed that all of the differences in risk ratings between the signs were statistically significant, except for the comparison between A2 and A4. Sign A3 was associated with the most risk, followed by sign A2. Sign A5, the current gated level crossing sign, was associated with the least risk.
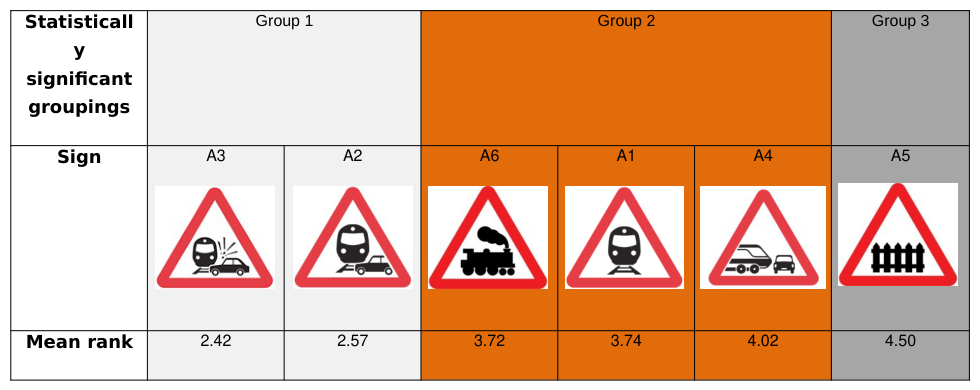
Having answered questions about each sign, participants were then told the meaning that the signs were intended to convey. Having been given this information, participants were then asked to rank how clear and understandable each of the signs were and the mean rank for each sign is presented in Table 2.
A one-way ANOVA showed that there was an overall effect of sign on the rank assigned by participants (F(5,920)=44.815, p<0.001). Pairwise comparisons using a Bonferroni adjustment showed statistically significant differences between most of the signs in terms of participants’ rankings for clarity and understandability. The exceptions to this were the differences between signs A2 and A3, signs A6 and A1, A6 and A4, and A1 and A4, which did not achieve statistical significance. Thus, three groupings emerged, with A2 and A3 achieving the highest rankings, A1, A4 and A6 achieving the second highest, and A5 the lowest in terms of clarity and understandability. These groupings are indicated in Table 2.
Table 2. Rankings for how clear and understandable each sign was Group 1 Group 2 Group 3 Statisticall y significant groupings
Discussion of survey results about design prototypes 185 road users were surveyed to evaluate four design prototypes for a single, universal advance warning sign for level crossings and to make comparisons with the two signs currently used in the UK. Participants were surveyed using a structured interview, in which they were asked what they thought each sign meant and what level of risk they thought the sign conveyed. Having answered these questions the intended meaning of each sign was revealed to them and they were asked to rank the signs in order of clarity and understandability.
The results showed that the design prototypes were at least as successful as the current signs in prompting participants to say that the sign was about a level crossing. When the meaning that each sign intends to convey to road users was revealed, participants felt that two of the design prototypes, A2 and A3, were clearer and more understandable than the current signs. The gates sign, currently used at level crossings in the UK, ranked lowest out of all of the signs tested.
The current signs intend to convey a message regarding whether or not the crossing has barriers, and the first stage of this research showed that they were not successful in doing so. The design prototypes did not intend to convey information about the protection available at the level crossing or the desired road user behaviours, as there are already other signs in place which fulfil this role. Currently the ‘give way’ sign is used where road users need to look left and right to assess whether any trains are approaching the crossing. A ‘Stop when lights show’ sign is used to indicate that road users need to monitor the status of the road traffic light signals, and only proceed when they are extinguished. Thus, the only requirement from the prototypes was to convey the message that there is a level crossing ahead. This study demonstrated that while the design prototypes were able to convey their full meaning, the current signs struggled to make their full meaning, including the presence or absence of gates or barriers, understood.
The data from this study also showed that the new designs implied a higher level of risk than the two existing signs; thus the new designs were more effective in communicating the increased risk at level crossings. As well as reducing errors, a higher perception of risk could have the potential to reduce road user violations. Once again, designs A2 and A3 were the most successful designs in this respect.
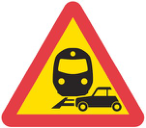
The most promising designs emerging from this evaluation are prototypes A2 and A3. These were the clearest in terms of meaning, and also conveyed the highest level of risk. These signs are very similar to one another, both showing a road vehicle at right angles to a railway with a train in the background. It is thought that the combination of these three elements is a factor in their success. The only difference between these two designs is that A3 implies a collision has taken place between the car and the train, whereas A2 does not. This may explain why A3 achieved a higher risk rating.
The advance warning signs currently used at level crossings have been in place for many decades. It is likely that over time, road users will have learned to associate these signs with the hazards they are placed near. This is likely to have improved comprehension of the existing signs. The fact that new designs previously unknown to road users were found to be more easily understood means that they show promise as future traffic signs.
CONCLUSIONS AND NEXT STEPS The work described in this paper has identified two of the new design prototypes as being clearer and easier to understand than the current traffic signs used at level crossings. In terms of road user comprehension, prototypes A2 and A3 are promising designs. Work is on-going to carry out further user testing, including an evaluation of sign conspicuity and an assessment of road user situation awareness at level crossings where the full range of updated measures generated by the broader project are presented together. The measures that yield positive results during the user evaluations will then be assessed on their cost, engineering feasibility and legality. The project will then outline the steps that would need to be taken prior to the implementation of any of the measures.
REFERENCES
Cooper, B. 1989, Comprehension of traffic signs by drivers and non-drivers, TRL Research Report RR 167, (Crowthorne, Berkshire: TRL) DfT. 2002, Traffic signs regulations and general directions, (London: The Stationery Office) RSSB (2010). Road-Rail Interface Special Topic Report. Rail Safety and Standards Board [Online] Accessed 20 June 2011.
Available at: http://www.rssb.co.uk/SiteCollectionDocuments/pdf/reports/road-rail_interface_str_full.pdf UNECE. 1995, Convention on road signs and signals, done at Vienna on 8 November 1968, Amendment 1, United Nations Economic Commission for Europe [online]. Accessed 21 November 2012, < http://www.unece.org/fileadmin/DAM/trans/conventn/signalse.pdf> United Nations. 2012, Chapter XI B 20 Convention on Road Signs and Signals, Vienna, 8 November 1968, United Nations
Treaty Collection [online], accessed 21 November 2012, <http://treaties.un.org/pages/ViewDetailsIII.aspx? &src=TREATY&mtdsg_no=XI~B~20&chapter=11&Temp=mtdsg3&lang=en> Wigglesworth, E. C. 2001, A human factors commentary on innovations at railroad-highway grade crossings in Australia, Journal of Safety Research, 32, 309-321
LISTED IN THE AHFE DIGITAL BOOKSTORE CATALOGUE
Explore the complete digital volume
Advances in Human Aspects of Transportation: Part I
Read this individual research paper free through the original publisher, or explore the full digital proceedings book.
ISBN 978-1-4951-2097-8
Explore this ISBN in the AHFE Bookstore ↗Listed in the July 2026 bookstore catalogue; search by ISBN to confirm current availability · Digital book purchase optional