Dehlia Willemsen, Arjan Stuiver, Jeroen Hogema (2021). Transition of Control: Automation Giving Back Control to the Driver. In: Advances in Human Aspects of Transportation: Part I. AHFE Open Access, vol. 15. https://doi.org/10.54941/ahfe100648
The automotive domain is currently moving towards automated driver assistance applications, like automatic evasive maneuvers to avoid accidents, and even beyond assistance towards automated driving. However, in the near future these systems will only be active under certain conditions, thus still requiring manual control in other conditions. This means that there will be ‘transitions of control’: from the driver to the automated system and vice versa. Then research questions like ‘how should the system take over’, ‘how can the driver take back control’, and ‘can the driver be regarded as a backup if the system fails’, etc. arise. This paper addresses the effects of various parameters in handing back the control to the driver. This is done for TNO’s virtual tow bar system, which is an automated driving system that controls both the longitudinal and lateral vehicle motion at very close following for economic driving. This paper presents results of a driving simulator experiment executed with the aim to evaluate different parameters settings in switching the tow bar system on and off. Due to the short following distances and safety implications of this, there is be a procedure for hooking on / off of the tow bar system. Special attention is paid to driver behavior just after getting back control following a period of automated driving.
Automotive research is currently putting much effort in automated driving (see e.g. Hoeger et al., 2008); Jootel, 2013; Kameda, 2013). Systems that allow this will be gradually introduced, initially only offering automation for certain circumstances, such as driving on motorways in traffic jams (Anon., 2013; Rees, 2013). Until full automation is reached, the (partial) automated systems need to share control of the vehicle with the driver. Sharing control means the driver needs to be able to give control to the vehicle and needs to be able to regain control from the automated system. Hence, a transition of control (from manual to automated driving and vice versa) needs to be developed. To develop a safe and accepted method for transition of control several questions need to be addressed, such as: ‘how should the system take over’, ‘how can the driver take back control’, ‘can the driver be regarded as a backup if the system fails’, etc.
Literature in the area of transition of control for automated driving does not offer a cookbook recipe on how to design these transitions and what criteria should be used to evaluate the transition. General guidelines for HMI design can be found as well as the general observation that transition of control is an essential part of automated driving (Martens et al., 2008; Hesse et al., 2013). There are results from research carried out for specific systems: e.g. in Bloomfield et al., 1995, a high number of collisions and lane incursions is reported during the transitioning from an automated lane into a manual lane. Flemisch et al., 2010, reports on a study where most drivers were able to adapt to specific transitions and built up correct mental models about it. On the more general level of transferring to and from automated driving there is a lack of clearly formulated guidelines in combination with models and tools. This paper is a first step to bridge this gap and thus facilitate safe introduction of automated driving functions.
To gain insight in the process of the transition of control, we used an implementation of TNO’s virtual tow bar as a case study. The virtual tow bar (VTB) is an automated system that allows a vehicle to follow its predecessor at a relatively short following distance, controlling both the longitudinal and lateral motion. The system is designed to operate on public motorways (i.e. without using dedicated lanes), initially limited to platoons of two vehicles. The first vehicle is driven by a human operator and (once engaged) the second vehicle is controlled by the VTB. The VTB is designed with the aim to reduce fuel consumption. To achieve this goal, the system must maintain relatively short headways, in the order of magnitude of 0.2-0.3 s (see e.g. Jootel, 2013), much smaller than headways normally adopted by drivers.
A simulator experiment was set up to evaluate what the most important parameters that influence the transition of control at switching the VTB system off, and to evaluate how the driver behaves at switching off. The effects of the parameters on user acceptance and on user performance are reported in (Willemsen et al. 2014). This paper concentrates on driver behavior at switching the VTB off.
VIRTUAL TOW BAR SYSTEM As explained in the Introduction the VTB system implies short following distances, which means the driver cannot be regarded as a backup to take over in case of system failure or any other emergency. To create a safe transition when the following distance is so small, a scheme was designed to let the driver switch the system on from a safe following distance after which the automated system decreases the following distance to the desired (small) following distance. When switching off, the system first increases the following distance to a safe length before giving back control to the driver.
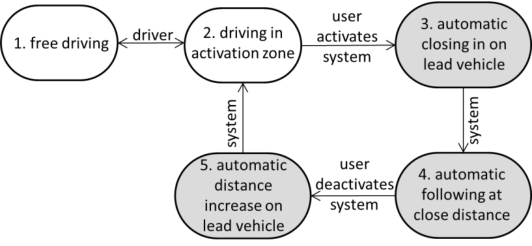
System model The VTB was modelled as a combination of a Cooperative Adaptive Cruise Control (CACC) controller (Ploeg et al., *) and a Lane Keep Assist (LKA) system. The Cooperate part of the system consists of short-range communication between the two vehicles in the platoon. Via this channel, the longitudinal following controller has access to the current acceleration command of the lead vehicle, which provides additional damping with respect to an autonomous ACC that only has distance and relative speed as control inputs. The LKA algorithm was used to provide lateral control of the vehicle with respect to the middle of the lane. The controllers were combined and logic was added to create different system modes (see Figure 1).
Figure 1. Modes of the virtual tow bar system.
Switching the automated system on was always initiated by the driver by pushing a button. To be able to switch the system on the driver had to drive in a ‘activation zone’ behind the preceding vehicle (mode 2). After activating the Human Aspects of Transportation I (2021) system by pushing the ‘on/off’ button the system would take over both longitudinal and lateral control and then start reducing the following distance (mode 3). After that, the actual VTB system was on (mode 4). To deactivate the VTB system, the driver could either push the ‘on/off’ button or touch the brake pedal. The automated system would then increase the distance to a safe distance (mode 5) and transfer both longitudinal and lateral control back to the driver in the initial activation area (mode 2).
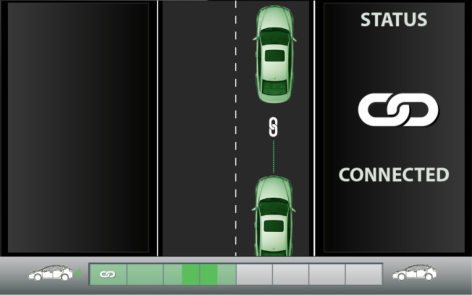
System interface A dedicated interface was developed for the experiment using a user-centered design approach (see Figure 2). A visual display was mounted in the mid console of the mock-up as high as possible without blocking the view on the road. On this display the user could see the current status of the system, a graphical indication of the current time headway and whether they could engage the system. Lower in the mid-console, within easy reach for the participants, a button was placed which they could press to engage or disengage the system. Pressing the brake pedal would also initiate a disengagement the system.
Figure 2: Dedicated interface showing system status and time headway The goal of the study was to develop guidelines and test principles of transition of control, not to develop a specific HMI. We therefore wanted the user experience with the system to be as good as possible and no flaws in the interface that might disturb the experience. We therefore needed an interface of which we were sure enough that it was for a very large part understood and accepted by the user. If the participants had trouble understanding or accepting the interface that would have (undesirably) more impact on the outcome of the study than the manipulation of the transition itself. In an iterative process we designed, developed and tested an HMI in a low- fidelity simulator until it was well understood by pilot participants.
EXPERIMENTAL SETUP Driving simulator and scenario
The experiment was carried out in a high fidelity moving base driving simulator (Van den Horst and Hogema, 2011). The driving simulator that was used consisted of a BMW mock-up mounted on a 6DOF moving base. The road and traffic environment were projected on cylindrical screens around the vehicle. The projection system for the front view had a horizontal viewing angle of 3 x 60 = 180 degrees, realized by three projectors. The vertical viewing angle was 41 degrees (22 degrees above and 19 degrees below the neutral viewing direction). The driver could use the existing BMW external rear view mirrors to look at two screens placed behind the vehicle displaying the environment behind. Similar, the internal rearview mirror could be used to look at a 32 inch LCD screen placed in the back of the car. Feedback of steering forces was given to the driver by means of a high-fidelity electrical torque engine.
Participants drove on the right-hand lane (the slower lane) of a two-lane motorway behind a lead vehicle that was Human Aspects of Transportation I (2021) driving with an average speed of 100 km/h. The participants were instructed to follow this lead vehicle. There were no entries or exits on the route the participants drove. Slight curves and surrounding traffic made the experience more realistic.
Parameters The study focused on the actual transition of the control, i.e. when the driver hands over the control to the system and later reclaims control from the system, all under normal circumstances, i.e. no system failures. Both transitions (on/off) are initiated by the driver. Due to these initial restrictions the following parameters were varied to get more insight in the process of transition of control:
Type of feedback to the driver during the handing back of control. Two cases were compared. In one case, called ‘instant’ in this study, the system first increased the following distance then the driver was given an audible signal that he or she should take over control. In the other case, called ‘countdown’, the system first increased the following distance until the distance was large enough to disengage the system. The driver was then presented a countdown of 5 seconds before control was actually handed back, also indicated through the audible signal as in the ‘instant’ case.
Method of initiating the transition of control: either by button (on/off) or brake (off), which the driver was free to choose.
Strategy followed for increasing and decreasing the following distance. Two different timings (10 and 15s) were used to decrease and increase the following distance at switch the system on/off, respectively.
Following distance. Three different following distances were tested, corresponding to time headways of 0.1s, 0.3s and 0.8s, respectively.
The first two parameters are general parameters that concern the transition of control, whereas the latter two are of specific interest for the VTB system.
Originally also the cross-fade time (i.e. the time where the control authority of the driver is gradually replaced by the control authority of the VTB system) was a parameter. However, experimenting with this parameter in the simulator in combination with the first parameter that influences the moment of transition of control, gave confusing results. Therefore the cross-fade parameter was fixed to a value of 1 s.
The activation zone was fixed between 0.6 and 2.0 s time headway. These values were pre-tested in a low-fidelity simulator at setting up the VTB system.
To avoid mode confusion (Hoeger et al., 2008) and to restrict the amount of testing parameters the longitudinal and lateral control was switched on/off simultaneously.
Participants, procedure and experimental setup A total of 16 participants completed the sessions. Before driving the participants were inquired about their comprehension and acceptance of the interface and filled in a general questionnaire (demographic, driving experience etc.). In the driving simulator, all participants started with a short drive to get acquainted with the driving simulator and during which they were given further details about the experiment (how to behave in traffic, where to disengage the system). After this familiarization run they started with a baseline run, i.e. without the VTB system. This was a normal drive on the same road as they would drive on in the conditions with the system. There was a lead vehicle in front of them which they were not allowed to overtake. This ensured that all participants were more or less driving at similar speeds. The lead vehicle would brake after 3000 m (1.5 s with -2 m/s2 followed by 2 s braking with -5 m/s2) from which the driver reaction time could be measured. The reaction time was compared with the reaction time to a similar brake event in the last run with the VTB system.
After the baseline run the participants drove four runs with the VTB system on. They had to activate the system themselves immediately after the simulator run started and to deactivate the system after passing a sign on the road instructing them to switch off the VTB system. The sign was pointed out in the familiarization run and was placed such that it was before a curve in the road to make sure they had to take over (lateral) control actively to prevent the vehicle from driving off the road.
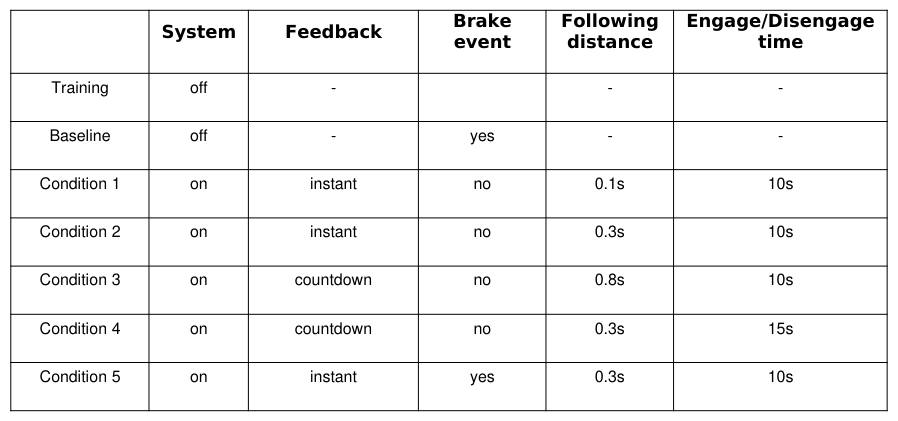
In the four runs with the VTB system on the participants were presented four conditions in a balanced order. In these four conditions four parameters, described above in the section on parameters, were manipulated. Table 1 gives an overview of the conditions. The four balanced conditions were always followed by a fifth condition in which a brake event (similar to the baseline) would occur. The settings of the four parameters was the same for all participants in the fifth condition.
Table 1: An overview of the conditions. Condition 1 to 4 were balanced, condition 5 was always last.
Regaining back control not only involves the actual control of the vehicle, but also being back in the traffic situation, i.e. having re-established sufficient situation awareness. So, on the one hand the driver suddenly has to control a vehicle at speed in a specific traffic situation, i.e. at least two of the three levels of driver behavior (Michon, 1985) are involved: the maneuvering level and the control level. As an indication on the transition of control on the maneuver level, the reaction time of the driver after regaining control is evaluated. For the control level, we look at the steering behavior at regaining control.
RESULTS
This section describes the results of the simulator study focusing on the phase where the driver regains control from the VTB system. As mentioned in the introduction the effects of the parameters on user acceptance and on user performance are reported in Willemsen et al., 2014.
Driver reaction time after regaining control The effect of driving with an automated system on the driver was evaluated through establishing his/her reaction time to a braking front vehicle. This was measured in the first drive where the VTB was not switched on and the participant only had to follow a preceding vehicle and the last run where the VTB system was just switched off. At the end of both drives the preceding vehicle braked. Data of two participants were discarded as these drivers did not brake for the preceding vehicle. Figure 3 shows the reaction times of the drivers (i.e. the time between onset of braking of the lead car and of the participant) and suggests that the reaction time after driving with the automated system is larger than after driving manually for about the same distance, in line with finding of e.g. Merat and Hamish Jamson, 2009. In Figure 3 (on the right) a scatter plot of the reaction time versus the time headway (THW) is given to illustrate that the THW levels in the tests with and without the system are comparable.
Figure 3. Reaction time (mean and standard deviation in seconds, left) and reaction time vs. THW (at start for braking, right) to a brake event of the vehicle in front of the participant without and with the system active just before the brake event.
Figure available in the original PDF paper.
Both braking situations are also comparable when looking at the time to collision (TTC) at braking and the minimum TTC during the braking (Figure 4).
Figure 4. Indicators (mean and standard deviation) of the braking event comparing the run where the VTB system was active against the base line run, where the VTB system was not active
Figure available in the original PDF paper.
It has to be investigated what are the main reasons for the larger reaction time (e.g. distraction, lack of situation awareness or mode switch time) and what can be done to shorten this period or even avoid it.
Driver steering at regaining control The simulator test was designed such that the switching off of the VTB system was just before or in a mild curve to force the driver to steer the vehicle. The steering actions of the drivers after switching the VTB system off are compared to the steering actions of the baseline run (where the VTB system was off) at the same location, during 3 s after switching the VTB system off. This is displayed in Figure 5. It must be noted that not all runs of all drivers were evaluated. There were quite some runs where the driver switched the VTB system on immediately after switching it off, these runs were discarded. One run was not driven and in one run the driver lost control at switching off. All together 17% of the runs had to be discarded.
Figure 5. Steering effort of the drivers (mean and standard deviation) just after switching the VTB compared to the baseline without the VTB system.
Figure available in the original PDF paper.
There is a difference in the utilized range of steering wheel (left plot in Figure 5). In the baseline the range seems to be much smaller. However, the amount of steering wheel reversals is comparable (right plot in Figure 5). Similar behavior was observed in (Bloomfield et al., 1996) where the driver had to take over steering (and in some cases also longitudinal control) from an automated highway system with a mild curve in the road as well, although (Bloomfield et al., 1996) does not compare to driving manually but compares to the performance of the automated system. It may be that the driver is not adapted to the vehicle dynamics anymore, making stronger steering inputs than necessary in the situation as indicated by the baseline run. Another explanation maybe that the driver is awaiting to require control and is checking if he/she has control. The way of transferring back the control to the driver does not seem to influence the steering behavior much (Figure 6).
Figure 6. Steering effort (mean and standard deviation ) of the drivers just after switching the VTB for the different switching off strategies of Table 1.
Figure available in the original PDF paper.
Finally the steering performance of the drivers is evaluated by looking at the lateral offset in the lane at a specific section in the curve of 219 m. This section was chosen such that for most tests the driver was in control in this section, while also still in the curve. The switching off procedure is longer for some of the conditions (see table 1): it lasts 5 seconds longer for the conditions with the countdown in the switching off and another 5 seconds longer for the larger disengage time. For condition 4 e.g. this means 10 extra seconds before the control is transferred to the driver as compared to condition 1 or 2. Some of the test runs had to be deleted from the evaluation as the switching off was too far in the curve or after the curve. This was especially the case for condition 4, resulting that only 4 of the runs could be evaluated. Figure 7 comprises the results for the range of the lateral deviation (i.e. the difference between the maximum deviation and the minimum deviation). Again a comparison is made between the runs with the system and the base line, and the conditions are compared to each other.
Figure 7. Lateral lane deviation in the curve (mean and standard deviation): on the left a comparison between without the VTB system and with the VTB system, and on the right comparison between the different switching off strategies of Table 1.
Figure available in the original PDF paper.
Due to the large standard deviation in the data of the runs with the VTB system, no clear statement can be made on the difference between driving a curve just after switching the VTB system off and driving without any automation. Regarding the differences between the conditions (right plot in Figure 7), it seems that the conditions 3 and 4 result in larger deviations in the lane, however, also here the standard deviation of the data is large. And for condition 4 only 4 runs were evaluated.
CONCLUSIONS
A study comprising a simulator experiment was conducted to gain insight in the process of transferring control from a driver to an automated system and from the automated system to a driver. The automated system was a virtual tow bar system, that let the vehicle automatically follow a preceding vehicle at short following distances. The behavior of the driver just after switching off the virtual tow bar system was evaluated.
Due to the low sample size of 16 participants no statistically founded conclusions can be drawn. However, the analysis of the effects of a braking front vehicle performed with and without the automation on does indicate that the reaction time of the driver is larger after having driven with the automated system (and only for a short period of time). This phenomenon was not caused by different staring situation as confirmed by the THW at the start of the braking. Due to the larger reaction time, safety may be compromised, which can perhaps be counteracted by increasing other safety precautions such as autonomous emergency braking systems (AEB). After deactivating the virtual tow bar system, the settings of an autonomous emergency braking system could for example temporarily by more sensitive, to gain a faster and thus safer reaction for a short while, accepting the possible higher risk of false positives.
Evaluation of the steering behavior of the driver just after switching off reveals a larger utilization of the steering wheel range after switching off the virtual tow bar system compared to the baseline run without the virtual tow bar system. There was no large difference observable in the steering wheel range or reversal rate between the different ways of switching the virtual tow bar off. Neither was there a large difference in the way a curve was driven after the virtual tow bar system was switched off compared to the situation without the virtual tow bar system. It is to be investigated why the driver uses a larger steering wheel range just after switching the virtual tow bar system on and how the driver van be supported in regaining steering control.
REFERENCES
Alam, A.A., Gattami, A., Johansson, K.H. (September 2010), “An experimental study on the fuel reduction potential of heavy duty vehicle platooning”, 2010 13th International IEEE Conference on Intelligent Transportation Systems (ITSC), Madeira, Portugal, pp. 306-311. Anon. (January 2013), “Audi's autonomous cruise control - traffic jam assist” available: http://www.youtube.com/watch?
v=JnPJse5yYbc Bloomfield, J.R., Christensen, J.M., Peterson, A.D, Kjaer, J.M., Gault, A. (July 1995), “Human Factors Aspects of the Transfer of Control from the Automated Highway System to the Driver”, U.S. Department of Transportation - Federal Highway Administration, Publication No. FHWA-RD-94-114, U.S.A. Bloomfield, J.R., Carroll, S.A., Papelis, Y.E., Bartelme, M.J. (November 1996), “The Driver’s Response to an Automated
Highway System with Reduced Capability”, U.S. Department of Transportation – Federal Highway Administration, Publication No. FHWA-RD-96-067, U.S.A. Flemisch, F., Kaussner, A., Petermann, I., Schieben, A., Schömig, N. (December 2010), “Validation of concept on optimum task repartition”, Deliverable D.33.6, HAVEit-project, available: http://www.haveit-eu.org/displayITM1.asp?ITMID=24&LANG=EN Hesse, T., Schieben, A., Heesen, M., Dziennus, M., Griesche, S., Köster, F. (2013), ”Interaction design for automation initiated
steering manoeuvres for collision avoidance”, 6. Tagung der Fahrerassistenzsysteme, available: mediatum.ub.tum.de/doc/1187194/1187194.pdf Hoeger, R., Amditis, A., Kunert, M., Hoess, A., Flemisch, F., Krueger, H.P. , Bartels, A., Beutner, A. (2008), “Highly Automated Vehicles For Intelligent Transport: HAVEit Approach.” ITS World Congress, New York, USA Van der Horst, A.R.A., Hogema, J.H. (2011), “Driving simulator research on safe highway design and operation. Transportation
Research Record”, (2248), pp. 87-95. Jootel, P.S. (2013), “SARTRE Safe Road Trains for the Environment”, Final Report. available: http://www.sartre-project.eu/en/publications/Documents/SARTRE_Final-Report.pdf Kameda, M. (2013, November 25), “Nissan road-tests self-driving vehicle” The Japan Times, available:
http://www.japantimes.co.jp/news/2013/11/25/business/nissan-road-tests-self-driving-vehicle Martens, M., Pauwelussen, J., Schieben, A., Flemisch, F., Merat, N., Jamson, S., Caci, R. (2008), “Human Factors’ aspects in automated and semi-automatic transport systems: State of the art”, D3.2.1, CityMobil project. available: http://www.citymobil-project.eu/site/en/documenten.php Merat, N., Hamish Jamson, A., (2009), “How Do Drivers Behave in a Highly Automated Car?”, PROCEEDINGS of the Fifth
International Driving Symposium on Human Factors in Driver Assessment, Training and Vehicle Design Michon, J.A. (1985). “A critical view of driver behaviour models: What do we know, what should we do?” In L.A. Evans, & R.C. Schwing (Eds.), Human behaviour and traffic safety (pp. 487 525). New York: Plenum Press. Ploeg, J., Van de Wouw, N., Nijmeijer, N. (*), Lp string stability of cascaded systems: Application to vehicle platooning. IEEE
Transactions on Control Systems Technology. Accepted. available: http://ieeexplore.ieee.org/stamp/stamp.jsp? arnumber=06515636 Rees, J. (2013, September 9), “Mercedes S-Klasse fährt automatisch von Mannheim nach Pforzheim“, Wissenschafts Woche, available: http://www.wiwo.de/technologie/auto/autonome-autos-mercedes-s-klasse-faehrt-automatisch-von- mannheim-nach-pforzheim/8754548.html Shladover, S.E. (June 2010), Truck Automation Operational Concept Alternatives. 2010 IEEE Intelligent Vehicles Symposium,
San Diego, USA, p1072-1077. Willemsen, D., Stuiver, A., Hogema, J., Kroon, L., Sukumar, P. (June 2014), “Towards Guidelines for Transition of Control”, paper F2014-ACD-009 to be published at the 2014 FISITA World Automotive Congress, Maastricht
LISTED IN THE AHFE DIGITAL BOOKSTORE CATALOGUE
Explore the complete digital volume
Advances in Human Aspects of Transportation: Part I
Read this individual research paper free through the original publisher, or explore the full digital proceedings book.
ISBN 978-1-4951-2097-8
Explore this ISBN in the AHFE Bookstore ↗Listed in the July 2026 bookstore catalogue; search by ISBN to confirm current availability · Digital book purchase optional