Atsuo MURATA, Tomoko NAKAMURA, Saki KUBO (2019). Basic Study on Prevention of Human Error - Debiasing Method of Cognitive Biases in Decision Making -. In: Advances in Cross-Cultural Decision Making. AHFE Open Access, vol. 6. https://doi.org/10.54941/ahfe100206
Cognitive biases potentially and unexpectedly induce crucial disasters such as Three Mile Island disaster and Challenger space shuttle disaster. This study explored how cognitive biases can be eliminated by paying attention to the characteristics or properties of each bias. The following cognitive biases were used to discuss the effectiveness of debiasing method of cognitive biases: ignorance of base rate, regression to mean, conjunction fallacy, framing effect, illusion of covariation, and overconfidence. In other words, the effectiveness of debiasing methods of these biases in decision making was experimentally discussed. The debiasing methods presented in this study were effective to some extent for suppressing the biases (conjunction fallacy, ignorance of base rate, and regression to mean) to some extent. However, for some cognitive biases (framing effect, fallacy of covariation, and overconfidence), the debiasing methods in this study were not necessarily effective. Some implications for the prevention of crucial human errors and accidents were given from the viewpoints of cognitive biases included in disastrous accidents.
Due to bounded rationality, we generally cannot make decision rationally, and thus suffer from cognitive biases (Kahneman, 2011, Tversky and Kahneman, 1974, Kahneman and Tversky, 1984, Altman, 2012, Angner, 2012 and Bazerman and Moore, 2001). Kahneman (2011) shows that our cognitive information processing is conducted by System1 or System2. While System2 requires us to conduct effortful, demanding and deliberate mental activities, System1 operates quickly, automatically, without time consuming, and intuitively with little or no efforts. Although heuristic approaches that we adopt when we have no time to deliberate are based on System1, and are very simple and intuitive, such approaches are suffering from cognitive biases.
According to Bazerman and Moore (2001), we summarized how cognitive biases are induced. It is hypothesized that the heuristics such as availability, representativeness, confirmation, or affect cause the biases such as confirmation biases, and anchoring and adjustment. In Figure 2, not only heuristics but also overconfidence and framing is shown as causes of biases. Moreover, it is assumed that our bounded awareness and uncertain (risk) situations forms the basis of heuristics, overconfidence, and framing. Due to such bounded ability, it is valid to judge that we cannot behave rationally but irrationally.
As mentioned above, we frequently tend to behave irrationally, and are in most cases unaware of how and to what extent these irrational behaviors influence us. Such irrational properties are sure to distort our decisions, and in the worst cases lead to crucial accidents. Without consideration of our bounded rationality (irrationality), we cannot prevent crucial accidents from occurring and analyze the true (genuine) cause (source) of accidents.
Representativeness heuristic induces representative biases such as ignorance of base rate, regression to mean, and conjunction biases. Overconfidence also leads to biases such as illusion of control, fallacy of planning, and optimistic biases. Such biases lead to crucial accidents such as the Challenger space shuttle disaster (Reason, 1990 and Vaughan, 1997), Three Mile Island nuclear reactor meltdown (Lusted, 2012 and Osif et. al., 2006) or the collision accident (occurred in 2008) between the Japanese Aegis-equipped destroyer “Atago” belonging to Ministry of Defense and the fishing boat “Seitokumaru.” Therefore, the elimination of cognitive biases must be one of the effective and promising counter measures for preventing crucial accidents. It is also possible that representative biases distort the evaluation of risks.
This study explored how cognitive biases can be eliminated. The following cognitive biases were used to discuss the effectiveness of debiasing method of cognitive biases: ignorance of base rate, regression to mean, conjunction fallacy, framing effect, illusion of covariation, and overconfidence. In other words, the effectiveness of debiasing methods of these biases in decision making was experimentally discussed.
METHOD
Eighty participants took part in the experiment. The participants allocated to each experiment below were equally allocated to either biasing representation or debiasing representation. In other words, half were allocated to each condition. The answering time limitation differed among questions. On the basis of the answer for each type of bias, the performance data such as the percentage correct of each question was compared between biasing and debiasing conditions.
Conjunction fallacy Linda is 31 years old, single, outspoken, and bright. As a student, she was deeply concerned with issues of discrimination and social justice, and also participated in antinuclear demonstrations. Which of the following two alternatives is more probable ?
Probability-based (biasing) representation: (a) Linda is a bank teller. (b) Linda is a bank teller and active in the feminist movement.
Frequency-based (debiasing) representation: Imagine 200 females like Linda. Which of the following two alternatives is more frequent? (a) Linda is a bank teller. (b) Linda is a bank teller and active in the feminist movement.
The experimental factor (between-subject factor) was whether debiasing was tried or not. The percentage correct was compared between the biasing and the debiasing conditions.
Ignorance of base rate Probability-based (biasing) representation: A device has been invented for screening a population for some disease. Although the device is a very excellent one, it is not perfect. Therefore, if someone is not a sufferer, there is a 1% chance that he or she will be judged positive. Roughly 1% of the population has the disease. Mr.Suzuki was tested, and the result was positive. Answer the chance (probability) that he is a sufferer. (A) 85% (B) 50% (C) 20%
Frequency-based (debiasing) representation:
Roughly one out of 100 has the disease. A device has been invented for screening a population for some disease. Although the device is a very excellent one, it is not perfect. The device judges that one of 100 is a sufferer in spite of being healthy. How many of 100 are judged positive and how many of these persons is actually a sufferer? (A) One out of 100 is judged positive, and one is actually a sufferer. (B) Two out of 100 are judged positive, and one is actually a sufferer. (C) Five out of 100 are judged positive, and one is actually a sufferer.
The experimental factor (between-subject factor) was whether debiasing was tried or not. The percentage correct was compared between the biasing and the debiasing conditions.
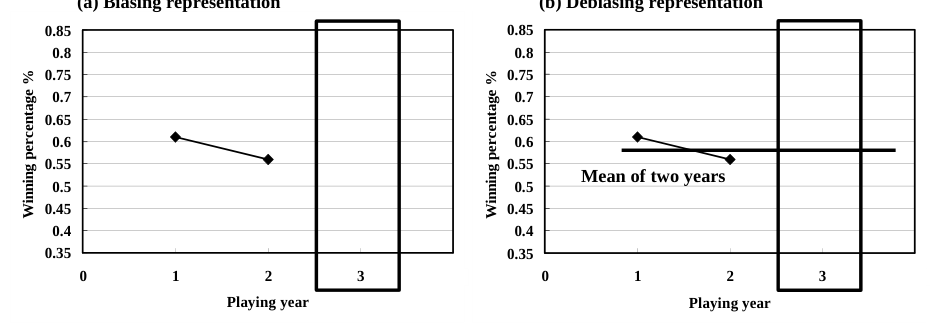
Regression to mean The participants were required to predict the winning average of one NPB (Nippon Professional Baseball Association) pitcher on the basis of data for past two years. The participant was also required to predict the batting average of one NPB player on the basis of data for past two years.
Biasing representation: In this condition, as shown in Figure 1(a), the prediction of next year’s winning average was conducted with no reference of the mean winning average for past two years. The participant was also ordered to predict next year’s batting average of three players A-C on the basis of Table 1(a) with no reference of the mean winning average of three players A-C.
Debiasing representation: In this condition, as shown in Figure 1(b), the prediction of next year’s batting average in 2013 was conducted with a reference (horizontal line) of the mean batting average for past two years. The participant was also ordered to predict next year’s batting average of three players A-C on the basis of Table 1(b) with a reference of the mean winning average of three players A-C.
The experimental factor (between-subject factor) was whether debiasing was tried or not. The mean difference between the predicted and the actual batting average was calculated and compared between the biasing and the debiasing conditions.
Framing effect The following Asian disease problem (refer to Kahneman, 2011) was used. Imagine that US is preparing for the outbreak of an unusual Asian disease, which is expected to kill 600 people. Two alternative measures have been proposed to combat the disease. Assume that the exact scientific estimates of the effectiveness of the measures are as follows when using the positive frame. If measure A is adopted, 200 people will be saved. If measure B is adopted, there is a one-third probability that 600 people will be saved.
According to Kahneman (2011), a substantial majority of respondents chose measure A, and preferred the certain option (measure A) to the gamble (measure B).
The negative frame can be expressed as follows. If measure C is adopted, 400 people will die. If measure D is adopted, there is a one-third probability that nobody will die, and a two-thirds probability that 600 people will die.
If we look closely and compare the positive and the negative versions, we easily notice that measures A and C are identical, and that measures B and D are identical. In spite of this, a large majority of people tended to prefer the gamble (measure D) to measure C. This corresponds to the reversal of preferences, and the framing induces such a cognitive bias.
Therefore, it was explored whether such a bias could be deleted or not using the following experimental procedure.
(b) Debiasing representation
(a) Biasing representation
Figure 1. Graphic representation of winning percentage for the past two years. (a) Biasing representation, (b) Debiasing representation.
Figure available in the original PDF paper.
Table 1. Table representation of batting average for three players. (a) Biasing representation, (b) Debiasing representation.
Biasing condition: The participant was provided with the positive and the negative frames above, and required to select an alternative A or B, or C or D. No other instructions were given to the participant.
Debiasing condition: In this condition, the participant was required to select an alternative A or B, or C or D, and to state the reason why they selected measures A or B, or C or D. This will be called elaboration condition.
The experimental factor (between-subject factor) was whether we made an attempt to delete a cognitive bias or not.
Illusion of covariation The participant was provided with the data in Table 2(a)-(b) and required to answer whether there existed causality between dizziness symptom and brain tumor, and between drinking habit and liver cancer. No causality exists in Table 2(a), while there exists causality in Table 2 (b).
Table 2. Cases (a) without causality and (b) with causality. (a) No causality
Table available in the original PDF paper.
Brain tumor
Brain tumor
Dizziness symptom
Dizziness symptom
Yes No
Yes No
Yes
Yes
160 40
160 40
No
No
40 10
40 10
(b) Causality
Liver cancer
Liver cancer
Drinking habit
Drinking habit
Yes No
Yes No
Yes
Yes
180 20
180 20
No
No
30 170
30 170
Biasing condition: The participant was provided with no information necessary for scientifically verifying the causality.
Debiasing condition: The participant was provided with information (hint) necessary for scientifically verifying the causality.
The experimental factor (between-subject factor) was whether we made an attempt to delete a cognitive bias or not.
Overconfidence Scientific questionnaires which consist of 20 questions were prepared. Examples of scientific questions were as follows. (1) Which atomic weight is larger, Ag (silver) or Au (gold)? (2) Which condition is (x-2)(x+3)=0 for x=2, necessary condition or sufficient condition? (3) Which condition is inequality x>1 for x>-2, necessary condition or sufficient condition? (4) Which is larger, 25 or 33 ? (5) Which wave length is shorter, infrared rays or ultraviolet rays? (6) Which corresponds to the period of 500 Hz, 0.12s or 0.002s? (7) Which probability is higher when drawing a card from the deck of 13 cards of heart 1 to heart 13, (A) the probability of drawing multiples of 5, or (B) the probability of drawing two even numbers in a raw?
The participants were required to answer one of the following questions after having finished answering all of 20 questions.
Biasing condition: The participant was required to rate his or her confidence to the answer using 0-100%.
Debiasing condition: The participant was required to predict how many correct answers out of 20 problems he or she reached.
The experimental factor (between-subject factor) was whether we made an attempt to delete a cognitive bias or not. It was discussed whether overconfidence can be deleted by asking the participant about frequencies of correct answer instead of asking him or her confidence of the answer.
Table 3. Number of participants trapped into conjunction fallacy compared between biasing and debiasing conditions (conjunction fallacy).
Comparison of two population proportions Debias group Bias group
Comparison of two population proportions Debias group Bias group **(p<0.01) 5 35 Conjunction fallacy **(p<0.01) 5 35 Conjunction fallacy
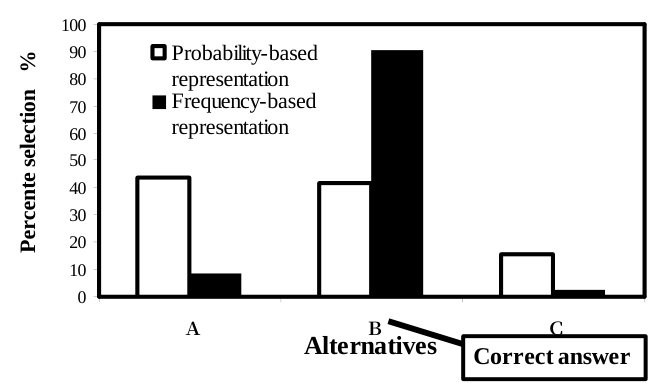
Figure 2. Percentage selection for each alternative (A-C) compared between probability-based and frequency-based representations (ignorance of base rate). In this case, the correct answer is B.
Figure available in the original PDF paper.
RESULTS
Conjunction fallacy The comparisons of percentage correct between biased and the debiased versions is summarized in Table 3. From Table 3, it is clear that the debiasing method is effective for deriving correct answers and eliminating conjunction fallacy. The result means that the definite distinction between single-event probabilities and frequencies was important for the bias related to conjunction fallacy.
Ignorance of base rate In Figure 2, the frequency-based representation produced more correct answers than the probability-based representation. As hypothesized, the frequency-based representation was effective for eliminating representativeness bias (ignorance of base rate).
Regression to mean The difference between the predicted and the actual winning percentage (or batting average) was calculated for each participant. In Figure 3(a), the difference between the mean and the prediction is compared between biasing (without baseline as shown in Figure 1(a)) and debiasing (with baseline as shown in Figure 1(b)) conditions. In Figure 3(b), the difference between the mean and the prediction is compared between biasing (without mean value as shown in Table 1(a)) and debiasing (with mean value as shown in Table 1(b)) conditions. Comparing Figure 3(a) and Figure 3(b), it is clear that the table representation is more effective than the graphic representation. Adding the mean value to the table as a reference was effective for eliminating the bias related to the regression to mean.
(B) Table representation
(A) Graphic representation
0.01
0.01
0.009
0.009
0.008
0.008
0.007
0.007
0.006
0.006
0.005
0.005
0.004
0.004
prediction
prediction
0.003
0.003
0.002
0.002
0.001
0.001
Differencebetween mean and
Difference between mean and
0
0
With mean value Without mean value
With base line Without base line
Figure 3. Difference between mean and predictionas a function of debiasing condition (with base line or mean value or without base line or mean value) and representation method ((A)graphic representation and (B)table representation) (regression to mean). (B) With elaboration (A) Without elaboration
Figure available in the original PDF paper.
Percentage selection %
Percentage selection %
0
0
positive negative
positive negative
Figure 4. Percentage selection as a function of frame (positive and negative), risk condition (with risk and without risk), and debiasing condition (without elaboration and with elaboration) (Framing effect).
Figure available in the original PDF paper.
Framing effect In Figure 4(a) and (b), the debiasing effect by elaboration is summarized. In the elaboration condition (debiasing condition), the participant was required to explain why the alternative was selected. The reversal of preference (Alternative A is selected for positive frame, while alternative D is selected for negative frame) was not removed by the elaboration instruction (explanation of why they selected the alternative).
Illusion of covariation The percentage of correct and wrong answers for both biasing and debiasing conditions is shown in Figure 5(a) and (b). The debiasing measure (providing the participant with elaborated explanation for scientifically verifying the causality) did not work properly for the deletion of cognitive bias in capturing the causality. This shows that it is not so easy for us to recognize the causality correctly, and that we suffer from cognitive biases when understanding the relationship between the cause and effect.
Overconfidence
Figure 6 shows the relationship between the percentage correct and the prediction of number of correct answers (expressed as percentage correct answer) as a function of the way how the participant expressed his or her confidence (frequency representation: asking the participant about frequencies of correct answer out of 20 problems
(a) No causality (relationship between dizziness and brain tumor)
(b) Causality (Relationship between drinking habit and liver cancer)
Correct Wrong
Correct Wrong
Figure 5. Percentage of correct and wrong answers compared between biasing and debiasing conditions (illusion of covariation). (a) without causality, (b) with causality.
Figure available in the original PDF paper.
Probability representation Frequency representation
1
0.9
0.8
0.7
0.6
0.5
0.4
Predicted percentage correct %
0.3
0.3 0.4 0.5 0.6 0.7 0.8 0.9 1
Percentage correct %
Figure 6. Relationship between percentage correct and predicted percentage correct (overconfidence). Data above the diagonal line represents overconfidence. Data below the diagonal line represents underconfidence.
Figure available in the original PDF paper.
or probability representation: asking him or her confidence of the answer). If overconfidence is dominant, the greater part of data exists above the diagonal line in Figure 6. The following tendencies were as a whole observed. Overconfidence was dominant for the frequency representation, while underconfidence was dominant for the probability representation. The result might show that overconfidence is deleted by probability representation. However, it must be noted that not correct evaluation but underconfidence appeared as a result of deleting overconfidence.
DISCUSSION
Conjunction fallacy From Table 3, it was confirmed that the debiasing method by frequency-based representation of sentences is effective for deriving correct answers and eliminating cognitive biases. Frequency-based representation can prevent us from trapping into a cerebrated reasoning error, that is, misjudgment that the conjunction of two facts is larger than the conjunction of one fact.
The finding that the frequency-based expression contributes to delete conjunction fallacy might be effective for deleting cognitive bias especially when evaluating the risks for a variety of events.
Ignorance of base rate As hypothesized and shown in Figure 2, the frequency-based representation was found to be effective for eliminating representativeness bias (ignorance of base rate). Generally, we are not so good at understanding and recognizing probabilistic phenomena, especially risk. In order to overcome this, the frequency-based representation and explanation of probabilistic phenomenon must be promising. The result means that the definite distinction between single-event probabilities and frequencies is important for deleting the cognitive bias related to the ignorance of base rate. The frequency-based representation helped eliminate bias of ignorance of base rate due to the probability-based representation.
Taking such characteristics into account, it is desirable to use frequency-based representation when we need to assess some risk so that cognitive biases are prevented.
Regression to mean Comparison of Figure 3(a) and Figure 3(b) made it clear that the table representation is more effective for representativeness bias (regression to mean) than the graphic representation. Adding not the mean line to the graphic representation but the mean value to the table as a reference was effective for eliminating the bias related to the regression to mean.
The reason might be inferred as follows. The graphic representation in Figure 1 makes the respondent (participant) more conscious of the decrease of winning average for the past two years, and thus led to the rebound of the predicted value in the third year. On the other hand, the numerical expression in Table 1 might help make the respondent (participant) conscious of the mean value.
Framing effect The reversal of preference (Alternative A is selected for positive frame, while alternative D is selected for negative frame) was not removed by the elaboration instruction in this study. Although Kahneman (2011), Tversky and Kahneman (1974), and Kahneman and Tversky (1984) insist that framing effect is robust property, it is not certain whether framing effect is in fact robust or not. As shown in Figure 4(a) and (b), irrespective of debiasing procedure (elaboration by requiring the respondent (participant) to explain the reason for his or her selection), framing effect (reversal of preference) was not removed properly.
Simon et. al. (2004), on the other hand, insisted that framing effect is not robust as Kahneman (2011), Tversky and Kahneman (1974), and Kahneman and Tversky (1984) insist. The elaboration (debiasing) was tried through the explanation why the respondent (participant) selected the alternative. Other elaboration (debiasing) technique such as making the respondent clearly recognize the difference of positive and negative frames might be more effective for deleting such a cognitive bias.
The debiasing of framing effect can be summarized as follows. Trapped into such a framing effect might lead to the distorted decision making, and thus the judgment of events from a specific frame. This might potentially lead to crucial accidents. Viewing events from multiple frames will be effective for preventing us from being trapped into a framing effect.
Illusion of covariation
Figure 5(a) and (b) shows that it is not so easy for us to recognize the causality (relationship between dizziness and brain tumor, or relationship between drinking habit and liver cancer) correctly, and that we suffer from cognitive biases when understanding the relationship between the cause and effect. When identifying the cause of failures or accidents, such biases are ubiquitous around us.
Failing to identify the genuine cause of failures, malfunctions, or accidents frequently induces crucial accidents such as Three Mile Island nuclear power plant accident (nuclear reactor meltdown) (Lusted, 2012 and Osif et. al., 2006). In the range of our experiment, only a brief explanation for identifying causality does not work effectively for deleting fallacy of covariation. The consistent and scientific training for identifying causality with high reliability might be effective for deleting such a bias.
Overconfidence The result in Figure 6 might show that overconfidence is deleted by probability-based representation. However, it must be noted that this debiasing measure does not lead to correct evaluation. In the range of this experiment, underconfidence appeared as a result of deleting overconfidence. According to Bazerman and Moore (2001), overconfidence leads to illusion of control, fallacy of plan, or optimistic biases. These cognitive biases potentially become the trigger of failures of business such as bankrupcy, crucial accidents or disasters. Moreover, underconfidence produces or induces passive and negative activities, leads to the insufficiency of a variety of systems, and eventually induces failures of business such as bankruptcy, crucial accidents or disasters. Future research should explore how overconfidence or undeconfidence should be deleted.
CONCLUSIONS
In conclusion, the debiasing methods presented in this study were effective to some extent for suppressing the biases (conjunction fallacy, ignorance of base rate, and regression to mean). However, for some cognitive biases (framing effect, fallacy of covariation, and overconfidence), the debiasing methods were not necessarily effective. Future research should further continue to explore whether cognitive biases such as framing effect, fallacy of covariation, and overconfidence can be deleted or not. Moreover, we must systematically investigate the mechanism how such cognitive biases are linked to the occurrence of crucial accidents.
REFERENCES
Altman, M. (2012), “Behavioral Economics for Dummies”, John Wiley & Sons Canada, Ltd. Angner, E. (2012), “A Course in Behavioral Economics”, Palgrave Macmillan. Bazerman, M.H. and Moore, D.A. (2001), “Judgment in Managerial Decision Making”, Harvard University Press. Kahneman, D. (2011), “Thinking, Fast and Slow”, Penguin Books. Kahneman, D. and Tversky, A. (1984), “Choices, Values, and Frames”, American Psychologist, Vol.34. Lusted, M.A. (2012), “The Three Mile Island Nuclear Disaster”, Essential Library. Osif, B.A., Baratta, A.J. and Conkling, T.W. (2006), “TMI 25 Years Later - The Three Mile Island Nuclear Power Plant Accident and Its Impact”, The Pennsylvania State University Press. Reason, J. (1990), “Human Error”, Cambridge University Press. Simon, A.F., Fagley, N.S. and Halleran, J.G. (2004), “Decision framing: Moderating effects of individual differences and
cognitive processing”, Journal of Behavioral Decision Making, Vol.17, pp.77-93. Tversky, A. and Kahneman, D. (1974), “Judgment under Uncertainty: Heuristics and Biases”, Science, Vol.185. Vaughan, D. (1997), “The Challenger Launch Decision: Risky Technology, Culture, and Deviance at NASA”, University of Chicago Press.
LISTED IN THE AHFE DIGITAL BOOKSTORE CATALOGUE
Explore the complete digital volume
Advances in Cross-Cultural Decision Making
Read this individual research paper free through the original publisher, or explore the full digital proceedings book.
ISBN 978-1-4951-2095-4
Explore this ISBN in the AHFE Bookstore ↗Listed in the July 2026 bookstore catalogue; search by ISBN to confirm current availability · Digital book purchase optional