Atsuo MURATA, Makoto MORIWAKA (2019). Basic Study on Prevention of Human Error-Anchoring Bias in Relationship between Objective and Subjective Probability-. In: Advances in Cross-Cultural Decision Making. AHFE Open Access, vol. 6. https://doi.org/10.54941/ahfe100184
This study empirically identified the relationship between the objective and the subjective probabilities, and confirmed whether the relationship corresponded with the hypothesized weighting function proposed in prospect theory. As a result, it was found that the experimentally identified relationship between the objective and the subjective probabilities corresponded with the hypothetical weighting function above. In other words, the estimated number of deaths was underestimated for moderate and high number of deaths, while the estimated number of deaths was overestimated for the small or rare number of deaths. Moreover, in order to examine how cognitive bias occurred in the estimation of number of deaths for a variety of deaths and accidents, it was discussed whether the different anchor biased the relationship above. The estimated numbers of deaths were remarkably affected by the anchor, and the estimated numbers of deaths for the group given the anchor A (large number of deaths) was larger than that for the group given the anchor B (small number of deaths). Some implications for risk management were given from the perspective of cognitive biases.
Our cognitive information processing is conducted by System1 or System2. While System2 requires us to conduct effortful, demanding and deliberate mental activities, System1 operates quickly, automatically, without time consuming, and intuitively with little or no efforts. Although heuristic approaches that we adopt when we have no time to deliberate are based on System1, and are very simple and intuitive, such approaches are suffering from cognitive biases. Due to bounded rationality (Kahneman, 2011, Tversky and Kahneman, 1974, Kahneman and Tversky, 1984, Altman, 2012, Angner, 2012, and Bazerman and Moore, 2001), we generally cannot make decision rationally, and thus suffer from cognitive biases. Kahneman (2011), Tversky and Kahneman (1974) and Kahneman and Tversky (1984) proposed prospect theory to explain such cognitive biases in decision making under uncertainty. In prospect theory, the weighting function of objective probability such as number of deaths per year for each cause is hypothesized so that the weight is larger for the small probability range, and the weight is smaller for the large probability range. Such a hypothesis is based on only the study by Lichtenstein et al. (1978). Thus, it should be further verified whether such a hypothesis is proper or not.
After some serious accident occurred, one tends to overestimate the occurrence probability of such an accident. For example, we hesitate to use an airplane immediately after a serious aviation accident due to the overestimation of a fatal aviation accident. This means that our psychological evaluation of probability, that is, subjective probability (Wright and Ayton, 1994), changes irrespective of the constant objective probability of airplane crash. Therefore, it is important to identify the relationship between the objective and the subjective probabilities properly.
The anchoring bias is pointed out (for example, Kahneman (2011) and Bazerman and Moore (2001)). It is predicted that the difference of the anchor easily changes the relationship between he objective and the subjective probabilities above. However, such analyses have not thoroughly conducted until now. If such a hypothesis was verified, we must be very cautious in the assessment of risks (in a sense, subjective probability). It is possible that ignoring such characteristics and improperly assessing a risk lead to crucial accidents such as the Challenger space shuttle disaster (Reason, 1990 and Vaughan, 1997).
This study empirically identified the relationship between the objective and the subjective probabilities, and confirmed whether the relationship corresponded with that found by Lichtenstein et al. (1978). Moreover, it was explored whether the different anchor biased the relationship above.
METHOD
Participants Sixty participants took part in the experiment. They were all undergraduate students at Faculty of Engineering, Okayama University.
Experimental task The participants were distributed a paper on which 21 cause of deaths in Table 1 was randomly arranged. Their task was to estimate the number of deaths for each cause. The participants were instructed to estimate the number of deaths of 2012 in Japan.
Design and Procedure The participants were equally divided into three groups. Two groups were given the cue for estimation. One group was given the cue (anchor) A for estimation. Another group was provided with the cue (anchor) B for estimation. The anchors A and B were as follows. The third group was not provided with the cue for estimation.
Anchor A: The number of deaths per year due to stroke is 121,602. Anchor B: The number of deaths per year due to flood is 35.
RESEARCH HYPOTHESIS The first hypothesis was that the estimated number of deaths was underestimated for moderate and high number of deaths, while the estimated number of deaths was overestimated for the small or rare number of deaths.
The second hypothesis was that the estimated numbers of deaths were remarkably affected by the anchor, and the estimated numbers of deaths for the group given the anchor A was larger than that for the group given the anchor B. In other words, we hypothesized that the anchor distorted the estimation of number of deaths.
RESULTS
The results of the experiment are summarized in Figure 1. In Table 1, the causes of deaths for numbers from 1 to 21 are listed. The smaller number in Table 1 shows that many numbers of deaths are induced by this cause. The larger number in Table 1 means that there are few deaths due to these causes. If the subjective probability judgments
Equations and mathematical formulas are available in the original paper PDF.
Anchor A
:Number of deaths per year due to stroke is 121,602.
4 6
AnchorB
:Number of deaths per year due to flood is 35.
2 3
10 12
13
12
2 3
10
11
14 15 16 17
18
15 13
18 21 19 20
11
21
14
17 16
20 19
0 1 2 3 4 5 6
log10(predicted number of deaths per year) log10(actual number of deaths per year)
Figure 1. Relationship between estimated (predicted) number of deaths and the actual number of death (Japanese statistical data in 2012). If the estimated and the actual number of deaths are equal, the data falls on the straight line.
Figure available in the original PDF paper.
Table 1. Correspondence between cause of death and numbers in Figure 1.
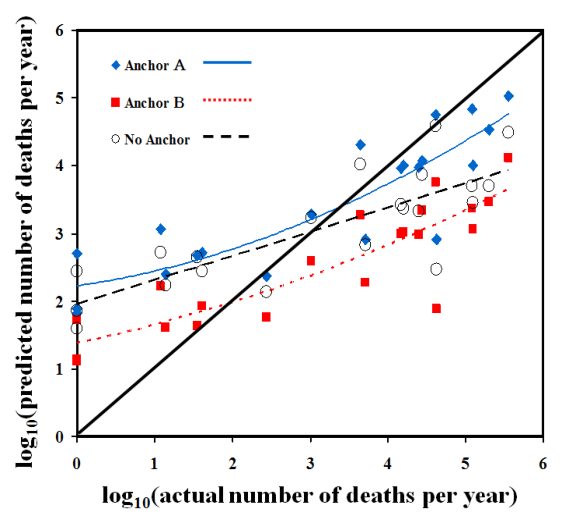
(estimations) were accurate, they would equal the statistical data (actual number of deaths for each cause). Although the data were dispersive to some extent, it tended that the rare causes whose actual numbers of deaths are small (for example, numbers 16, 17, and 18) were overestimated. Contrary to this tendency, the common causes of death (for example, numbers 1, 2, and 3) tended to be underestimated.
Next, the anchoring bias is discussed. The estimated numbers of deaths for the group given the anchor A tended to be larger than that for the group given the anchor B. Anchoring information was found to distort the subjective probability. The results are summarized in more detail in Figure 2. In Figure 2, the estimated number of deaths is compared among three conditions (Anchor A, Anchor B, and No anchor). In Figure 3, the difference between the mean actual number of deaths and the mean estimated number of deaths is compared between the underestimation and the overestimation areas in Figure 1 or Figure 2, and among three conditions (Anchor A, Anchor B, and No anchor). Here, the mean actual number of deaths corresponds to the mean of all number of deaths belonging to
Figure 2. Relationship between estimated (predicted) number of deaths and the actual number of death (Japanese statistical data in 2012) as a function of anchoring condition (Anchor A, anchor B, and No anchor).
Actual number Estimated number
log10(number of deaths per year) Overestimation
Underestimation Overestimation
Underestimation Overestimation
Underestimation
area area
area area
area area Anchor A Anchor B No anchor
Figure 3. Difference between the mean actual number of deaths and the mean estimated number of deaths compared between the underestimation and the overestimation areas, and among three conditions (Anchor A, Anchor B, and No anchor).
Figure available in the original PDF paper.
underestimation or overestimation areas. The mean predicted number of deaths corresponds to the mean of all predicted number of deaths belonging to underestimation or overestimation areas.
As for the overestimation area, a statistical t-test conducted on the number of deaths revealed significant (p<0.01) differences between actual and estimated number of deaths for all of three conditions (Anchor A, Anchor B, and No anchor). As hypothesized, the overestimation tendency was statistically verified for three conditions. As a result of carrying out a similar t-test for the underestimation area, significant (p<0.01) differences between actual and estimated number of deaths were also detected for all of three conditions.
DISCUSSION
Relationship between objective and subjective probability The probability weighting as shown in Figure 4 is generally assumed in prospect theory (Kahneman, 2011, Tversky and Kahneman, 1974 and Kahneman and Tversky, 1984), which aims at explaining cognitive biases such as reversal of preference and loss aversion in decision making under uncertainty. The probability weighting function (Wakker, 2011) in Figure 4 is given by
where p is the probability without weighting, and c is an empirically determined parameter. When c equals 1, this corresponds to the diagonal line, which means that the probability weighting (subjective probability) is equal to the objective probability. For other values of c (=0.4, 0.6, and 0.8), the probability weighting for the low objective probability is overestimated, while the probability weighting for the high objective probability is underestimated.
In prospect theory, the weighting function of objective probability such as number of deaths per year for each cause is hypothesized so that the weight is larger for the small probability range, and the weight is smaller for the large probability range. Such a hypothesis is based on only the study by Lichtenstein et al. (1978).
As shown in Figures 1 and 2, the number of deaths tended to be overestimated for the rare causes whose actual numbers of deaths are small (for example, numbers 16, 17, and 18). The number of deaths was underestimated for the common causes of death (for example, numbers 1, 2, and 3). This corresponded well with Lichtenstein et al. (1978).
Anchoring bias Anchoring is related to an adjust-and-anchoring heuristic for estimating uncertain quantities like prediction of number of deaths for a variety of accidents or diseases. The adjust-and-anchoring bias seems to stem from confirmation heuristics (Bazerman and Moore, 2001). Confirmation bias can be generally explained as follows. We tend to focus on a single possible cause of an effect, neglect alternative causes of the effect, and conclude that the association between the single cause and the effect is stronger than it actually is.
The adjustment typically ends prematurely, and leads to under- or over-estimation as shown in Figures 1 and 2. As pointed out by Lichtenstein et al. (1978), the cue A or B in this study distorted the decision. When we provide participants with a rare case (small number of deaths such as “The number of deaths per year due to flood is 35”), they tended to be affected by this number and underestimate the number of deaths for a variety of deaths or accidents. When participants were provided with a common case (large number of deaths such as “The number of deaths per year due to stroke is 121,602”), they tended to be affected by this number and overestimate the number of deaths for a variety of deaths or accidents. These tendencies are demonstrated in Figure 2. When the larger number of deaths is given as a cue, the relationship between the probability and the probability weighting (subjective probability) moved upward. When the smaller number of deaths is given as a cue, the relationship between the probability and the probability weighting (subjective probability) moved downward. The cue is regarded to function as priming. The cause of such a cognitive bias might be interpreted as follows. While we frequently encounter the rare events such as tornado or helicopter crash on TV or newspaper, we seldom encounter the common events of deaths such as strokes on TV or newspaper. This difference of availability to information between two cases causes the distortion, and moves the estimation of smaller number of deaths and larger number of deaths to the overestimation and underestimation areas, respectively.
The cue definitely affected the decision making (estimation of number of deaths), and distorted the relationship between the probability and the probability weighting (subjective probability). This means that such minor information is important enough to affect our decision making. We unexpectedly tend to overestimate the occurrence probability of an airplane accident immediately after a serious aviation accident due to the overestimation of a fatal aviation accident. This means that our psychological evaluation of probability changes irrespective of the constant objective probability of airplane crash. We must bear this in mind when evaluating risks which hide behind a variety of our activities.
w(p)
Probability
Figure 4. Typical and hypothetical probability weighting function assumed in prospect theory.
Figure available in the original PDF paper.
Therefore, it is important to identify the relationship between the objective and the subjective probabilities properly. Without this, our decision making unexpectedly suffers from cognitive bias, and is easily distorted. The basic source of cognitive biases is based on our cognitive characteristics, that is, bounded awareness. In risk management under uncertainty, we must bear such an anchoring bias in mind. We are easily biased by the anchor even when we engage in objective risk evaluation or assessment tasks such as estimating the number of deaths for a variety of accidents or diseases.
CONCLUSIONS
In conclusion, the relationship between the objective and the subjective probabilities on which prospect theory (Kahneman, 2011, Tversky and Kahneman, 1974, Kahneman and Tversky, 1984, Altman, 2012, Angner, 2012, and Bazerman and Moore, 2001) is based was empirically found to be valid. Moreover, although the relationship between the objective and the subjective probabilities mentioned above did not change, it was found that the anchoring biases easily occurred by changing the cue (anchor) in estimating numbers of deaths for each cause.
Future research should explore whether or not such a bias can be removed somehow. Moreover, we should develop a systematic method for checking cognitive biases in order to prevent crucial accidents or human errors stemming from cognitive biases.
REFERENCES
Altman, M. (2012), “Behavioral Economics for Dummies”, John Wiley & Sons Canada, Ltd. Angner, E. (2012), “A Course in Behavioral Economics”, Palgrave Macmillan. Bazerman, M. H. and Moore, D. A. (2001), “Judgment in Managerial Decision Making”, Harvard University Press. Kahneman, D. (2011), “Thinking, Fast and Slow”, Penguin Books. Kahneman, D. and Tversky, A. (1984), “Choices, Values, and Frames”, American Psychologist, Vol.34. Lichtenstein, S., Slovic, P., Fishhoff, B., Layman, M., and Combs, B. (1978), “Judgment Frequency of Lethal Events”, Journal of Experimental Psychology: Human Learning and Memory, Vol.4, pp.551-578.
Reason, J. (1990), “Human Error”, Cambridge University Press. Tversky, A. and Kahneman, D. (1974), “Judgment under Uncertainty: Heuristics and Biases”, Science, Vol.185. Vaughan, D. (1997), “The Challenger Launch Decision: Risky Technology, Culture, and Deviance at NASA”, University of Chicago Press. Wakker, P. P. (2011), “Prospect Theory for Risk and Ambiguity”, Cambridge University Press. Wright,G. and Ayton, P. (1994), “Subjective Probability”, Wiley.
LISTED IN THE AHFE DIGITAL BOOKSTORE CATALOGUE
Explore the complete digital volume
Advances in Cross-Cultural Decision Making
Read this individual research paper free through the original publisher, or explore the full digital proceedings book.
ISBN 978-1-4951-2095-4
Explore this ISBN in the AHFE Bookstore ↗Listed in the July 2026 bookstore catalogue; search by ISBN to confirm current availability · Digital book purchase optional