Atsuo MURATA, Akira NAKATSUKA, Makoto MORIWAKA (2019). Effectiveness of Back and Foot Pressures for Assessing Drowsiness of Drivers. In: Advances in Safety Management and Human Factors. AHFE Open Access, vol. 5. https://doi.org/10.54941/ahfe100154
A lot of studies on prediction or evaluation of drowsy driving are conducted using physiological measures in order to prevent traffic accidents due to drowsy driving. Although such physiological measures are to some extent useful for assessing drowsiness, there are some practical limitations such as necessity of attachment of measurement instruments to drivers. Therefore, in order to make drowsiness prediction system more practically usable, it is necessary to find behavioral measures which can be more easily measured than physiological measures. This study paid attention to the behavioral measures (the pressures on the backrest of the driving seat (back pressure) and the pressure on the soles of the foot (foot pressure)) while driving, and explored the effectiveness of these behavioral measures for predicting or evaluating drivers’ drowsiness. The behavioral measures (the back and the foot pressure) during the driving are promising and can be used effectively to evaluate and predict the drivers’ drowsiness.
There are a lot of studies on prediction or evaluation of drowsy driving in order to prevent traffic accidents due to drowsy driving (Brookhuis et. al., 1993, Kecklund et. al., 1993, Skipper et. al., 1986, Murata et. al., 2008a, Murata et. al., 2008b, Murata et. al., 2011a, Murata et. al., 2011b, Murata et. al., 2012). A lot of studies for evaluating or predicting drowsy driving are carried out on the basis of physiological parameters. Although such physiological measures are to some extent useful for assessing drowsiness, there are some practical limitations such as necessity of attachment of measurement instruments to drivers. Therefore, in order to make drowsiness prediction system more practically usable, it is necessary to search for behavioral measures which can be more easily measured than physiological measures.
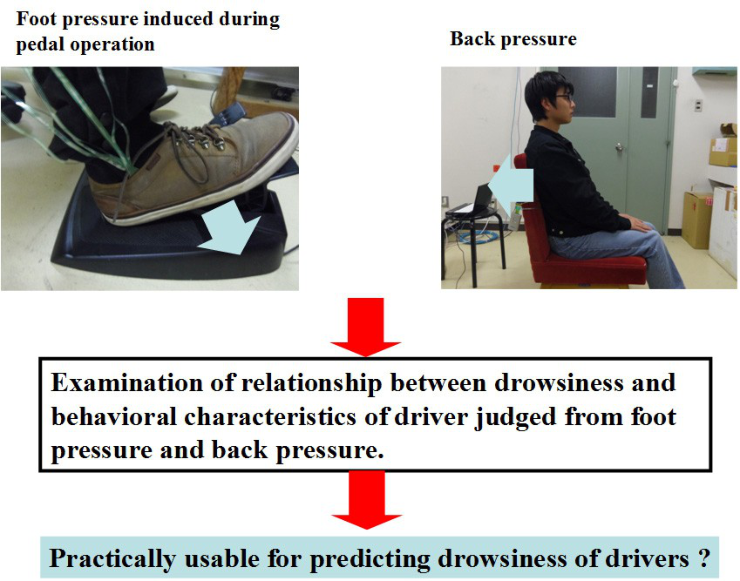
This study focused on the behavioral measures, that is, the pressures on the backrest of the driving seat (back pressure) and the pressure on the soles of the foot (foot pressure) while driving, and explored the usefulness of these behavioral measures for predicting or evaluating drivers’ drowsiness. The objective and goal of this study is summarized in Figure 1. In order to put drowsiness prediction system into practice, as mentioned above, not physiological measures but behavioral measures such as pedal operation or how the driver’s back contacts the back rest must be used. For this purpose, the examination of relationship between drowsiness and behavioral characteristics of driver judged from foot pressure and back pressure must be definitely clarified.
Figure 1. Objective and goal of this study.
METHOD
Participants Twelve male graduate or undergraduate students aged from 21 to 24 years took part in the experiment. They had a driver’s license, were all healthy, and had no orthopedic disease. All signed the document on informed consent after receiving a brief explanation of the aim and the contents of the experiment.
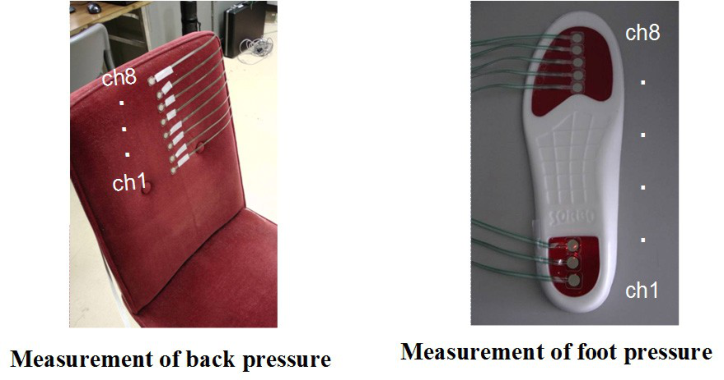
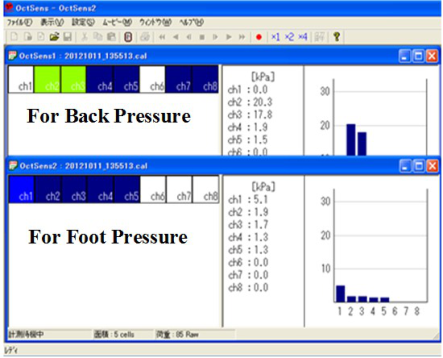
Apparatus Pressure sensors (OctSense, Nitta) were attached to the shoes insole for measuring foot pressure. Pressure sensor (OctSense, Nitta) was attached to the backrest of the driving seat for measuring back pressure (see Figure 2). In Figure 3, 8-channel OctSense and the example of measurement of back and foot pressures are depicted. In this example, the back pressures of channels 2 and 3 are higher, and the foot pressure of channel 1 is higher.
Task The experiments using a driving simulator were carried out under two conditions, that is, the condition under which the participants stayed up all night and the arousal level decreased to a larger extent and the condition under which the participants normally slept and waked up, and the arousal level did not decrease at all.
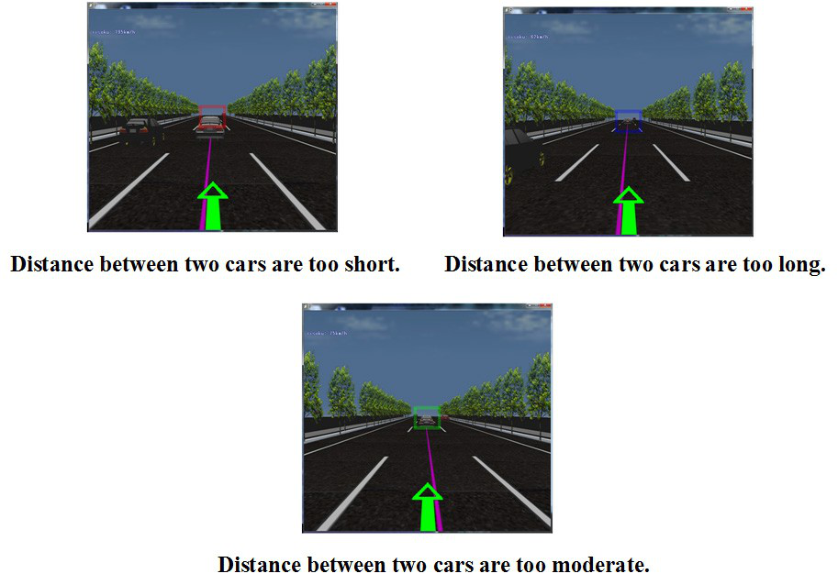
For both conditions, the participants were required to carry out a simulated driving task. The display of the driving simulator is depicted in Figure 4. The participants were required to steer a steering wheel and keep their vehicle to the center line (purple color) as much as they can. Three types of the distances between two cars are demonstrated in Figure 5. If the participant keeps the distance between two cars to a moderate level, the following car was encompassed by a green rectangle. If the distance between two cars was too short or too long, the color of the encompassed rectangle changed to red or blue color as in Figure 5.
Figure 2. Attachment of sensors for measuring both back and foot pressure.Figure 3. OctSense and display for measured results (back and foot pressure).Figure 4. Evaluation of drowsiness using the left-side buttons placed around the steering wheel.
Figure available in the original PDF paper.
Figure 5. Evaluation of drowsiness using the left-side buttons placed around the steering wheel.
Procedure For the two experimental condition, the participants were required to carry out a driving simulator task and rate own drowsiness using three categories (1: not drowsy at all, 2: a little drowsy, 3: very drowsy) while measuring the foot and the back pressures. As shown in Figure 5, using the left-side three buttons on the steering wheel, the participants were required to rate their own subjective rating on drowsiness every one minute. When the participant completely fell asleep, they could not rate their own drowsiness.
The duration during the arousal state was nearly equal for all participants. As for the condition under which the participants stayed up all night and the arousal level decreased to a larger extent, the duration of experiment differed between participants, because the time until one felt asleep differed among participants.
The outline of experimental system is depicted in Figure 6.
RESULTS
For all participants, the difference values of back pressure are compared between arousal and drowsy states in Figure 7. Similar difference values of foot pressure are compared between arousal and drowsy states in Figure 8. On the basis of these figures, it seems impossible to reach some conclusion on the relationship between the drowsiness and the back and the foot pressures. Therefore, the drowsiness of participants was redefined as follows.
The drowsy level of each participant was calculated as the ration of frequency of rating 3 (very drowsy) to the total frequency of drowsiness rating. The drowsy level of the participants C, D, E, F, G, H, and I was found to be higher than that of other participants. The differences of the back and the foot pressures for these participants are plotted in
Figure 9 and Figure 10, respectively.
PC for displaying measured foot and back pressure, and storing measured data
PC for controlling driving simulator
OctSense for measuring back pressure
Figure 6. Outline of experiment system.
Figure available in the original PDF paper.
drowsy
arousal
0.5
0.4
0.3
0.2
Back pressure
- difference kPa
0.1
0
A B C D E F G H I J K L
Participant
Figure 7. Difference of back pressure compared between arousal and drowsy states.
Figure available in the original PDF paper.
DISCUSSION
On the basis of these figures, it seems impossible to reach some conclusion on the relationship between the drowsiness and the back and the foot pressures (see Figure 7 and Figure 8). Therefore, the drowsiness of participants was redefined as follows.
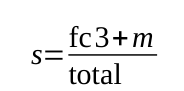
As the back pressure did not differ significantly between arousal and drowsy states, the drowsy state was more minutely categorized. For each participant, the following index, that is, the rate of drowsiness s was calculated. According to the value of rate of drowsiness, the data for participants whose rate of drowsiness ranged from 0.2 to
0.8 was shown as in Figures 9 and 10.
2.5
drowsy arousal
2
1.5
1
pressure kPa
Difference of foot
0.5
0
A B C D E F G H I J K L
Participant
Figure 8. Difference of foot pressure compared between arousal and drowsy states.
Figure available in the original PDF paper.
0.7
drowsy
0.6
arousal
0.5
0.4
0.3
0.2
pressure kPa
Difference of back
0.1
0
C D E F G H I Participant
Figure 9. Difference of back pressure for participants whose drowsy rate was higher.
Figure available in the original PDF paper.
Equation reproduced from the original PDF.
total (1) The variables fc3, m, and total represent the frequency of category 3 (very drowsy), the frequency of missing data, and frequency of subjective evaluation of drowsiness.
As described in 1.Introduction, the posture control function of drivers degrades with the accumulation of fatigue and the progress or development of drowsy state. As the participants A, B, J, K, and L did not show remarkable drowsiness (see Figures7 and 8), the back pressure did not differ significantly between arousal and drowsy states. Using only participants (seven participants) whose rate of drowsiness ranged from 0.2 to 0.8, the back pressure did not differ significantly between arousal and drowsy states. For such participants, the declined posture control function was more significantly and remarkably reflected in both foot and back pressures.
More minute classification of drowsy level led to the definite discrimination and prediction of arousal level by means of the foot and back pressures. It must be noted that the difference of foot pressure is more sensitive to the induced drowsiness than the back pressure, because there are some cases when the drowsy is not necessarily
2.5
drowsy arousal
2
1.5
1
pressure kPa
Difference of foot
0.5
0
C D E F G H I Participant
Figure 10. Difference of foot pressure for participants whose drowsy rate was higher.
Figure available in the original PDF paper.
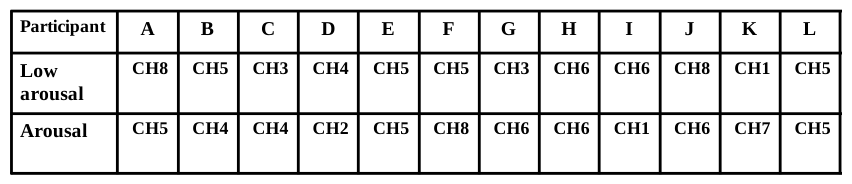
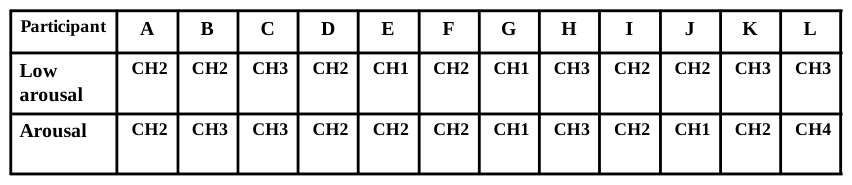
Table 1: Identification of channel which was most sensitive to the state of each participant (Back pressure).Table 2: Identification of channel which was most sensitive to the state of each participant (Foot pressure).
reflected in the back posture (the back posture does not change at all (the back body segments does not move at all) even if the driver felt drowsy to a larger extent.
As is clear from Figures 9 and 10, it can be summarized that the differences of the back and the foot pressures is effective for evaluating drowsiness when the drowsy level of participants is high and the arousal level is degraded. This must mean that the behavioral measures (the back and the foot pressure) during the driving is promising and can be used effectively to evaluate and predict the drivers’ drowsiness. In conclusion, these measures might be potential applicability for predicting drivers’ drowsiness.
As predicted, the most sensitive channel differed among participants for both foot and back pressure. Table 1 and
Table 2 show the identified most sensitive channel of each participant for the back and the foot pressures, respectively. The most sensitive channel must be automatically detected in order to put such a system to use practically in the drowsiness prediction system.
CONCLUSIONS
This study focused on the behavioral measures, that is, the pressures on the backrest of the driving seat (back pressure) and the pressure on the soles of the foot (foot pressure) while driving, and explored the usefulness of these behavioral measures for predicting or evaluating drivers’ drowsiness.
We found that there is a definite relationship between drowsiness and behavioral characteristics of driver judged from foot pressure and back pressure so long as the drowsiness of drivers are induced to some extent. On the basis of the identified relationship, this might be effectively applicable for built up the logic of drowsiness prediction. Future research should make an attempt to predict drowsiness using the identified relationship.
Although only young male adults were used as participants, the validity of this study should be verified for female participants and older adults. In particular, the verification of the obtained result for older adults is of importance, because older adults sometimes show different operational characteristics from young adults. Future research should verify the validity in a real-world driving environment, and extract problems when applying the results to the genuine driving situation. Moreover, the automatic detection technique of the most sensitive channel out of eight channels should be developed.
REFERENCES
Brookhuis, K. A. and Waard, D., (1993), “The use of psychophysiology to assess driver status”, Ergonomics, Vol.36, pp.1099- 1110 Kecklund, G. and Akersted, T., (1993), “Sleepiness in long distance truck driving: An ambulatory EEG study of night driving”,
Ergonomics, Vol.36, pp.1007-1017 Murata, A. and Hiramatsu, Y., (2008a), “Evaluation of drowsiness by HRV measures -Basic study for drowsy driver detection-”, Proceedings of IWCIA2008, pp.99-102 Murata, A., Koriyama, T. and Hayami, T., (2012), “Basic Study on the Prevention of Drowsy Driving using the Change of Neck
Bending Angle and the Sitting Pressure Distribution”, Proceedings of SICE2012, pp.274-279 Murata, A., Matsuda, Y., Moriwaka, M. and Hayami, T., (2011a), “An Attempt to predict drowsiness by Bayesian estimation”, Proceedings of SICE2011, pp.58-63 Murata, A. and Nishijima, K., (2008b), “Evaluation of Drowsiness by EEG analysis -Basic Study on ITS Development for the
Prevention of Drowsy Driving-”, Proceedings of IWCIA2008, pp.95-98 Murata, A., Ohkubo, Y., Moriwaka, M. and Hayami, T., (2011b), “Prediction of drowsiness using multivariate analysis of biological information and driving performance”, Proceedings of SICE2011, pp.52-57 Skipper, J. H. and Wierwillie, W., (1986), “Drowsy driver detection using discrimination analysis”, Human Factors, Vol.28,
pp.527-540
LISTED IN THE AHFE DIGITAL BOOKSTORE CATALOGUE
Explore the complete digital volume
Advances in Safety Management and Human Factors
Read this individual research paper free through the original publisher, or explore the full digital proceedings book.
ISBN 978-1-4951-2100-5
Explore this ISBN in the AHFE Bookstore ↗Listed in the July 2026 bookstore catalogue; search by ISBN to confirm current availability · Digital book purchase optional