Erman Cakit ª, Waldemar Karwowski (2019). Using Geographic Information Systems Analysis for Mapping Adverse Events in an Active War Theater. In: Advances in Cross-Cultural Decision Making. AHFE Open Access, vol. 6. https://doi.org/10.54941/ahfe100200
This study is a review of adverse events throughout the war in Afghanistan by representing the mapping of these events, where we considered three types of adverse events in terms of number of people killed, wounded and hijacked, and their total number in the active war theater of Afghanistan over the period 2004-2010. The country was divided into seven regions for pattern analysis, where each region has different numbers of provinces, districts, and number of records. A point-density analysis was conducted to detect those areas where a high density of data point locations was concentrated. Based on the results obtained, it was concluded that the frequency of adverse events has increased from 2004 through 2010. The south-western region had the highest mean by district values than other regions and the whole of Afghanistan for all variables. On the other side, the north-western region had the lowest mean by district values than other regions and the whole of Afghanistan for all variables. When we compared the variables against each other, the number of people hijacked had the lowest values in total and average by district than the other variables.
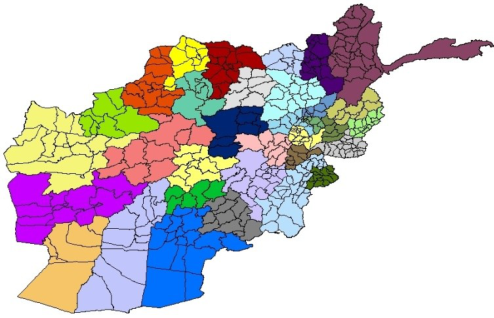
Afghanistan lies in the Central Asia and divided into 34 provinces and these provinces are subdivided into 400 districts (Figure 1). It has borders with Pakistan, Iran, Turkmenistan, Uzbekistan, Tajikistan and China. Afghanistan has 647,500 square kilometers and it is somewhat smaller than Texas, US. The population is approximately 30 million. Based on the United Nations (UN) Human Development Index, that index is calculated according to the health, education, and economic life of people, Afghanistan has been ranked 175th out of 185 members states of the UN (The 2013 Human Development Report). The Afghanistan geography does not land itself to trade, military, and operations. Therefore, this situation makes it difficult to secure the population and to improve their economic situation.
Figure 1: A map of the districts which are color grouped by province
Since terrorist attacks are not random in space and time, patterns do exist. It is possible to discover representative patterns in adverse activity or behavior over time and space by analyzing the geospatial intelligence on reported incidents, as stated by the Director of National Intelligence, Open Source Center (Federation of American Scientists, 2009). The study of spatial and temporal patterns in terrorist attacks is gaining increasing interest in the academic literature. LaFree et al. (2011) examined spatial and temporal patterns in all terrorist attacks attributed to the ETA (a Spanish separatist group) between 1970 and 2007, exploring how the approaches of terrorist groups might be related to their geospatial attack patterns over time. Berrebi and Lakdawalla (2007) considered how terrorists sought targets and focused on the spatial and temporal determinants of terrorism in Israel between 1949 and 2004. Based on the analysis, they found that space and time are necessary to describe the patterns of terrorism in Israel. Siebeneck et al. (2009) used historical data of terrorist incidents in Iraq from 2004 to 2006 to develop a series of analyses to describe terrorist activity spaces and counter-terrorist actions. This study applied clustering analysis, spatial and temporal statistics, and GIS methodologies to extract knowledge from patterns. Brown et al. (2004) focused on a specific type of event (suicide bombings) to explore difficulties in understanding and preventing terrorist attacks. They proposed a fusion model, combining spatial likelihood modeling of environmental characteristics and logistic regression modeling of demographic features, and concluded that the fusion model performs better than other methods such as kernel density estimation methods. Johnson and Braitwaite (2009) studied space-time clusters of improvised explosive device (IED) attacks and non-IED attacks in Iraq from January to June of 2005. Webb and Cutter (2009) described trends in terrorist incidents with respect to space and time in the United States spanning the years 1970 through 2004. In their paper, the authors highlighted several aspects of terrorist incidents by applying spatial statistics. In this study, we apply a geographic information systems (GIS) approach to understanding patterns of adverse events in Afghanistan.
METHODOLOGY
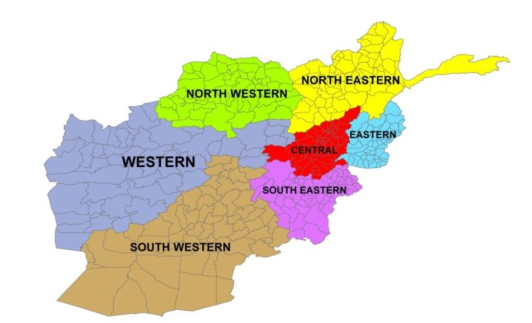
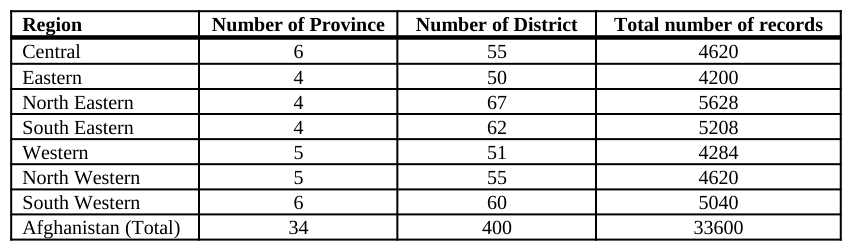
The dataset This study uses data describing adverse events in Afghanistan provided by human social culture behavior (HSCB) program management. The adverse event data included information regarding the date of the event, the number of people killed, wounded, or hijacked, as well as the city, location in latitude and longitude coordinates and a simple event summary. Afghanistan was divided into seven regions for pattern analysis, where each region has different numbers of provinces, districts, and number of records (Table 1 and Figure 2). The dataset used in this study was acquired monthly at the district level, where it was limited to incidents occurring between 2004 and 2010. The dataset was sorted based on the order of year, month, and province info. ESRI’s ArcMap ® 10.1 software was used for mapping the dataset.
Figure 2: Regions of Afghanistan
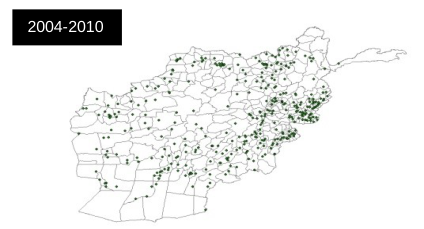
2004-2010
Figure 3: Mapping latitudes and longitudes into GIS format. The points illustrate the locations of adverse events in AfghanistanTable 1: Province and district info for each region Region Number of Province Number of District Total number of records Central 6 55 4620 Eastern 4 50 4200 North Eastern 4 67 5628 South Eastern 4 62 5208 Western 5 51 4284 North Western 5 55 4620 South Western 6 60 5040 Afghanistan (Total) 34 400 33600
Point density analysis Mapping the number of adverse events by region and population provides location-based information to elucidate and understand the hidden patterns behind the adverse events. The density function spreads out a measured quantity of an input dataset throughout a landscape to produce a continuous surface (ESRI, 2013). Density maps are useful for illustrating where point locations are concentrated. In ESRI’s ArcMap®, there are three density mapping tools including kernel density, line density, and point density. For this study, a point density analysis was conducted for the purpose of calculating a magnitude per unit area from point features that fall within a neighborhood around each cell. In other words, points that fall within the area are summed and then divided by the corresponding area size to calculate density value for each cell.
RESULTS AND DISCUSSION
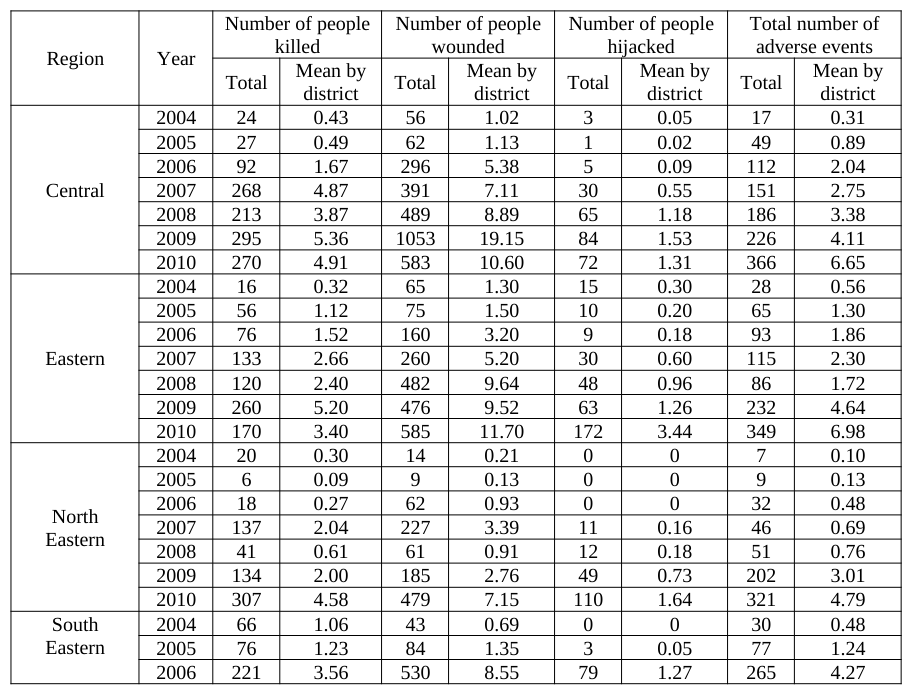
The “WITSGEO” dataset was selected for the purpose of mapping adverse events and variables in this file are represented in Figure 3. As shown in Figure 3, we considered three types of variables in terms of number of people killed, wounded, and hijacked that took place during the time period 2004 through 2010. As a first step, all of these were variables mapped into GIS format and the output of the shape file is shown in Figure 3. The output provides information about the distribution of all adverse events throughout Afghanistan. Table 2 provides information for total number of people killed, wounded, hijacked and total number of adverse events and mean number of events by district in each region took place between 2004 and 2010. Based on the information in Table 2, the number of people killed, wounded, and hijacked and the total number of adverse events were the lowest in 2004 and the highest in 2010. Between 2004 and 2010, there was an increasing trend, in general. The corresponding mean by district values varied between 0 and 30. The south-western region had the highest mean by district values than other regions and the whole of Afghanistan for all variables. On the other side, the north-western region had the lowest mean by district values than other regions and the whole of Afghanistan for all variables. When we compared the variables against each other, the number of people hijacked had the lowest values in total and average by district than the other variables.
Table 2: Yearly total and average number of events by district in each region between 2004 and 2010
4000
3000
2000
1000
0
Figure 4: Regions with total number of each variable (2004-2010)
Figure available in the original PDF paper.
Figure 4 provides information about regional differences for number of people killed, wounded, hijacked and total number of adverse events occurred during the time period 2004 through 2010. Based on Figure 4, south western region has experienced the highest number of people killed, number of people wounded, and total number of adverse events, with a total of 5583, 6233, and 2817 respectively. South eastern region had the second highest number of people killed, number of people wounded, and total number of adverse events, with a total of 2440, 3465, and 2238 respectively. For number of people hijacked, south eastern region had the highest event levels, with a total of 639 and western region had the second highest event levels, with a total of 611.
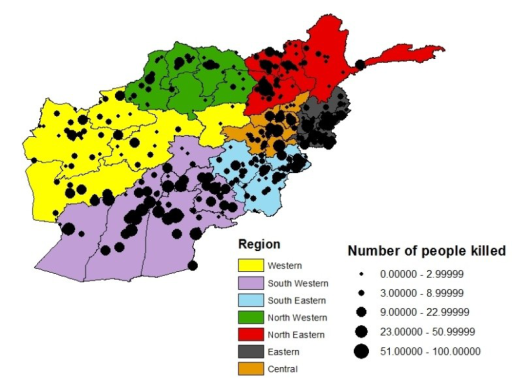
Figure 5: Number of people killed by region (2004-2010)
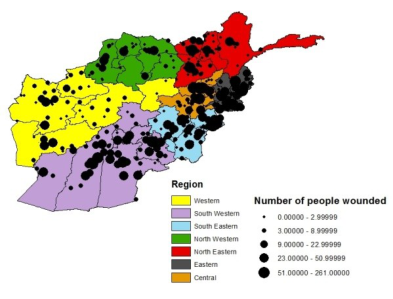
Visualizing the number of people killed, wounded, and hijacked by region reveals useful information about patterns. During the time period 2004 through 2010, most of the adverse events are concentrated in the Pakistan border along the south western, south eastern, and eastern regions (Figure 5, 6 and 7).
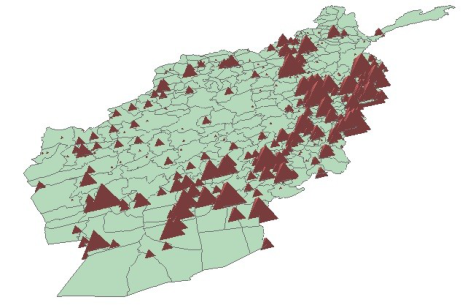
Figure 6: Number of people wounded by region (2004-2010) Figure 7: Number of people hijacked by region (2004-2010)Figure 8: Three dimensional view of total number of people killed, wounded, and hijacked density (2004-2010)
Figure 8 provides information about three dimensional intensity view of total number of people killed, wounded, and hijacked. Three dimensional view is useful to compare the number of events happened in different locations. Based on Figure 8, total number of people killed, wounded, and hijacked was cumulated mostly in south eastern of Afghanistan.
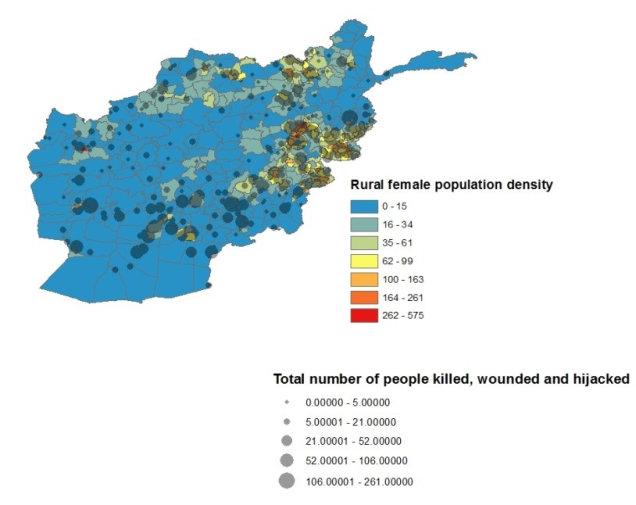
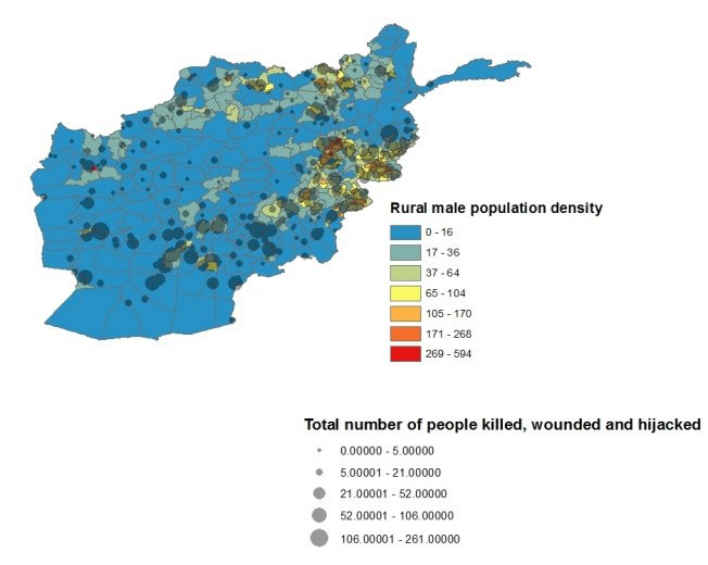
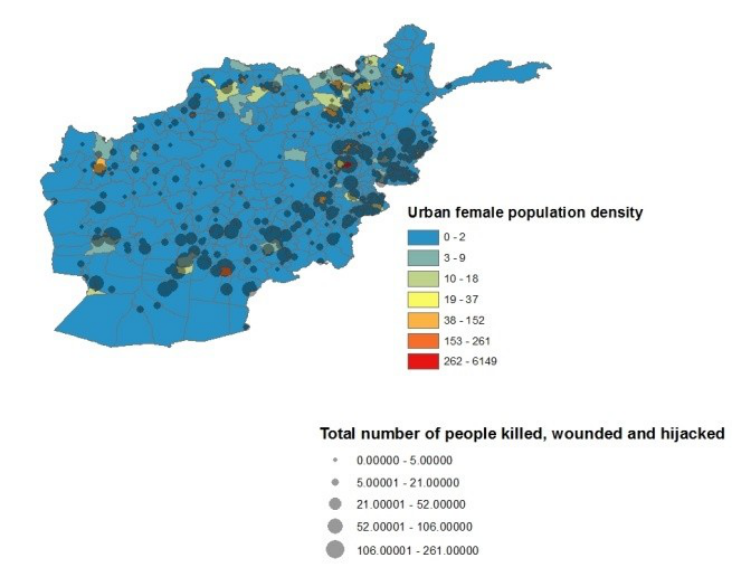
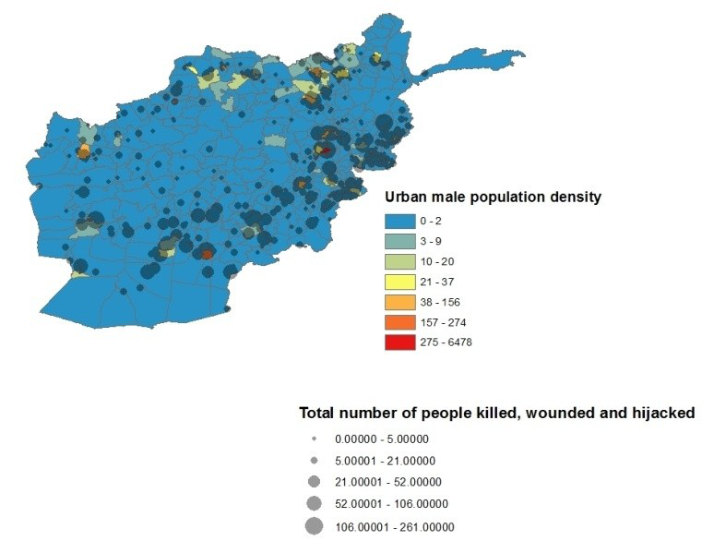
Figure 9: Mapping rural female population density with total number of people killed, wounded, and hijacked The rural female, rural male, urban female, and urban male population density was mapped with the total number of people killed, wounded, and hijacked and corresponding information is provided in Figures 9 through 12. The eastern, the northeastern, and the central regions that have a large number of people killed, wounded, and hijacked also have high rural female and male population densities. On the other hand, in addition to the northeast region, there are two high urban male and female population density areas (red colors) shown in the central and southwestern regions that have a large number of people killed, wounded, and hijacked. These areas contain major urban population centers located in Kabul and Kandahar province. These centers are two of the most convenient
locations in Afghanistan. As expected, the regions had a high number of adverse events where the population density was high.
Figure 10: Mapping rural male population density with total number of people killed, wounded, and hijackedFigure 11: Mapping urban female population density with total number of people killed, wounded, and hijackedFigure 12: Mapping urban male population density with total number of people killed, wounded, and hijacked
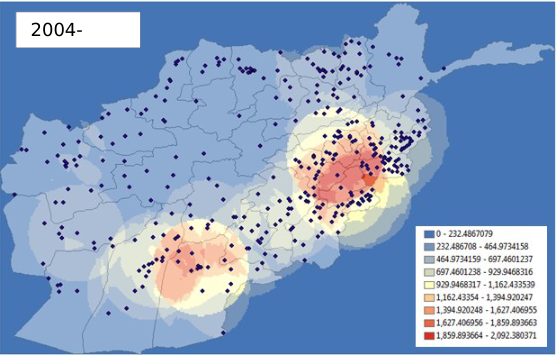
2004-
Figure 13: A point density analysis of total number of people killed, wounded, and hijacked from 2004 through 2010
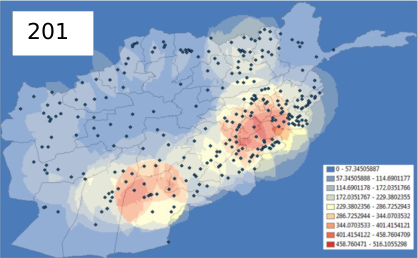
Using ESRI’s ArcMap® 10.1 software, the variable called “Total” (the sum of the “number of people hijacked”, “number of people wounded”, and “number of people killed” variables) in the “WITSGEO” event file (from 2004 through 2010) was added to the data frame. After adverse events were mapped in the ArcGIS environment, a point- density analysis was conducted to detect high adverse event density areas. The blue color represents low density and the red color shows a high-density area. A legend is provided in the right corner of each map. These numbers show the density value of the total number of people killed, wounded, and hijacked. All data during the period between 2004 and 2010 are represented and individual years that show differences between years can be observed visually (Figure 14).
200 200 200
200 200 200
201
Figure 14: A point density analysis of total number of people killed, wounded, and hijacked for each year (2004-2010)
11
CONCLUSION
This study represented the adverse event data in terms of number of people killed, wounded, and hijacked in the active war theater of Afghanistan over the period 2004-2010. The visualization of each map helps the reader for understanding implicit trends and provides new information about the adverse events represented by a dataset with over 30,000 records where the information about adverse event patterns is represented in regional level and yearly. Based on the results obtained, it was concluded that the frequency of adverse events has increased from 2004 through 2010. The number of people killed, wounded, hijacked and the total number of adverse events were at their lowest point in 2004 and at their highest point in 2010. When the regions were compared to each other, the south- western region had the highest mean by district values than other regions and the whole of Afghanistan for all variables. On the other side, the north-western region had the lowest mean by district values than other regions and the whole of Afghanistan for all variables. When we compared the variables against each other, the number of people hijacked had the lowest values in total and average by district than the other variables. As expected, the regions had a high number of adverse events where the population density was high. Understanding these patterns may provide useful information about strategies and tactics to be employed for similar scenarios in an active war theater in the future.
ACKNOWLEDGMENTS
This study was supported in part by Grant No. 1052339, Complex Systems Engineering for Rapid Computational Socio-Cultural Network Analysis, from the Office of Naval Research. The authors acknowledge the helpful guidance of ONR program management, and the contributions of the technical team.
REFERENCES
Berrebi., C, &Lakdawalla., D. (2007). How Does Terrorism Risk Vary Across Space And Time? An Analysis Based On The Israeli Experience. Defence and Peace Economics, Vol. 18(2), April, pp. 113–131. Brown, D., Dalton, J., & Hoyle, H. (2004).Spatial Forecast Methods for Terrorist Events in Urban Environments. Intelligence
and Security Informatics, 426-435. ESRI, 2013. /http://www.esri.com (accessed 08.01.13) Federation of American Scientists.(2009). ‘A GEOINT analysis of terrorism in Afghanistan.’Secrecy News. Retrieved May 3, 2012 from the World Wide Web: http://www.fas.org/blog/secrecy/2009/05/05. Johnson., S. D, & Braithwaite., E. (2009). ‘Spatio-temporal modeling of insurgency in Iraq.’ In Freilich, J. D. and Newman, G.
R. (eds), Reducing Terrorism Through Situational Crime Prevention: Crime Prevention Studies, Vol. 25. Monsey, NY: Criminal Justice Press, pp. 9–32. LaFree.,G, Dugan.,L, Xie.,M. and Piyusha Singh, P. (2012) Spatial and Temporal Patterns of Terrorist Attacks by ETA 1970 to
2007. Journal Of Quantitative CriminologyVolume 28, Number 1, 7-29. Siebeneck., L.K, Medina., R.M, Yamada.,I, &Hepner., G.F. (2009). Spatial and Temporal Analyses of Terrorist Incidents in Iraq, 2004-2006. Studies in Conflict & Terrorism, 32:591-610. The 2013 Human Development Report – "The Rise of the South: Human Progress in a Diverse World"". HDRO (Human
Development Report Office) United Nations Development Programme. pp. 144–147. Retrieved May 20 2013. Webb, J., &Cutter, S.L. (2009). The geography of U.S. terrorist incidents, 1970-2004. Terrorism & Political Violence, 21: 428-
449.
LISTED IN THE AHFE DIGITAL BOOKSTORE CATALOGUE
Explore the complete digital volume
Advances in Cross-Cultural Decision Making
Read this individual research paper free through the original publisher, or explore the full digital proceedings book.
ISBN 978-1-4951-2095-4
Explore this ISBN in the AHFE Bookstore ↗Listed in the July 2026 bookstore catalogue; search by ISBN to confirm current availability · Digital book purchase optional