Krisztian Dutka, Mate Koles, Karoly Hercegfi (2026). An experiment to explore the sensitivity of measuring mental effort by applying pupillometry and blink rate to task difficulty levels. In: Human Systems Engineering and Design (IHSED2026): Future Trends and Applications. AHFE Open Access, vol. 237, pp. 854–861. https://doi.org/10.54941/ahfe1008223
This empirical study investigates the feasibility of measuring mental effort through pupillometry and blink rate analysis, focusing on the applicability of widely used eye-tracking technology in realistic task environments. The experiment involved 48 participants, primarily university students, who interacted with a custom-developed version of the computer game Tetris in a controlled laboratory setting. The game incorporated systematically increasing difficulty levels, ranging from very easy to extremely challenging, enabling precise manipulation of cognitive load. Pupil diameter and blink rate data were collected using a Tobii T120 eye tracker to examine their relationship with mental effort.The findings show that average pupil diameter significantly correlates with task difficulty, allowing reliable differentiation between cognitive load levels. Temporal changes in mental effort were further explored through profile curves derived from moving-average pupil-size data, revealing fluctuations within individual task levels. Two neural network models were also trained on part of the dataset to evaluate predictive performance. Statistical analysis demonstrated limited but promising accuracy in predicting mental effort from previously unseen pupillometric data.In contrast, blink rate analysis yielded inconclusive results because the recording method and device were insufficient to accurately detect blink frequency and timing. Overall, the study supports the validity of pupillometry for assessing mental effort while emphasizing the strengths and limitations of current eye-tracking technologies in applied contexts. The results also highlight the importance of selecting appropriate measurement techniques and hardware configurations when applying physiological indicators of cognitive load in interactive digital environments and human-computer interaction research settings.
The aim of this study was to investigate the measurement of mental effort using pupillometric methods, with particular emphasis on the applicability of widely used eye-tracking devices during tasks modeling real-life situations. Previous studies have confirmed the relationship between mental workload and pupil diameter: increased concentration and cognitive load are associated
Received May 16, 2026 Revised June 14, 2026 Accepted June 28, 2026 Available online September 25, 2026
An Experiment to Explore the Sensitivity 855 with pupil dilation. Since the classic study by Hess and Polt (1964), numerous studies have demonstrated that increasing task difficulty is associated with increased pupil diameter, whereas sustained mental workload leads to tonic pupil dilation (Beatty and Lucero-Wagoner, 2000; Laeng and Mathot, 2024).
In this research, changes in mental effort were examined in a laboratory setting using a modified version of Tetris. Participants were required to complete progressively more difficult tasks, ranging from very easy to practically unsolvable. Pupillometric data were recorded using a Tobii T120 eye tracker and subsequently analyzed using statistical methods. The objective of the study was to determine whether changes in pupil diameter are suitable indicators of mental effort and whether neural network models can predict levels of mental workload based on previously unseen data.
The results showed that different difficulty levels could be significantly distinguished based on average pupil diameter values (De Greef et al., 2009). Profile curves generated using moving averages proved suitable for tracking momentary mental workload, while neural network models predicted levels of mental effort with significant accuracy. However, the analysis of blink rate did not provide reliable results.
METHODOLOGY
A total of 48 experimental participants were included in the study. Most participants were university students or young graduates (mean age: 23.1 years, standard deviation: 1.6). The experiments were conducted in a laboratory environment under controlled lighting conditions, typically during late afternoon hours in order to minimize circadian effects.
Pupillometric data were recorded using a professional Tobii T120 eye- tracking device, a monitor-integrated eye-tracking system with a maximum sampling rate of 120 Hz. During the experiment, pupil diameter changes of both eyes were recorded.
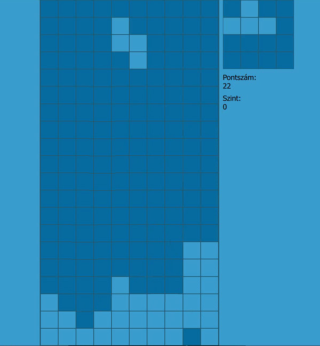
To induce mental effort, a custom-developed Tetris game was used (see Figure 1).
Figure 1: Screenshot of the screen of the Tetris as seen by the test subject.
The difficulty levels of the game were controlled by adjusting the falling speed of the blocks, ranging from very easy to nearly impossible. The measurement procedure began with an open-eye relaxation baseline, followed by one practice level and four difficulty levels. Each level lasted a maximum of three minutes. Data collection followed a standardized protocol, including eye tracker calibration, task execution, and data recording.
DATA PROCESSING For processing the pupillometric data, raw data files exported from the Tobii Studio 2.0 software associated with the Tobii T120 eye tracker were used in Microsoft Excel format. During analysis, segment identifiers, timestamps, right-eye pupil diameter data, and data validity indicators were taken into account.
The quality of the recordings was not uniform in all cases, as the eye tracker occasionally failed to record pupil diameter values at certain sampling points. The exact cause of the missing data could not be determined; however, it was presumably related to gaze deviations, brief software issues, and blinking. Data quality was therefore characterized by the proportion of available pupillometric samples relative to the total recording duration.
To facilitate further processing, the data were separated into individual files by participant and segment. Segmentation was based on the relaxation state and the four difficulty levels of the Tetris game. Task durations varied between participants because, at higher difficulty levels, several participants were unable to continue the game for the maximum duration. This was especially common at the highest difficulty level, where the game often ended prematurely due to the rapid accumulation of blocks.
RESULTS
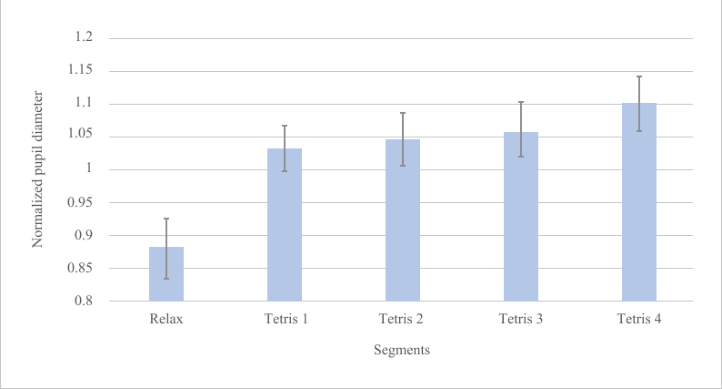
Pupil Diameter To investigate pupil diameter changes, the average pupil diameter values of each participant’s segments were normalized relative to the mean value of the entire recording session. The resulting normalized values were averaged both per participant and at the group level. As shown in Figure 2, the results revealed clear differences between the state of relaxation and the different difficulty levels of the Tetris game. The largest difference was observed between the resting condition and the most difficult Tetris level, while differences among the first three difficulty levels were smaller.
To statistically examine differences between segments, a repeated measures ANOVA was performed. Due to missing data, the analysis included 28 recordings and revealed a significant difference between segments (F(4,108) = 116.719; p < 0.001). Paired t-tests were also conducted to examine differences between the first three Tetris levels in more detail. A significant difference was found between the first and second levels, whereas the difference between the second and third levels was not statistically significant.
Figure 2: Normalized average pupil diameter by segments.
To explore the relationships between changes in pupil diameter, Pearson correlation analysis was conducted. The results indicated weak correlations between the relaxation condition and the Tetris levels (ranging from −0.098 to −0.359), whereas significant moderate-to-strong relationships were identified among the different Tetris levels (see Table 1). The strongest correlation was observed between the first and second difficulty levels (0.737**).
These findings confirmed both the distinction between the relaxation and gameplay conditions and the relationships among the different difficulty levels; however, not all difficulty levels could be significantly differentiated from one another.
Table 1: Normalized average pupil diameter by segments.
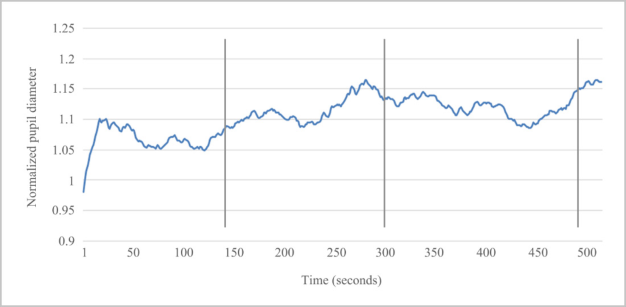
Profile Curves To examine temporal changes in pupil diameter, profile curves were generated to illustrate the dynamic changes in mental effort. To create these profile curves, the segmented data of the participants were recombined, and moving averages with one-second intervals were calculated from the original 60 Hz pupil diameter data. As shown in Figure 3, the resulting curves captured changes in mental workload across the four difficulty levels of the Tetris game.
Figure 3: Profile curve of a single participant. The vertical lines mark the three changes of difficulty levels.
The profile curves were interpretable only at the individual level because segment lengths and total task durations varied across participants. In several cases, an increase in mental workload associated with higher difficulty levels was clearly observed: at lower levels, pupil diameter tended to remain stable or decrease, whereas at more difficult levels, pupil diameter gradually increased. At the highest difficulty levels, the segments were often shortened due to rapid game termination or saturation of the game field.
The profile curves also proved suitable for identifying momentary workload fluctuations within individual levels. Increases in pupil diameter were typically associated with increased time pressure, saturation of the game field, and rapid decision-making situations. In contrast, decreases in workload often appeared when participants successfully reorganized the game field, thereby gaining additional time for subsequent actions.
The results suggest that profile curves are suitable for examining momentary changes in mental workload; however, they were not always appropriate for clearly distinguishing between different difficulty levels.
Neural Networks To investigate the prediction of mental effort, two different neural network models were applied: the Multilayer Perceptron and the Radial Basis Function network. For model training, a dataset was used in which the relaxation condition and the four Tetris difficulty levels appeared as separate segments. The training and testing ratio was set to 70–30% based on the recommendation of Marshall (2007).
According to the self-test results, the Radial Basis Function network provided more accurate estimates for several segments, whereas the Multilayer Perceptron performed better at one difficulty level. Both models had difficulties distinguishing the highest Tetris level, where their prediction accuracy proved insufficient. The models were subsequently tested on additional recordings with identical segment structures. The results showed that the relaxation state and the first Tetris level could be relatively well distinguished, whereas differences between higher difficulty levels were less recognizable.
An Experiment to Explore the Sensitivity 859 As an additional analysis, all Tetris levels were merged into a single “mental effort” category. The retrained models achieved significantly better performance, distinguishing relaxation and mental effort states with accuracy exceeding 98%. Details are shown in Table 2.
Table 2: Accuracy of trained neural networks for relaxation and aggregated mental effort states.
Table available in the original PDF paper.
Multilayer Perceptron Radial Basis Function Relax 0.6764 0.6689
Mental effort 0.9833 0.9830 Correlation analysis demonstrated significant relationships between the actual and predicted categories for both models. Details are shown in Table 3.
Table 3: Correlation between the classifications of trained neural network models and the actual segments in the case of relaxation and aggregated Tetris levels.
Table available in the original PDF paper.
Actual and predicted categories Correlation Significance
Multilayer Perceptron 0.6764 0.6689 Radial Basis Function 0.9833 0.9830
Blink Rate In this study, blink rate was determined from pupillometric data recorded by the Tobii T120 eye tracker. The method relied on the fact that during blinking, the eyelid occludes the pupil, causing the eye tracker to temporarily fail to record valid data (Holmqvist et al., 2015). Typical blink durations range from 96 to 300 ms (Bonifacci et al., 2008), corresponding to 6–18 consecutive missing data points at a 60 Hz sampling rate. Shorter or longer periods of missing data were considered measurement errors.
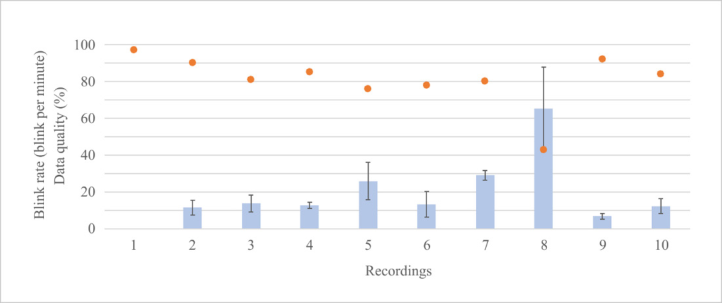
Figure 4: Blink rate and data quality.
The results showed substantial individual variability, and no clear trend emerged across the different difficulty levels. In some recordings, blink rate decreased as mental workload increased, whereas in others, different patterns were observed. Analysis of the intervals between blinks also revealed high variability. The data indicated that blink rate strongly depended on recording quality, with lower-quality recordings yielding higher, more scattered blink- rate values (see Figure 4).
These findings suggest that the eye-tracking device and the applied method were not sufficiently reliable on their own for determining mental workload based on blink rate.
CONCLUSION AND FUTURE RESEARCH The results of the study indicate that metrics derived from pupil diameter are suitable for investigating mental effort. The experiment confirmed a positive relationship between mental workload and pupil diameter, and neural network models were also capable of predicting the presence of mental effort on previously unseen data with significant accuracy. However, some methods, such as profile curve analysis and blink rate analysis, did not provide clear and reliable results.
Based on the findings, the method appears promising under laboratory conditions; however, in real-world applications, environmental factors and the lack of controllability remain significant challenges.
Potential future improvements include extending recording duration, randomizing difficulty levels, and introducing repeated baseline measurements to reduce fatigue effects. For more accurate blink detection, video-based or manual annotation methods may also be justified.
Future research may also benefit from the application of the Pupillary Unrest Index (PUI) and the Index of Cognitive Activity (ICA), which are more advanced metrics derived from pupillometric data and may enable more accurate assessment of cognitive workload.
ACKNOWLEDGMENT
The authors express their gratitude to all participants who took part in the experiment.
REFERENCES
Beatty, J., Lucero-Wagoner, B. (2000). The Pupillary System. In: Cacioppo, J. T., Tassinary, L. G., Berntson, G. G. (Eds.) (2000). Handbook of Psychophysiology. New York, NY: Cambridge University Press. Bonifacci, P., Ricciardelli, P., Lugli, L., Pellicano, A. (2008). Emotional attention:
Effects of emotion and gaze direction on overt orienting of visual attention. Cognitive Processing, Volume 9, No. 2, pp. 127–135. De Greef, T., Lafeber, H., Van Oostendorp, H., Lindenberg, J. (2009). Eye movement as indicators of mental workload to trigger adaptive automation. Lecture Notes in Computer Science, 5638 LNAI, pp. 219–228.
An Experiment to Explore the Sensitivity 861 Hess E. H., Polt, J. M. (1964). Pupil size in relation to mental activity during simple
problem solving. SCIENCE, Volume 143, pp. 1190–1192. Holmqvist, K., Nystrom, M., Andersson, R., Dewhurst, R., Jarodzka, H., van de Weijer, J. (2015). Eye Tracking: A comprehensive guide to methods and measures. Oxford, UK: Oxford University Press. Laeng, B., Mathot, S. (2024) “Methodological Aspects of Pupillometry”, in: Modern
Pupillometry, Papesh, M. H., Goldinger, S. D. (Eds.), pp. 375–400, Cham: Springer. Marshall, S. P. (2007). Identifying cognitive state from eye metrics. Aviation Space and Environmental Medicine, Volume 78, No. 5 II, pp. 165–175.
FIND THE COMPLETE VOLUME IN THE AHFE DIGITAL BOOKSTORE
Explore the complete digital volume
Human Systems Engineering and Design (IHSED2026): Future Trends and Applications
Read this individual research paper free through the original publisher, or explore the full digital proceedings book.