Tianmei Zhang, Ziyi Yang (2026). Information Completeness and Visual Form Differentially Modulate Emotional Experience During Mobile Interface Loading. In: Human-Computer Interaction & Emerging Technologies. AHFE Open Access, vol. 233, pp. 260–269. https://doi.org/10.54941/ahfe1007525
Waiting during mobile interface loading is unavoidable and often induces negative emotional responses. Visual feedback design plays a critical role in shaping perceived waiting experience. This study investigates how feedback information format and progress indicator shape influence emotional responses during mobile loading. A two-stage mixed-method design was employed. Study 1 (N = 221) identified preferred design constraints, revealing user preference for centrally positioned feedback and flat visual style. Study 2 (N = 8) implemented a 3 × 3 repeated-measures experiment manipulating information format (text, numeric, text + numeric) and indicator shape (bar, circular, cartoon). Subjective evaluations were combined with EEG time–frequency analysis (ERSP) across theta, alpha, beta, and gamma bands. Behavioral results showed that feedback containing numeric progress significantly improved perceived clarity and reduced subjective waiting time. Indicator shape primarily influenced affective experience, with cartoon-style indicators associated with higher enjoyment ratings. EEG analyses revealed significant main effects of interface condition and frequency band, as well as a Condition × FrequencyBand interaction, indicating frequency-specific neural modulation patterns. Interfaces with more complete information elicited relatively stronger modulation in beta and gamma bands. These findings demonstrate that information completeness and visual form differentially regulate cognitive and affective processes during loading, providing neurophysiological evidence for optimizing emotional experience in mobile interface design.
With the widespread adoption of mobile Internet technologies, mobile applications have become a primary medium through which users access information and services. During interaction, loading delays are often unavoidable and represent a critical moment that can substantially shape user experience (Li and Chen, 2019). Prior research has demonstrated that waiting time influences not only task efficiency but also users’ emotional responses, satisfaction, and overall system evaluation (Liikkanen and Gómez, 2013; Antonides et al., 2002).
Information Completeness and Visual Form Differentially Modulate Emotional 261 When users receive insufficient or ambiguous feedback during loading, they are more likely to experience anxiety, uncertainty, and reduced perceived control, which can negatively affect overall interaction quality (Bouch et al., 2000; Hohenstein et al., 2016). Consequently, the design of visual feedback during waiting periods has emerged as an important topic in human– computer interaction research.
Although substantial work has examined interface aesthetics and layout structures, systematic empirical investigations focusing specifically on dynamic loading feedback remain relatively limited. Existing studies suggest that progress indicators and feedback mechanisms serve not only as status displays but also as cognitive and affective regulators during waiting (Hurter et al., 2011). Furthermore, foundational work in human–computer interaction indicates that information presentation format and visual form can differentially influence attentional allocation, cognitive processing, and emotional responses (Sears and Jacko, 2008). In mobile loading contexts, subtle variations in feedback design may therefore produce measurable differences in both perceived waiting experience and underlying neural processes (Li and Chen, 2019).
Against this background, the present study systematically examines how feedback information format and progress indicator shape influence users’ emotional experience during mobile interface loading. By integrating subjective evaluations with EEG time–frequency analysis, this research aims to uncover both behavioral effects and their associated neural modulation patterns.
Specifically, the study addresses the following research questions: RQ1: What feedback position and visual style do users prefer in mobile
loading interfaces? RQ2: Do different feedback information formats and indicator shapes influence emotional experience and perceived waiting time? RQ3: Which feedback combination achieves a balance between emotional
stability and cognitive clarity?
METHOD
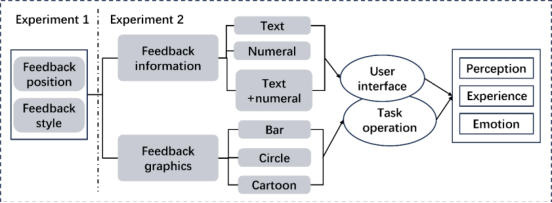
Research Design A two-stage mixed-method design was adopted (Fig. 1), integrating subjective reports and physiological measures to evaluate loading feedback design.
Figure 1: Overview of the two-stage mixed-method research design.
A total of 253 responses were collected online. After age screening (18–36 years), 221 valid responses remained. Participants evaluated preferences for feedback position (top/center/bottom) and visual style (minimal line/flat 2D/3D) under a simulated loading scenario. Results indicated that ~70% of respondents actively attended to loading feedback, and showed clear preference for center position and flat 2D style, which were fixed in Study 2 to control confounds.
Study 2: Controlled Experiment A 3 (information completeness: text / numeric / text+numeric) × 3 (visual form: bar / circular / cartoon) within-subject design produced nine loading interfaces (Marker01–Marker09). Each condition was presented for 10 s to control objective waiting time.
IV1: Information completeness IV2: Visual form of progress indicator DVs: perceived waiting time and multidimensional subjective experience; EEG ERSP measures Participants
Study 1 included 221 mobile users aged 18–36. Study 2 recruited eight healthy adults (4 male, 4 female; mean age 25) who were regular mobile app users and reported no history of neurological disorders. Participants provided informed consent prior to participation, and the procedure followed basic ethical standards.
MATERIALS AND MEASURES Stimuli
Interfaces were prototyped in ProtoPie and presented on a smartphone. Marker01–03 used bar indicators, Marker04–06 circular indicators, and Marker07–09 cartoon indicators. Text feedback displayed “Loading…”, numeric feedback displayed “60%”, and the mixed format displayed “Loading…60%”. Background, color palette, and layout remained constant; only information completeness and visual form were manipulated.
Subjective Measures Subjective evaluations were conducted using seven-point Likert scales assessing perceived waiting time, satisfaction, anxiety, enjoyment, clarity, attractiveness, and acceptability. The questionnaire items were adapted from established user experience and affect measurement instruments, including the Positive and Negative Affect Schedule (PANAS) (Watson et al., 1988) and the User Experience Questionnaire (UEQ) (Laugwitz et al., 2008), with wording modified to fit the mobile loading context.
Information Completeness and Visual Form Differentially Modulate Emotional 263 EEG Measures
EEG signals were recorded using an EMOTIV EPOC Flex wireless EEG system with 32 channels. Data were sampled at 128 Hz. The reference electrodes were positioned on the bilateral earlobes. Electrode contact quality was monitored in real time using EmotivPRO software, and all channels were maintained in the “good” range (green indicator) before and during recording.
Raw EEG data were preprocessed offline following a standard pipeline. First, channel locations were verified and non-relevant channels were removed if necessary. Data were band-pass filtered between 0.1 and 50 Hz to remove slow drifts and high-frequency noise. Independent Component Analysis (ICA) was applied to identify and remove ocular artifacts (e.g., eye blinks). The continuous data were then segmented according to the loading stimulus duration, and baseline correction was performed relative to the pre-stimulus period.
Event-related spectral perturbation (ERSP) analysis was conducted to quantify time–frequency power changes across theta (4–8 Hz), alpha (8–12 Hz), beta (12–32 Hz), and gamma (32–45 Hz) bands during the waiting phase.
Procedure The experiment took place in a quiet indoor room. After EEG setup, participants viewed the nine loading interfaces in a randomized order to control order effects. Each interface was presented for 10 s; participants were instructed to observe the loading feedback without performing additional tasks. After each condition, participants completed the subjective ratings. The session lasted approximately 30–40 minutes.
Data Analysis Subjective ratings were analyzed using repeated-measures ANOVA to test main and interaction effects of information completeness and visual form. For EEG, mean ERSP values were computed for each frequency band and condition; a two-way ANOVA tested effects of interface condition and frequency band. Significance level was set to α = .05.
RESULTS
Study 1: Preferred Position and Visual Style Among 221 valid responses, ~70% of participants reported actively monitoring loading feedback during mobile use. The center position received the highest preference and was fixed in Study 2 to reduce spatial confounds. Flat 2D style was preferred over minimal line and 3D styles and was therefore adopted across Study 2 stimuli.
Study 2: Subjective Results Subjective ratings provided behavioral evidence complementing EEG results. Internal consistency was high (Cronbach’s α=.891). To avoid redundancy, we report effects most relevant to the research questions; full ANOVA results are summarized in Table 1.
Table 1: Summary of repeated-measures ANOVA across seven subjective measures.
Table available in the original PDF paper.
Equation reproduced from the original PDF.
Hoc Comparisons Perceived Waiting Time Information Format 28.228 < .001 .801 Text > Numeric; Text > Mixed
Clarity Information Format 15.758 < .001 .692 Text < Numeric; Text < Mixed Enjoyment Indicator Shape 9.855 .002 .585 Bar < Cartoon
Attractiveness Information Format 5.724 .015 .450 Text < Numeric Satisfaction Information Format 3.409 .067 .328 Text < Mixed
Anxiety Information Format 2.414 .067 .256 Text > Numeric Acceptability Information Format 3.091 .077 .306 Text < Mixed
Note. All interaction effects were non-significant (ps > .10) and are therefore not reported.
Cognition-Related Measures: Perceived Waiting Time and Clarity Information completeness significantly affected perceived waiting time, F(2,14) = 28.228, p < .001, ηp² = .801. Post hoc tests showed that text- only feedback produced longer perceived waiting time than numeric-only and mixed formats. No significant main effect of visual form or interaction was observed.
Clarity also showed a significant main effect of information completeness, F(2,14) = 15.758, p < .001, ηp² = .692. The mixed format received the highest clarity ratings (M = 6.38, SD = 0.84), significantly exceeding text- only; numeric-only was also higher than text-only. Visual form and the interaction were not significant.
Affect-Related Measures: Enjoyment and Attractiveness Enjoyment was significantly influenced by visual form, F(2,14) = 9.855, p = .002, ηp² = .585. Cartoon indicators were rated more enjoyable than bar indicators (p = .032), with a marginal tendency relative to circular indicators (p = .056). Information completeness was not significant.
Attractiveness showed a significant main effect of information completeness, F(2,14) = 5.724, p = .015, ηp² = .450, where numeric-only and mixed formats were rated higher than text-only. Visual form did not reach significance.
Satisfaction, anxiety, and acceptability showed marginal trends for information completeness (ps≈.067–.077) but did not reach α = .05. Overall, behavioral data suggest that information completeness robustly improves cognition-related experience (clarity and perceived time), whereas visual form primarily shapes affective impressions (enjoyment).
EEG Results ERSP analysis was conducted for theta, alpha, beta, and gamma bands across the nine interface conditions.
Information Completeness and Visual Form Differentially Modulate Emotional 265 Overall Effects
Two-way ANOVA revealed significant effects of Condition (df = 8; F = 5.387, p < .001), FrequencyBand (df = 3; F = 193.002, p < .001), and a significant Condition × FrequencyBand interaction (df = 24; F = 1.546, p = .043) (Table 2). This indicates that spectral modulation differed across designs and varied by frequency band, consistent with frequency-specific neural responses during waiting.
Table 2: Two-way anova results for interface condition and frequency band on ERSP.
Table available in the original PDF paper.
Source df SS (Type III) MS F Partial η² p Condition 8 94.527 11.816 5.387 .005 < .001
Frequency Band 3 1270.058 423.353 193.002 .059 < .001 Condition × Frequency Band 24 81.394 3.391 1.546 .004 .043
Mean ERSP Patterns
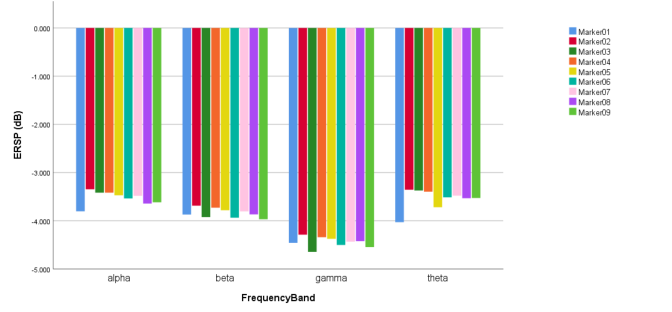
Figure 2 shows mean ERSP values across conditions and bands. All bands exhibited negative ERSP values during waiting, with theta approximately −2 to −3 dB and gamma approximately −3.5 to −5 dB. Differences across conditions were most evident in beta and gamma bands. Specifically, mixed- format interfaces tended to show stronger modulation in beta/gamma under bar and circular indicators (e.g., Marker03 and Marker06). Under cartoon indicators, alpha/theta modulation was comparatively attenuated, while the mixed cartoon condition (Marker09) still showed clear beta/gamma modulation.
Figure 2: Mean ERSP across nine conditions and four frequency bands.
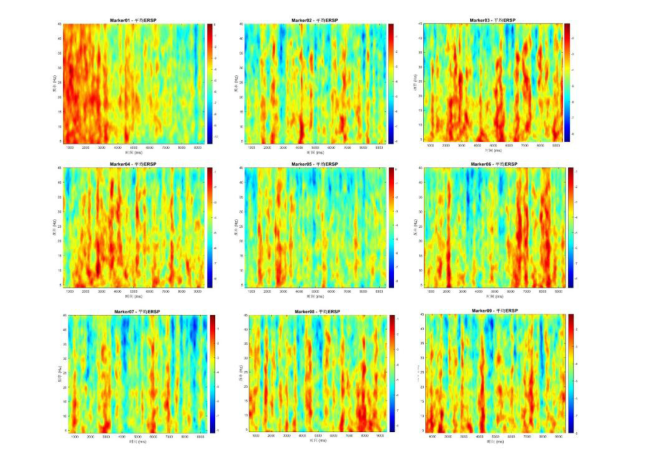
Time–Frequency Dynamics Time–frequency maps (Fig. 3) illustrate distinct temporal patterns across designs. Text-only bar feedback showed more prominent early theta enhancement, whereas mixed text+numeric bar feedback showed lower theta activity and more continuous beta distribution. Circular indicators showed
266 Zhang and Yang comparatively elevated alpha activity, with the mixed circular condition presenting a more stable pattern characterized by lower theta and sustained beta. Cartoon indicators showed more prominent mid-to-high frequency activity; the mixed cartoon condition combined relatively low theta with sustained beta modulation.
Figure 3: Time–frequency maps.
Overall, the EEG results provide converging evidence that loading feedback designs elicit frequency-specific modulation patterns, as supported by the significant Condition × FrequencyBand interaction.
DISCUSSION
This study examined how information completeness and visual form of loading feedback shape user experience during mobile interface loading, integrating behavioral ratings and EEG ERSP evidence. The findings support two complementary pathways: information-driven cognitive regulation and form-driven affective modulation.
Information Completeness and Cognitive Regulation Behavioral results showed robust benefits of providing numeric progress: perceived clarity increased and perceived waiting time decreased. This pattern is consistent with the idea that quantifiable progress information improves predictability and reduces ambiguity during waiting.
EEG results align with this behavioral pattern. Mixed text+numeric designs (e.g., Marker03/Marker06) tended to show stronger modulation in beta and gamma bands, suggesting increased engagement with progress information during the waiting phase. Importantly, while subjective ratings did not show
Information Completeness and Visual Form Differentially Modulate Emotional 267 strong interactions between information completeness and visual form, EEG revealed a significant Condition × FrequencyBand interaction, implying that design effects can emerge as frequency-specific physiological differences even when behavioral interactions are weak.
Visual Form and Affective Modulation Visual form primarily influenced enjoyment, with cartoon indicators rated as more enjoyable than bar indicators. EEG patterns also differed by visual form: cartoon conditions exhibited relatively attenuated alpha/theta modulation and more prominent mid-to-high frequency activity, indicating that expressive visual forms can alter the spectral response structure during waiting.
Within the cartoon category, mixed information (Marker09) maintained sustained beta modulation while keeping theta relatively low, suggesting that expressive visual forms and information completeness may jointly contribute to regulating waiting experience rather than acting as substitutes.
Integrating Behavioral and EEG Evidence Behavioral ratings reflect aggregated subjective judgments, whereas EEG captures dynamic modulation during the waiting phase. The complementarity between these measures—robust behavioral effects for cognition-related outcomes and frequency-specific EEG differences—provides a more comprehensive account of how loading feedback shapes experience.
Design Implications The present findings provide several actionable implications for mobile interface design, particularly in contexts involving unavoidable loading delays.
First, information completeness appears to play a central role in cognitive regulation during waiting. Interfaces that include numeric progress information significantly improved perceived clarity and reduced subjective waiting time. Designers should therefore prioritize explicit progress indicators when transparency and perceived control are critical, such as in task-oriented or performance-sensitive applications. Providing quantifiable progress cues may enhance users’ predictability of system status and stabilize waiting-related cognition.
Second, visual form primarily influences affective impressions. Cartoon- style indicators were associated with higher enjoyment ratings, suggesting that emotionally expressive visual elements can soften the negative affect typically induced by waiting. Such forms may be especially suitable for entertainment-oriented or leisure applications, where emotional engagement is prioritized over efficiency.
Third, circular indicators demonstrated relatively balanced modulation patterns across cognitive and affective measures, indicating their potential as a neutral or stable design choice. In scenarios where both clarity and emotional stability are desired, combining circular progress indicators with mixed (text + numeric) information formats may offer a robust solution.
268 Zhang and Yang Importantly, loading feedback should not be treated as a purely functional status display. Instead, it functions as a micro-interaction capable of regulating cognitive appraisal and affective response. The integration of explicit progress information with carefully selected visual form can therefore serve as a strategic design tool for shaping waiting experience.
Contributions and Limitations This study advances research on waiting experience in mobile interface design by integrating behavioral evaluation with neurophysiological evidence. By employing EEG time–frequency analysis, the findings demonstrate that loading feedback design induces frequency-specific neural modulation patterns, indicating that interface elements influence not only perceived experience but also underlying cognitive–affective processes during waiting.
The results further distinguish the roles of information completeness and visual form. Information format primarily influenced cognition-related outcomes such as perceived waiting time and clarity, whereas visual form predominantly shaped affective impressions, particularly enjoyment. This differentiation provides a more refined framework for understanding how micro-interaction design elements regulate waiting experience across psychological dimensions.
Several limitations should be noted. The EEG experiment involved a relatively small sample, which may limit statistical power and generalizability. The loading duration was fixed at 10 seconds to control experimental variance, whereas real-world loading scenarios vary considerably. Additionally, only a limited range of feedback formats and visual forms was examined. Future research with larger samples, varied waiting durations, and broader design manipulations would further strengthen the robustness and ecological validity of these findings.
CONCLUSION
This study investigated how information completeness and visual form of loading feedback influence emotional experience and neural activity during mobile interface loading. A two-stage mixed-method design showed that users prefer centrally positioned, flat 2D feedback. In a controlled 3×3 within- subject experiment, providing numeric progress robustly improved clarity and reduced perceived waiting time, indicating a cognition-related benefit of information completeness. Visual form primarily affected affective impressions, with cartoon indicators associated with higher enjoyment. EEG ERSP analysis revealed significant effects of condition and frequency band and a Condition × FrequencyBand interaction, indicating frequency-specific modulation patterns, particularly in beta and gamma bands for more complete information.
Overall, the findings suggest that information completeness and visual form exert differential yet complementary influences during loading, providing behavioral and neurophysiological evidence for optimizing emotional experience in mobile interface design.
ACKNOWLEDGMENT
This research was supported by the National Social Science Fund of China Youth Project [Grant Number 25CKX049].
REFERENCES
Antonides, G., Verhoef, P.C., van Aalst, M. (2002). Consumer perception and evaluation of waiting time: a field experiment. Journal of Consumer Psychology, 12, 193–202. Bouch, A., Kuchinsky, A., Bhatti, N. (2000). Quality is in the eye of the beholder:
meeting users’ requirements for Internet quality of service. In: Proceedings of the SIGCHI Conference on Human Factors in Computing Systems. pp. 297–304. New York: ACM. Hohenstein, J., Khan, H., Canfield, K., Tung, S., Cano, R.P. (2016). Shorter wait times: the effects of various loading screens on perceived performance. In: Proceedings of the 2016 CHI Conference Extended Abstracts on Human Factors in Computing Systems. pp. 3084–3090. New York: ACM. Hurter, C., Girouard, A., Riche, N., Plaisant, C. (2011). Active progress bars:
facilitating the switch to temporary activities. In: CHI’11 Extended Abstracts on Human Factors in Computing Systems. pp. 1963–1968. New York: ACM. Laugwitz, B., Schrepp, M., Held, T. (2008) Construction and evaluation of a user experience questionnaire. In: Holzinger, A. (ed.) USAB 2008, LNCS 5298, pp. 63–76. Springer. Li, S., Chen, C.H. (2019). The effects of visual feedback designs on long wait time of
mobile application user interface. Interacting with Computers, 31(1), 1–12. Liikkanen, L.A., Gómez, P.G. (2013). Designing interactive systems for the experience of time. In: Proceedings of the 6th International Conference on Designing Pleasurable Products and Interfaces. pp. 146–155. New York: ACM. Sears, A., Jacko, J.A. (2008). The Human–Computer Interaction Handbook:
Fundamentals, Evolving Technologies and Emerging Applications. Mahwah, NJ: Lawrence Erlbaum Associates. Watson, D., Clark, L.A., Tellegen, A. (1988) Development and validation of brief measures of positive and negative affect: The PANAS scales. Journal of Personality and Social Psychology, 54(6), 1063–1070.
Read this individual research paper free through the original publisher, or explore the full digital proceedings book.
ISBN 979-8-950676-09-3
Explore this ISBN in the AHFE Bookstore ↗Listed in the July 2026 bookstore catalogue; search by ISBN to confirm current availability · Digital book purchase optional