Pramath Kakodkar, Nooshin Shekari, Jay Kalra, Tareq Ahram (2026). Modular Organ Aging Framework in the Real World: Cost, Frequency, Equity, and a Patient-Facing Calculator. In: Healthcare and Medical Devices. AHFE Open Access, vol. 211, pp. 53–67. https://doi.org/10.54941/ahfe1007468
1 Department of Pathology and Laboratory Medicine, Saskatoon, SK, Canada; Royal University Hospital, Saskatchewan Health Authority, 103 Hospital Drive Saskatoon, SK S7N 0W8, Canada ↗
2 Department of Anatomy, Physiology, and Pharmacology, University of Saskatchewan, Saskatoon, SK, Canada ↗
3 Systems Engineering and Analytics Research, Orlando, 32826 Florida, USA ↗
Chronological age reflects time since birth, whereas biological ageing captures heterogeneous decline across cells, tissues, and organs. Composite biological age integrates biomarkers across organ systems, yet a feasibility-first pathway to translate organ-age theory into real-world monitoring and communication remains lacking. We present an implementation-oriented toolkit that classifies candidate biomarkers across cardiovascular, neurologic, pulmonary, renal, hepatic, musculoskeletal, immune, endocrine, and integumentary domains into functional ageing tests (e.g., grip strength, gait speed, reaction time, sleep architecture) and physiological markers (e.g., MRI-based brain volume, IGF-1, cystatin C). To enhance interpretability, we introduce a fast- versus slow-ageing organ framework based on deviations from age-referenced norms. Crucially, all measures are organized into feasibility tiers: Tier 0 (low-cost, at-home tests), Tier 1 (routine, low-cost laboratory tests), Tier 2 (specialist-administered assessments), and Tier 3 (send-out or referral laboratory tests). We summarize accessibility, cost, recommended testing intervals, expected biological drift to reduce over-interpretation, and population-specific reference ranges. The proposed application enables individuals to input routine laboratory and functional data to visualize organ-specific trajectories and composite biological age for self-tracking and research purposes only, supported by human factors such as clear design principles and explicit clinical disclaimers.
The process of aging can be analysed by evaluating the cumulative burden of physiological decline acquired across each organ in the human body (Rutledge et al., 2022). Before delving into this area of ageing research, it is essential to clarify core definitions. Chronological age is defined as the numerical value from birth, whereas the biological age is the true value of the age reflected by the cumulative molecular and functional deterioration within individuals (Moqri et al., 2023). Compared with chronological age, the assessment of the biological Received February 10, 2026; Revised April 5, 2026; Accepted April 19, 2026; Available online July 20, 2026
age offers greater clinical and research utility as this all-encompassing metric harmonizes the heterogeneity across multiple organ systems to better benchmark functional capacity and predict mortality.
In our prior work evaluating organ-specific biomarkers to assess biological aging (Kakodkar et al., 2025), we proposed a preliminary framework to estimate composite biological age which allows for identification for optimizable organ domains for intervention or monitoring. An ongoing barrier to clinical translation is that most organ-age proposals do not sufficiently specify the finer details on these biomarkers in a non-pathological state, testing frequency, expected range for biological and analytic variability, economic and access equitable implementation, and how these results should be communicated to patients within scope. This study addresses these practical gaps and will create a patient-facing app which is designed for self- tracking and research rather than diagnosis or treatment.
It is important to note that most composite biological age outputs collapse heterogeneous organ trajectories into a single summary value, which can obscure domain-specific patterns that are more actionable for monitoring and communications. To make this interpretation intuitive, we introduce the concept of fast- versus slow-aging organs. In this iteration of our framework, an organ is considered “fast-aging” when its domain-specific functional tests and/or physiologic markers deviate adversely beyond the expected range for a given chronological age. Conversely, an organ is considered “slow-aging” when these same measures are relatively preserved compared with chronological reference age range. These labels are intended as communication primitives: they highlight organ “hotspots” of significant acceleration or relative resilience and support hypothesis generation, triaging monitoring, and identifying modifiable targets. Notably, fast- versus slow-aging classification is best supported by trends over time rather than a single datapoint.
The review integrates scientific rationale with practical implementation considerations for our previously proposed modular organ-specific aging model. We emphasize test feasibility constraints such as cost, access, testing frequency, and guardrails to prevent over-interpretation of trivial fluctuations. We also incorporate human factors and user experience principles, including clear visuals, consistent units, user customization levels, reference ranges, and plain language, alongside prominent disclaimers that results are intended for self-tracking and research purposes and that interpretation and any clinically indicated follow-up should be determined by a licensed physician.
This manuscript is intentionally positioned as a feasibility-first, pre- implementation contribution. Prior to meaningful user evaluation or clinical validation of any interface, a conceptual framework must be established to define measurement parameters, determine appropriate testing frequency in the context of drift and variability, and specify communication strategies to minimize misinterpretation. Accordingly, a synthesis-driven toolkit and an evaluation roadmap are presented to assess whether the proposed presentation choices enhance interpretation accuracy and reduce false ‘fast-ageing’ classifications resulting from transient fluctuations.
Modular Organ Aging Framework in the Real World 55 FROM THEORY TO IMPLEMENTATION: PRACTICALITIES FOR REAL- WORLD ORGAN-AGE TOOLKIT
The feasibility-first organ-age framework aims to provide more granular detail beyond the basic nomination of interesting candidate biomarkers. The ideal outcome is the recommendation of tests that have defined measurements that can be obtained repeatedly, interpreted consistently against validated age-anchored ranges, and relayed safely across clinical and non-clinical settings with heterogeneous access. We therefore utilize the following design principles to facilitate with test selection, tiering categorization, scoring, and presentation of organ-age inputs.
Prioritizing Measures Obtainable in Routine Care, With Tiered Escalation for Higher-Resolution Phenotyping The core test selection for the organ age assessment toolkit is anchored in tests that can be easily performed at home or are widely available as laboratory tests for primary care or outpatient workflows. Therefore, these routine-access tests are designated under tier 0-1 and include common labs and clinically standard measures such as estimated glomerular filtration rate (eGFR (CKD-EPI)), cystatin C, high-sensitivity C-Reactive Protein (hsCRP), Alanine Aminotransferase (ALT), Gamma-Glutamyl Transferase (GGT), and Insulin-like Growth Factor 1 (IGF-1), alongside low-burden functional measures such as grip strength, continuous press-ups, or unipedal stance test (eyes closed). Furthermore, highly specialized or costly tests remain important, but are presented as ancillary rather than prerequisites. These specialty-access tests are designated under tier 2-3 and includes tests such as pulse wave velocity (PWV), VO2 max testing, spirometry (FEV1), DEXA lean mass, FibroScan, MRI-based brain volumetry, plasma Neurofilament Light Chain (NfL), and T-cell senescence flow markers. This tiered designation preserves deployability while still enabling high-resolution phenotyping when feasible.
Ensure That Biomarker Candidates are Calibrated Against a Defined Reference Baseline and Have a Clear Clinical Interpretation for Any Directional Change Selected biomarker candidates must possess an explicit relationship with organ-specific aging that can be explained in layman language. For example, an increase in PWV, cystatin C, hsCRP, and NfL generally reflect biological decline or accelerated ageing. Conversely, decrease in VO2 max, FEV1, grip strength, and DEXA lean mass reflect reduced functional reserve. Notably, directionality can be non-linear or clinically nuanced. For instance, liver enzymes like ALT which may initially increase with inflammation and metabolic stress but can paradoxically decrease in end-stage cirrhosis due to loss of hepatocytes. The framework proposed will explicitly state these known confounders to avoid overconfident labelling.
To maintain transparent, each measure is anchored to age-referenced percentile norms, allowing clinicians and users to evaluate the deviation of a biomarker from its expected chronological age baseline. Therefore, the outputs will rely on validated reference models that account for pertinent population factors such as sex and ethnicity.
Propose Testing Frequency by Accounting for Cost-Effectiveness, as Well as Analytic and Biological Variability Real-world implementation for aging biomarker panel requires guardrails against background noise. Many of the candidate biomarkers fluctuate due to physiological factors such as infection, sleep disruption, strenuous exercise, fluid status, in addition to standard analytic assay variability. Therefore, this framework cautions against over-interpreting isolated results without considering the expected variability and subsequent retesting intervals. For instance, High-sensitivity C-reactive protein (hs-CRP) blood test can show transient inflammatory spikes that may indicates chronic inflammation and assesses cardiovascular disease risk (heart attacks, strokes). Digit Symbol Substitution Test (DSST) is susceptible to practice effects, VO2 max is rapidly modifiable with deliberate training, are spirometry is pervious to technique and effort. Contrastingly, test such as DEXA and MRI are highly stable but cost-prohibitive and impractical for high-frequency testing. Defining the optimal testing frequency is vital for accurately longitudinal trajectories and designating organ phenotype as “fast-aging” or “slow-aging”.
Communicate Outputs Safely and Interpretably Through Human Factors, Flagging Uncertainty, and Clear Disclaimers This framework is intended to facilitate self-tracking and research communication, not to provide clinical diagnoses. Therefore, results must be presented using consistent units, established clinical reference ranges, and layman language interpretations. Uncertainty should be flagged to highlight variability labels, confidence intervals in longitudinal trending, and warning for insufficient reference data. Notably, the reporting outputs should prioritize functional interpretability, utilizing visual tools such as organ-specific dashboards, data trending rather than opaque composite numbers. Lastly, prominent disclaimers will explicitly state that only a licensed physician can clinically interpret the results and determine if a personalized, organ-specific plan is warranted.
MODULAR DOMAINS AND FUNCTIONAL VS. PHYSIOLOGIC BIOMARKERS Advancing our previous publication, we focused on nine critical domains for our toolkit; cardiovascular, neurologic, pulmonary, renal, hepatic, musculoskeletal, immune, endocrine, and integumentary. Various tests evaluating each of these domains can be classified into a two-class taxonomy that separates them based on functionality or physiology. This distinction
Modular Organ Aging Framework in the Real World 57 optimizes interpretability for both clinicians and users by explicitly indicating deviation resulting in reduced functional reserve (grip strength, DSST/reaction time, balance, VO2max, FEV1) versus altered organ’s physiologic integrity (PWV, cystatin C, eGFR, hsCRP, ALT/GGT, FibroScan stiffness, IGF-1, dermal elasticity, MRI-based brain volume, blood NfL, immune senescence flow markers). To operationalize translation, each test is assigned into a pragmatic Tier 0–3 feasibility scale. Tier 0 consists of home/self-admin functional tests requiring minimal equipment such as press-ups, sit-rise etc. Tier 1 includes routinely accessible lab tests such as eGFR, cystatin C, hsCRP etc. Tier 2 includes specialty outpatient testing that is available at a tertiary center such as a comprehensive pulmonary function test, DEXA lean mass, FibroScan etc. Tier 3 includes advanced imaging or reference center specialized assays such as MRI volumetric analyses, plasma NfL, T-cell senescence phenotyping etc. Table 1 summarizes the high and moderate level tests in the Tier 0-1 feasibility scale. Table 2 summarizes the high and moderate level tests in the Tier 2-3 feasibility scale. Variability levels (low/medium/high) in Tables 1-2 indicate the expected degree of fluctuation on a shorter time frame due to analytic and biological sources. The practical take away in interpreting these variability levels is to calibrate how strongly an isolated measurements represent a true value (low variability), or whether repeat confirmation is required in probable cases (medium variability), or in tentative cases (high variability). These translates to how much caution must be attributed before labelling any organ as fast/slow aging.
Table 1: Overview of Tier 0-1 aging biomarkers by domain. Summary of testing frequency, estimated costs, and test cautions and considerations for assessing physiological and functional decline.
$0 Trend over ≥2–3 measurements; same conditions /time-of-day. Standardize cadence (80 bpm metronome). Stopping criteria must be strict (form breakdown).
Monthly [Medium]
(Brito et al., 2014) [Medium]
Functional Sit-rise test [MSK] (0)
$0 Trend over ≥2–3 measurements; same conditions /time-of-day. Scoring is 0–10. Subtract 1 point for every support (hand/knee) used. Validated largely in 50+ cohort.
Monthly [Medium]
(Mayorga- Vega et al., 2014) [High]
Functional Sit-and-reach [MSK] (0)
$0 Trend over ≥2–3 measurements; same conditions /time-of-day. Highly dependent on warm-up status. Always test after light activity, never “cold.”
$0 Trend over ≥2–3 measurements; same conditions/time-of-day. “Eyes Closed” is more age-sensitive. Ensure safety (spotter) for older adults.
Functional Unipedal stance test with eyes closed [MSK/ Neuro] (0) Monthly [Medium]
(Talboom et al., 2021) [High]
Functional Visual Reaction time [MSK/Neuro] (0)
$0 Avoid comparing early practice attempts; use average of 3 trials. Modifiers: Sex (males faster), education (higher = faster), and smoking status (slower) significantly affect the age slope. Use the same device to avoid hardware latency.
1–3 months [Medium]
Functional Grip strength [MSK] (0)
$0 Same hand / position; average 3 squeezes. Strongest single functional mortality predictor. Adjust grip width to hand size.
(Roman-Liu et al., 2024; Wang et al., 2018) [High]
3–6 months [Low]
(Li et al., 2014) [High]
Functional Waist-to-hip ratio [CV] (0)
$0 Use same tape method; focus on long-term trend. Superior to BMI for CV risk. Measure at narrowest waist and widest hip. Cutoffs in this study are specific to Han Chinese adults. Optimal targets may shift slightly for other ethnicities.
3–6 months [Medium]
$0 Susceptible to practice effect: Use alternate symbol keys if testing frequently. Score sensitive to anxiety.
Functional DSST [Neuro] (0)
(Erdodi et al., 2017; Shaaban et al., 2023) [Moderate] $5–$10 Hydration / acute illness affects;
6-12 months [Medium]
(Astley et al., 2025; Waas et al., 2021) [High]
Physiologic eGFR (CKD- EPI) [Renal] (1)
confirm persistent change. CKD- EPI based eGFR has less utility in extremes of muscles mass such as bodybuilders / athletes / amputees.
$5–$10 Avoid interpreting after strenuous exercise/illness; repeat before labelling
Physiologic ALT [Hepatic] (1)
6–12 months [Medium- High]
(Le Couteur et al., 2010; Najmy et al., 2019) [Moderate] $5–$10 Avoid interpreting after strenuous exercise/illness; repeat before labelling
Physiologic GGT [Hepatic] (1)
6–12 months [Medium- High]
(Long et al., 2014; Praetorius Björk & Johansson, 2018) [Moderate]
12 months [Medium] $40– $60
Physiologic IGF-1 [Endocrine] (1)
(Conover & Oxvig, 2025; Stojanovic et al., 2021) [High]
Assay differences and nutrition status; interpret as trend not single value. U-Shaped Risk stratification as low levels is seen in frailty and high levels is seen in cancer risk.
Cardiovascular (CV), musculoskeletal (MSK), high sensitivity C reactive protein (hsCRP), Alanine Aminotransferase (ALT), Gamma-Glutamyl Transferase (GGT), Insulin-Like Growth Factor-1 (IGF-1), Digit Symbol Substitution Test (DSST)
Table 2: Overview of Tier 2-3 aging biomarkers by domain. Summary of testing frequency estimated costs, and test cautions and considerations for assessing physiological and functional decline.
PWV is blood pressure (BP) dependent. Hypertension artificially increases PWV. Must measure BP simultaneously to interpret true vessel stiffness.
(Díaz et al., 2014; Vieira- da-Silva et al., 2025) [High]
$150– $300
6–12 months [High]
Functional VO2 Max [CV] (2)
(Hawkins & Wiswell, 2003; Kaminsky et al., 2015; Mandsager et al., 2018) [High]
VO2 max is effort dependent. Accurate assessment requires plateau in oxygen uptake. Non- standardized platforms have sub- max tests (GPS watches or cycling bikes) have 10–15% error margins.
This test is technique sensitive and requires “full blast” effort and 3 acceptable maneuvers are required. GLI equations for ethnicity adjustments must be incorporated.
$200– $400
12–24 months [Medium]
Physiologic FibroScan [Hepatic] (2)
(Colombo et al., 2011; Selman & Pardo, 2021; Sharma et al., 2023) [Moderate]
Fasting is required as this would prevent increase in liver stiffness. Additionally, Body mass index (BMI) >30 may require adequately sized probe for valid reading.
$100– $250
(Kirk et al., 2021) [High]
12–24 months [Low]
Physiologic DEXA lean mass [MSK] (2)
Dehydration can falsely lower lean mass readings. Scan must be performed at the same time of day and ideally the same hydration state.
12 months [Medium]
$100– $250
(Everett & Sommers, 2013; Ryu et al., 2008) [Moderate]
Face and Arm skin viscoelasticity vary distinctly. Additional variables such as temperature, room humidity need to be accounted for as they effect skin viscoelasticity.
$700– $1,500
24–36 months [Low]
Physiologic MRI based Brain Volume [Neuro] (3)
Different scanners (1.5T vs 3T) yield different volumes. T1 weighted MPRAGE sequence may provide the optimal resolution for longitudinal tracking.
(Bethlehem et al., 2022; Cumplido- Mayoral et al., 2025; Fujita et al., 2023) [High]
12 months [High]
$250– $450
Concussion or head trauma causes massive spikes. The larger the BMI the higher the clearance of NfL
(Simrén et al., 2022; Sukhonpanich et al., 2025) [High]
Acute viral infection (influenza or CMV reactivation) can alter CD8 subpopulations. Wait 4 weeks post convalescence.
(Chang et al., 2024; Terekhova et al., 2023) [Moderate]
Physiologic T-Cell Senescence Markers [Immune] (3) Cardiovascular (CV), Volume of Oxygen (VO2), Magnetic Resonance Imaging (MRI), Forced Expiratory Volume in 1 Second (FEV1), Respiratory (Resp), Global Positioning System (GPS), Tesla (T), Magnetization Prepared Rapid Gradient Echo (MPRAGE), Musculoskeletal (MSK), Global Lung Function Initiative (GLI), Dual-energy X-ray absorptiometry (DEXA), Cytomegalovirus (CMV)
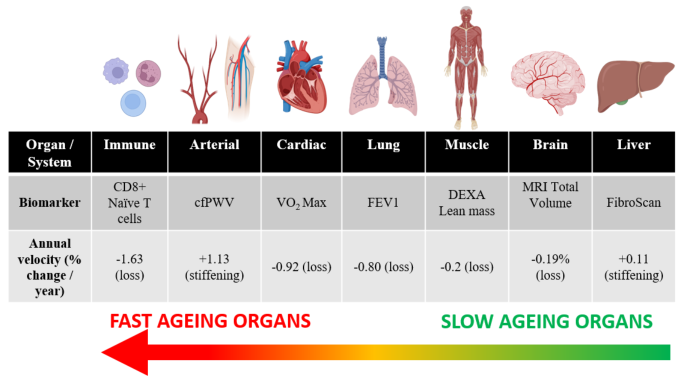
MODEL IMPLEMENTATION Tables 1–2 data were sorted by whether tests can be measured at home (Tier 0), require routine laboratory access (Tier 1), specialist outpatient testing (Tier 2), and referred out testing (Tier 3). In this framework, Tier 0–1 forms our basic core panel suitable for longitudinal trending due to the equitable access, while Tier 2–3 measures can be utilized selectively for fine modular refinement. Testing frequency is linked to expected actionable biological drift and assay/test variability. The economical Tier 0 functional tests can be repeated in frequent intervals and should be interpreted using moving averages. Conversely, most Tier 1 lab tests are better utilized at 6–12-month intervals in healthy individuals, with repeat testing as needed when results are suspected to be uninterpretable due to confounding variables. Notably, clinicians must consider the test’s variability labels, as they serve as a practical decision gate. The low-variability tests support stronger inference from a single large deviation, while the medium- or high-variability tests require trending for interpretation before designating them as fast or slow labels. As illustrated in Figure 1, physiological systems exhibit distinct aging velocities, with immune reserves and arterial compliance declining rapidly (>1.0% per year) while organ structure remains largely preserved until late life.
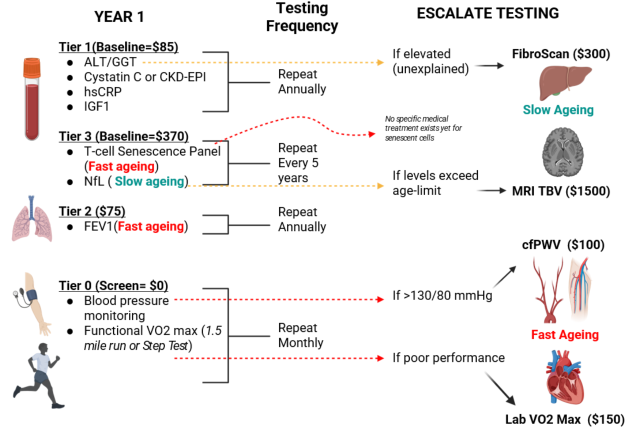
Figure 1: Aging velocity by organ system. Comparison of annualized decay rates across physiological systems reveals distinct “Fast Aging” (Immune, Arterial, Respiratory) and “Slow Aging” (Muscle, Brain Structure, Liver) trajectories. Source: Annual organ velocity was calculated from published age-stratified reference values (Tables 1–2 and references therein) and will be implemented in the MyOrganAge application. Original figure created using BioRender.com.Figure 2: Resource-optimized aging surveillance. This protocol significantly reduces 5-year monitoring costs by replacing routine advanced diagnostics with a “screen- and-confirm” logic. Expensive modalities (MRI, FibroScan, VO2 Max) are deployed only when distinct physiological signals indicate accelerated decay. Source: Based on unit costs and testing frequencies in Tables 1–2 (institutional estimates). Original figure created using BioRender.com.
Based on the aging velocity, test variability, cost, and tier type, we suggest a strategic 5-Year Testing Plan. Since functional decline precedes clinical physiological decline, it is therefore prudent that all tier 0 functional tests that have no cost burden be performed at least monthly. Figure 2 outlines a proposed lean testing plan for our modular organ ageing monitoring framework.
AGEING APPLICATION WITH HUMAN FACTOR SAFEGUARDS Building on our model, we outlined a user-facing application (app) concept that is intended for self-tracking and downstream research communication. This app is not intended for clinical diagnosis or treatment. In this app, users manually enter the results of their Tier 0 functional tests and their Tier 1 lab tests. Additionally, Tiers 2–3 results can be supplemented to generate an organ-domain dashboard correlated to the corresponding age-matched cohort, interpreted as conservative fast/slow labels with guardrails for variability and repeat-confirmation rules. Lastly, a longitudinal trajectory for many of these tiered tests will facilitate structured communication and triage, enabling monitoring to identify domains that merit repeat testing while avoiding optimization recommendations without clinician oversight.
Human factors and user experience on this app remain central to safe translation of these biomarker findings. Firstly, outputs will be consistently reported in standardized units to avoid mixing reporting conventions. Secondly, each metric remains paired with the corresponding age-matched reference percentiles, represented by an intuitive visual cue (typical red-amber-green shading), so users interpret deviations relative to the literature rather than as
Modular Organ Aging Framework in the Real World 63 an absolute “good/bad” number. Thirdly, for each test, lab variability will be highlighted (low/medium/high), and warnings about known confounders, as shown in Tables 1-2. Lastly, the reporting language will be plain, non-alarmist jargon, brief explanations, and avoiding any diagnostic labels. To mitigate misinterpretation, the app interface highlights prominent disclaimers that the results are not diagnostic and that only a licensed physician should determine whether clinical follow-up is indicated. The app incorporates behavioral guardrails to reduce false signals such as requiring triplicates for reaction time test, encouraging consistent testing conditions, and defaulting to trend displays rather than emphasizing single values.
The planned evaluation will determine whether the proposed interface guardrails, including variability labeling, trend-first displays, and screen-and- confirm escalation, enhance user interpretation. In a controlled task study, both lay users and clinicians will interpret standardized dashboards with and without these design elements. Primary outcomes will include interpretation accuracy, defined as correctly identifying fast or slow domains, error rates such as false alarms caused by single high variability datapoints, time to interpretation, and confidence calibration. This evaluation represents the immediate next step before broader clinical deployment.
Disclaimer: The undergoing research progress and development along with the application “MyOrganAge” it describes, is the proprietary property of researchers.
REFERENCES
Astley, M. E., Chesnaye, N. C., Hallan, S., Gambaro, G., Ortiz, A., Carrero, J.-J., Ebert, N., Eriksen, B. O., Faucon, A.-L., Ferraro, P. M., Indridason, O. S., Ittermann, T., Jonsson, A. J., Rise Langlo, K. A., Melsom, T., Schaeffner, E., Stracke, S., Stel, V. S., & Jager, K. J. (2025). Age- and sex-specific reference values of estimated glomerular filtration rate for European adults. Kidney International, 107(6), 1076–1087. https://doi.org/10.1016/j.kint.2025.02.025 Bethlehem, R. A. I., Seidlitz, J., White, S. R., Vogel, J. W., Anderson, K. M., Adamson,
C., Adler, S., Alexopoulos, G. S., Anagnostou, E., Areces-Gonzalez, A., Astle, D. E., Auyeung, B., Ayub, M., Bae, J., Ball, G., Baron-Cohen, S., Beare, R., Bedford, S. A., Benegal, V., … Alexander-Bloch, A. F. (2022). Brain charts for the human lifespan. Nature, 604(7906), 525–533. https://doi.org/10.1038/s41586-022-04554-y Brito, L. B. B. de, Ricardo, D. R., Araújo, D. S. M. S. de, Ramos, P. S., Myers, J., & Araújo, C. G. S. de. (2014). Ability to sit and rise from the floor as a predictor of all-cause mortality. European Journal of Preventive Cardiology, 21(7), 892–898. https://doi.org/10.1177/2047487312471759 Chang, S.-T., Chuang, Y.-F., Li, A.-H., Fan, Y.-T., Liao, M.-R., Chen, I.-Y., Hung,
R.-W., Yang, T. O., & Chiu, Y.-L. (2024). Age-dependent immune profile in healthy individuals: An original study, systematic review and meta-analysis. Immunity & Ageing, 21(1), 75. https://doi.org/10.1186/s12979-024-00480-x Colombo, S., Belloli, L., Zaccanelli, M., Badia, E., Jamoletti, C., Buonocore, M., & Del Poggio, P. (2011). Normal liver stiffness and its determinants in healthy blood donors. Digestive and Liver Disease, 43(3), 231–236. https://doi.org/10.1016/j. dld.2010.07.008 Conover, C. A., & Oxvig, C. (2025). The IGF System and Aging. Endocrine Reviews,
46(2), 214–223. https://doi.org/10.1210/endrev/bnae029 Cumplido-Mayoral, I., Sánchez-Benavides, G., Vilor-Tejedor, N., López-Martos, D., Brugulat-Serrat, A., Milà-Alomà, M., Falcon, C., Cacciaglia, R., Minguillón, C., Fauria, K., Kollmorgen, G., Quijano-Rubio, C., Molinuevo, J. L., Grau-Rivera, O., Suárez-Calvet, M., Vilaplana, V., Gispert, J. D., on behalf of the ALFA, & the ADNI study. (2025). Neuroimaging-derived biological brain age and its associations with glial reactivity and synaptic dysfunction cerebrospinal fluid biomarkers. Molecular Psychiatry, 30(8), 3718–3728. https://doi.org/10.1038/ s41380-025-02961-x Díaz, A., Galli, C., Tringler, M., Ramírez, A., & Cabrera Fischer, E. I. (2014).
Reference values of pulse wave velocity in healthy people from an urban and rural argentinean population. International Journal of Hypertension, 2014, 653239. https://doi.org/10.1155/2014/653239 Erdodi, L. A., Abeare, C. A., Lichtenstein, J. D., Tyson, B. T., Kucharski, B., Zuccato, B. G., & Roth, R. M. (2017). Wechsler Adult Intelligence Scale-Fourth Edition (WAIS-IV) processing speed scores as measures of noncredible responding: The third generation of embedded performance validity indicators. Psychological Assessment, 29(2), 148–157. https://doi.org/10.1037/pas0000319 Everett, J. S., & Sommers, M. S. (2013). Skin viscoelasticity: Physiologic mechanisms,
measurement issues, and application to nursing science. Biological Research for Nursing, 15(3), 338–346. https://doi.org/10.1177/1099800411434151 Fujita, S., Mori, S., Onda, K., Hanaoka, S., Nomura, Y., Nakao, T., Yoshikawa, T., Takao, H., Hayashi, N., & Abe, O. (2023). Characterization of Brain Volume Changes in Aging Individuals With Normal Cognition Using Serial Magnetic Resonance Imaging. JAMA Network Open, 6(6), e2318153. https://doi. org/10.1001/jamanetworkopen.2023.18153
Modular Organ Aging Framework in the Real World 65 Gabin, J. M., Saltvedt, I., Tambs, K., & Holmen, J. (2018). The association of high
sensitivity C-reactive protein and incident Alzheimer disease in patients 60 years and older: The HUNT study, Norway. Immunity & Ageing : I & A, 15, 4. https:// doi.org/10.1186/s12979-017-0106-3 Groesbeck, D., Köttgen, A., Parekh, R., Selvin, E., Schwartz, G. J., Coresh, J., & Furth, S. (2008). Age, gender, and race effects on cystatin C levels in US adolescents. Clinical Journal of the American Society of Nephrology : CJASN, 3(6), 1777– 1785. https://doi.org/10.2215/CJN.00840208 Hawkins, S., & Wiswell, R. (2003). Rate and mechanism of maximal oxygen
consumption decline with aging: Implications for exercise training. Sports Medicine (Auckland, N.Z.), 33(12), 877–888. https://doi.org/10.2165/00007256- 200333120-00002 Kakodkar, P., Shekari, N., & Kalra, J. (2025). Organ-Specific Biomarkers of Aging: An Innovative Framework for Biological Age Assessment. AHFE HAWAII International Conference (AHFE HAWAII 2025). https://doi.org/10.54941/ ahfe1006967 Kaminsky, L. A., Arena, R., & Myers, J. (2015). Reference Standards for
Cardiorespiratory Fitness Measured With Cardiopulmonary Exercise Testing: Data From the Fitness Registry and the Importance of Exercise National Database. Mayo Clinic Proceedings, 90(11), 1515–1523. https://doi.org/10.1016/j. mayocp.2015.07.026 Kirk, B., Bani Hassan, E., Brennan-Olsen, S., Vogrin, S., Bird, S., Zanker, J., Phu, S., Meerkin, J. D., Heymsfield, S. B., & Duque, G. (2021). Body composition reference ranges in community-dwelling adults using dual-energy X-ray absorptiometry: The Australian Body Composition (ABC) Study. Journal of Cachexia, Sarcopenia and Muscle, 12(4), 880–890. https://doi.org/10.1002/jcsm.12712 Le Couteur, D. G., Blyth, F. M., Creasey, H. M., Handelsman, D. J., Naganathan,
V., Sambrook, P. N., Seibel, M. J., Waite, L. M., & Cumming, R. G. (2010). The association of alanine transaminase with aging, frailty, and mortality. The Journals of Gerontology. Series A, Biological Sciences and Medical Sciences, 65(7), 712– 717. https://doi.org/10.1093/gerona/glq082 Li, S.-S., Pan, S., Ma, Y.-T., Yang, Y.-N., Ma, X., Li, X.-M., Fu, Z.-Y., Xie, X., Liu, F., Chen, Y., Chen, B.-D., Yu, Z.-X., He, C.-H., Zheng, Y.-Y., Abudukeremu, N., Abuzhalihan, J., & Wang, Y.-T. (2014). Optimal cutoff of the waist-to-hip ratio for detecting cardiovascular risk factors among Han adults in Xinjiang. BMC Cardiovascular Disorders, 14, 93. https://doi.org/10.1186/1471-2261-14-93 Long, Y., Zeng, F., Shi, J., Tian, H., & Chen, T. (2014). Gamma-glutamyltransferase
predicts increased risk of mortality: A systematic review and meta-analysis of prospective observational studies. Free Radical Research, 48(6), 716–728. https:// doi.org/10.3109/10715762.2014.902055 Mandsager, K., Harb, S., Cremer, P., Phelan, D., Nissen, S. E., & Jaber, W. (2018).
Association of Cardiorespiratory Fitness With Long-term Mortality Among Adults Undergoing Exercise Treadmill Testing. JAMA Network Open, 1(6), e183605. https://doi.org/10.1001/jamanetworkopen.2018.3605 Mayorga-Vega, D., Merino-Marban, R., & Viciana, J. (2014). Criterion-Related Validity of Sit-and-Reach Tests for Estimating Hamstring and Lumbar Extensibility: A Meta-Analysis. Journal of Sports Science & Medicine, 13(1), 1–14. Moqri, M., Herzog, C., Poganik, J. R., Justice, J., Belsky, D. W., Higgins-Chen,
A., Moskalev, A., Fuellen, G., Cohen, A. A., Bautmans, I., Widschwendter, M., Ding, J., Fleming, A., Mannick, J., Han, J.-D. J., Zhavoronkov, A., Barzilai, N., Kaeberlein, M., Cummings, S., … Gladyshev, V. N. (2023). Biomarkers of aging for the identification and evaluation of longevity interventions. Cell, 186(18), 3758–3775. https://doi.org/10.1016/j.cell.2023.08.003
Najmy, S., Duseja, A., Pal, A., Sachdev, S., Sharma, R. R., Marwah, N., & Chawla, Y. (2019). Redefining the Normal Values of Serum Aminotransferases in Healthy Indian Males. Journal of Clinical and Experimental Hepatology, 9(2), 191–199. https://doi.org/10.1016/j.jceh.2018.06.003 Praetorius Björk, M., & Johansson, B. (2018). Gamma-Glutamyltransferase (GGT)
as a biomarker of cognitive decline at the end of life: Contrasting age and time to death trajectories. International Psychogeriatrics, 30(7), 981–990. https://doi. org/10.1017/S1041610217002393 Quanjer, P. H., Stanojevic, S., Cole, T. J., Baur, X., Hall, G. L., Culver, B. H., Enright, P. L., Hankinson, J. L., Ip, M. S. M., Zheng, J., & Stocks, J. (2012). Multi-ethnic reference values for spirometry for the 3-95-yr age range: The global lung function 2012 equations. The European Respiratory Journal, 40(6), 1324–1343. https:// doi.org/10.1183/09031936.00080312 Roman-Liu, D., Kamińska, J., & Tokarski, T. M. (2024). Population-specific
equations of age-related maximum handgrip force: A comprehensive review. PeerJ, 12, e17703. https://doi.org/10.7717/peerj.17703 Rutledge, J., Oh, H., & Wyss-Coray, T. (2022). Measuring biological age using omics data. Nature Reviews. Genetics, 23(12), 715–727. https://doi.org/10.1038/ s41576-022-00511-7 Ryu, H. S., Joo, Y. H., Kim, S. O., Park, K. C., & Youn, S. W. (2008). Influence of
age and regional differences on skin elasticity as measured by the Cutometer. Skin Research and Technology : Official Journal of International Society for Bioengineering and the Skin (ISBS) [and] International Society for Digital Imaging of Skin (ISDIS) [and] International Society for Skin Imaging (ISSI), 14(3), 354– 358. https://doi.org/10.1111/j.1600-0846.2008.00302.x Sarnak, M. J., Katz, R., Fried, L. F., Siscovick, D., Kestenbaum, B., Seliger, S., Rifkin, D., Tracy, R., Newman, A. B., & Shlipak, M. G. (2008). Cystatin C and aging success. Archives of Internal Medicine, 168(2), 147–153. https://doi.org/10.1001/ archinternmed.2007.40 Selman, M., & Pardo, A. (2021). Fibroageing: An ageing pathological feature driven
by dysregulated extracellular matrix-cell mechanobiology. Ageing Research Reviews, 70, 101393. https://doi.org/10.1016/j.arr.2021.101393 Shaaban, C. E., Rosano, C., Zhu, X., Rutherford, B. R., Witonsky, K. R., Rosso, A.
L., Yaffe, K., & Brown, P. J. (2023). Discordant Biological and Chronological Age: Implications for Cognitive Decline and Frailty. The Journals of Gerontology. Series A, Biological Sciences and Medical Sciences, 78(11), 2152–2161. https:// doi.org/10.1093/gerona/glad174 Sharma, D., Choudhary, N. S., Dhampalwar, S., Saraf, N., Duseja, A., Gautam, D., Soin, A. S., & Sud, R. (2023). Liver Stiffness Values in Persons with Normal Histology. Journal of Clinical and Experimental Hepatology, 13(1), 10–14. https://doi.org/10.1016/j.jceh.2022.10.008 Simrén, J., Andreasson, U., Gobom, J., Suarez Calvet, M., Borroni, B., Gillberg,
C., Nyberg, L., Ghidoni, R., Fernell, E., Johnson, M., Depypere, H., Hansson, C., Jonsdottir, I. H., Zetterberg, H., & Blennow, K. (2022). Establishment of reference values for plasma neurofilament light based on healthy individuals aged 5-90 years. Brain Communications, 4(4), fcac174. https://doi.org/10.1093/ braincomms/fcac174 Springer, B. A., Marin, R., Cyhan, T., Roberts, H., & Gill, N. W. (2007). Normative values for the unipedal stance test with eyes open and closed. Journal of Geriatric Physical Therapy (2001), 30(1), 8–15. https://doi.org/10.1519/00139143- 200704000-00003
Modular Organ Aging Framework in the Real World 67 Stojanovic, M., Popevic, M., Pekic, S., Doknic, M., Miljic, D., Medic-Stojanoska, M.,
Topalov, D., Stojanovic, J., Milovanovic, A., Petakov, M., Damjanovic, S., & Popovic, V. (2021). Serum Insulin-Like Growth Factor-1 (IGF-1) Age-Specific Reference Values for Healthy Adult Population of Serbia. Acta Endocrinologica (Bucharest, Romania : 2005), 17(4), 462–471. https://doi.org/10.4183/aeb.2021.462 Sukhonpanich, N., Ongphichetmetha, T., Uawithya, E., Jitprapaikulsan, J., Rattanathamsakul, N., Prayoonwiwat, N., & Siritho, S. (2025). Reference range for serum neurofilament light chain: Findings from healthy Thai adults. Brain Communications, 7(3), fcaf166. https://doi.org/10.1093/braincomms/fcaf166 Talboom, J. S., De Both, M. D., Naymik, M. A., Schmidt, A. M., Lewis, C. R., Jepsen,
W. M., Håberg, A. K., Rundek, T., Levin, B. E., Hoscheidt, S., Bolla, Y., Brinton, R. D., Schork, N. J., Hay, M., Barnes, C. A., Glisky, E., Ryan, L., & Huentelman, M. J. (2021). Two separate, large cohorts reveal potential modifiers of age-associated variation in visual reaction time performance. Npj Aging and Mechanisms of Disease, 7(1), 14. https://doi.org/10.1038/s41514-021-00067-6 Terekhova, M., Swain, A., Bohacova, P., Aladyeva, E., Arthur, L., Laha, A., Mogilenko, D. A., Burdess, S., Sukhov, V., Kleverov, D., Echalar, B., Tsurinov, P., Chernyatchik, R., Husarcikova, K., & Artyomov, M. N. (2023). Single-cell atlas of healthy human blood unveils age-related loss of NKG2C+GZMB−CD8+ memory T cells and accumulation of type 2 memory T cells. Immunity, 56(12), 2836–2854.e9. https://doi.org/10.1016/j.immuni.2023.10.013 Vieira-da-Silva, M. A., Bauab Filho, A. B., Imanichi, F., Lessa Silva, R. C., Marchiori
Vieira, L., Roma Uyemura, J., Humsi, M. J., Yugar-Toledo, J. C., Cosenso-Martin, L. N., & Vilela-Martin, J. F. (2025). The correlation between age, blood pressure variability and estimated pulse wave velocity. Scientific Reports, 15(1), 6990. https://doi.org/10.1038/s41598-025-91023-x Waas, T., Schulz, A., Lotz, J., Rossmann, H., Pfeiffer, N., Beutel, M. E., Schmidtmann, I., Münzel, T., Wild, P. S., & Lackner, K. J. (2021). Distribution of estimated glomerular filtration rate and determinants of its age dependent loss in a German population-based study. Scientific Reports, 11(1), 10165. https://doi.org/10.1038/ s41598-021-89442-7 Wang, Y.-C., Bohannon, R. W., Li, X., Sindhu, B., & Kapellusch, J. (2018). Hand-Grip
Strength: Normative Reference Values and Equations for Individuals 18 to 85 Years of Age Residing in the United States. The Journal of Orthopaedic and Sports Physical Therapy, 48(9), 685–693. https://doi.org/10.2519/jospt.2018.7851 Wang, Z., Wang, X., Chen, Z., Zhang, L., & Zhu, M. (2016). Distribution of High- Sensitivity C-Reactive Protein and Its Relationship with Other Cardiovascular Risk Factors in the Middle-Aged Chinese Population. International Journal of Environmental Research and Public Health, 13(9). https://doi.org/10.3390/ ijerph13090872 Yang, J., Christophi, C. A., Farioli, A., Baur, D. M., Moffatt, S., Zollinger, T. W., &
Kales, S. N. (2019). Association Between Push-up Exercise Capacity and Future Cardiovascular Events Among Active Adult Men. JAMA Network Open, 2(2), e188341. https://doi.org/10.1001/jamanetworkopen.2018.8341
LISTED IN THE AHFE DIGITAL BOOKSTORE CATALOGUE
Explore the complete digital volume
Healthcare and Medical Devices
Read this individual research paper free through the original publisher, or explore the full digital proceedings book.
ISBN 978-1-964867-87-8
Explore this ISBN in the AHFE Bookstore ↗Listed in the July 2026 bookstore catalogue; search by ISBN to confirm current availability · Digital book purchase optional